[
Unraveling critical dynamics: The formation and evolution of topological textures
Abstract
We study the formation of topological textures in a nonequilibrium phase transition of an overdamped classical O(3) model in dimensions. The phase transition is triggered through an external, time-dependent effective mass, parameterized by quench timescale . When measured near the end of the transition () the average texture separation and the average texture width scale as and , significantly larger than the single power-law predicted from the Kibble-Zurek mechanism. We show that Kibble-Zurek scaling is recovered at very early times but that by the end of the transition and result instead from a competition between the length scale determined at freeze-out and the ordering dynamics of a textured system. We offer a simple proposal for the dynamics of these length scales: and where and are determined by the freeze-out mechanism. and are dynamical length scales previously known from phase ordering dynamics, and is the freeze-out time. We find that and fit closely to the length scales observed at the end of the transition and yield and , in good agreement with the Kibble-Zurek mechanism. In the context of phase ordering these results suggest that the multiple length scales characteristic of the late-time ordering of a textured system derive from the critical dynamics of a single nonequilibrium correlation length. In the context of defect formation these results imply that significant evolution of the defect network can occur before the end of the phase transition. Therefore a quantitative understanding of the defect network at the end of the phase transition generally requires an understanding of both critical dynamics and the interactions among topological defects.
pacs:
PACS number(s): 05.70.Ln, 11.27.+d ,64.60Ht, 12.39.D UMDPP#00-038]
I Introduction
We live in a world of broken symmetry. From the crystalline structure of ice, no longer invariant under the full rotational and translational symmetry of liquid water, to the vacuum state of the standard model, the universe is filled with the patterns of symmetry breaking. Understanding the dynamical processes by which symmetry-breaking phase transitions occur is therefore of substantial physical importance. Topological defects, forged in nonlinear interactions as the system seeks its true vacuum, offer a window into the complex, nonequilibrium aspects of the phase transition. In systems with a topologically nontrivial vacuum manifold, fields in different spatial regions fall into different ground states and symmetry breaking may be accompanied by the emergence of a well-defined network of topological defects at the end of the transition [1]. Simple topological defects include domain walls, strings, monopoles and topological textures and are themselves the subject of much research in both cosmology and the laboratory [2] [3]. Systems containing topological textures are of particular interest as they provide an arena in which to explore myriad dynamical issues ranging from nonequilibrium phase transitions to the coarsening dynamics of quantum field theory.
A Topological defects in cosmology and the laboratory
Very little is known about the exact nature of the early universe before nucleosynthesis. However, many particle phenomenologies predict a unification of different forces at high energies, . If such unification exits then a rich pattern of symmetry-breaking phase transitions developed as the universe expanded and cooled. Phase transitions also occurred at the lower electroweak and QCD energy scales, although important physical details such as the exact order of the transitions remain unknown.
In the course of symmetry breaking, causality constrains the correlation length to grow no larger than the size of the horizon. Regions of space smaller than a horizon volume will rest in different vacua. For systems in which the vacuum manifold has nontrivial homotopy groups , topological defects may exist where different vacua meet. Topological defects formed in the early universe imprint themselves upon the fluctuations of the cosmic microwave background radiation (CMBR) and have been suggested as the generators of large scale structure formation (for a review see [2]). Much work has been done to compare measurements of the multipole moments of the CMBR anisotropies and numerical simulations of defect models. While the apparent lack of agreement between theory and observations is not immeadiately promising, the noisy nature of current measurements and the errors involved in doing large-scale numerical simulations of cosmological defect evolution make it difficult to rule out defect models of structure formation with any certainty (see for example [4]).
The study of topological defects in the early universe has been fruitful not only in attempting to explain precise cosmological data, but also in influencing the direction of cosmological research. One of the early motivations for the paradigm of inflation was the predicted overabundance of magnetic monopoles [5]. If monopoles are formed in a phase transition before or during an inflationary phase, their number density is safely diluted by the exponentially expanding scale factor. However, it has also recently been observed that in the very energetic process of reheating, as coherent oscillations of the inflaton decay into other fields, a nonthermal spectrum of topological defects may be produced, thus again raising the monopole problem [6]. The details of the reheating process and the possible formation of a defect distribution at the end of an inflationary phase are currently an area of active study [7].
Nonequilibrium phase transitions and the formation of topological defects are observed in many laboratory systems and the study of topological defects has helped forge links between the study of high energy processes in the early universe and condensed matter systems [8]. In liquid crystals, the formation of a network of topological string defects has been observed in the rapid cooling of the system through its critical point, demonstrating not only the viability of the Kibble mechanism in producing topological defects but also the scaling of the defect network [9]. Other condensed matter systems such as superfluid 3He, have complex symmetry-breaking patterns and offer many potential analogs to early universe processes [10].
Topological textures form in spatial dimensions when the vacuum manifold is such that is nontrivial. Unlike other topological defects, textured fields never leave the vacuum manifold but instead are “knots” of gradient energy, given relative stability by their topological winding around the vacuum. Like cosmic strings, the energy density in cosmological textures scales with the expansion of the universe so that textures formed in early universe phase transitions do not come to dominate the matter density. For this reason, global textures have been studied extensively as candidates for generators of large-scale structure formation [11, 12]. In condensed matter, topological textures are studied in a wide variety of (mostly two-dimensional) systems, from superconductors [13] and quantum hall ferromagnets [14] to superfluid [15].
B Nonequilibrium phase transitions and topological textures
The network of topological defects produced during a nonequilibrium phase transition contains dynamical information about the evolution of the phase transition. A rapid phase transition can create a topological defect density far above equilibrium values. The defect density decreases as the system equilibrates after the transition. However the topological stability of defects allows any defect overdensity to last for a substantial period of time. Current understanding of the dynamics of topological defect formation is summarized by the Kibble-Zurek mechanism which describes the emergence of a single nonequilibrium length scale characteristic of the initial defect density [8]. The freeze-out scale is derived by combining phenomenological ideas of near-equilibrium critical dynamics and equilibrium critical scaling and predicts a power-law dependence of the number of defects with the quench rate of the phase transition. Both theoretical [16] [17, 18, 19, 20, 21] and experimental [22, 23] effort has been focused on exploring the connection between the length scale of the initial defect distribution and the quench rate of the phase transition. These researches study the formation of topological defects that contain false vacuum in their cores: kinks in one dimension and vortices in 2 and 3 dimensions. Although (as explained below) the dynamics of a textured system can be qualitatively different, the details of the formation of topological textures in a nonequilibrium phase transition are mostly unexplored (see however [18]).
The dynamics of textured systems provides an ideal study for nonequilibrium phase transitions. Unlike other topological defects textures do not have a fixed size and the evolution of a textured system is complicated both by the poorly understood interactions between textures and by the changing scale of the texture itself. The richness of texture interactions involves multiple dynamical length scales. In dimensions it is observed that the phase-ordering of a system containing topological textures is characterized at late times by at least three length scales: the (average) texture size, texture-texture separation and texture-antitexture separation [24, 25]. In distinction, systems of topological defects such as domain walls, vortices or monopoles are effectively single-scale and are described at late-times only by the average defect separation. In a nonequilibrium phase transition the multiple independent length scales of textured systems are determined by the phase transition dynamics. However, the arguments of the Kibble-Zurek mechanism are ambiguous when applied to textured systems. Which, if any, of the multiple length scales observed in a texture distribution should we equate with the “frozen” correlation length?
C Organization
Section II reviews the properties of topological textures in dimensions and the scaling violations observed in textured systems when quenched from a disordered phase. In section III, we present the Kibble-Zurek mechanism and derive the single nonequilibrium freeze-out scale characteristic of the defect network at the time of formation. Section IV contains the model of a nonequilibrium phase transition, the numerical techniques used in the evolution and a description of the evolution of the phase transition given by the numerical solution. We also define the length scales used to characterize the texture distribution. Section V contains the main results of this work: an explanation of the quench rate dependence of the average texture separation and the average texture width observed near the end of the phase transition. We show that the Kibble-Zurek mechanism is recovered at early times but that by the end of the phase transition, formation dynamics and phase ordering dynamics are intrinsically linked. In Section VI these results are used to argue that textured systems carry an imprint of the freeze-out correlation length to late times and suggest this offers the possibility of novel, late-time measurements of dynamical critical phenomena. Concluding remarks are made in Section VII.
II Topological Textures in two spatial dimensions
The properties of systems containing topological textures differ in many ways from those containing other topological defects. To illustrate these differences, consider an O(3) invariant model with classical action,
| (1) |
and resulting equations of motion
| (2) |
For the classical dynamics that is of interest here the value of the quartic self-coupling and the mass parameter may be scaled to unity with an appropriate scaling of the field and spacetime units,
| (3) |
The vacuum manifold is characterized by , topologically a 2-sphere. When the field is constrained to the vacuum the action is that of a nonlinear sigma model (NLSM). For asymptotically uniform fields, a vacuum field configuration is a map
| (4) |
divided into distinct topological sectors by winding number [26]. In two spatial dimensions these windings are topological textures, topologically stable and static solutions with finite energy. For example, the following field configuration, a texture of negative unit winding, wraps around the vacuum 2-sphere exactly once,
| (5) |
At the origin, points in the direction while for it points in the opposite direction, . In between, at , the field points radially outward like a hedgehog. The parameter characterizes the size of the texture and is independent of the parameters of the action Eq. (1). The NLSM also possesses an exactly conserved topological charge , which is expressed as the integral over a topological charge density ,
| (6) | |||
| (7) |
For the single winding texture, Eq. (5), the topological charge density has a particularly simple form
| (8) |
with total topological charge . The energy of the single winding configuration Eq. (5) is simply , independent of the size of the texture. In accordance with Derricks theorem [27], the energy of a texture configuration in higher dimensions scales as a positive power of its size, demonstrating their instability to collapse. In lower dimensions textures are unstable to expansion. The stability of a texture configuration in any dimension can be altered by adding higher derivative terms to action Eq. (1), as was done in the Skyrme model of nucleons [28]. In contrast to other topological defects such as strings or monopoles, the texture core size is variable and independent of the fundamental parameters of the theory.
Although the energy of a single isolated topological texture is independent of its size, systems with multiple textures are not static. Textured systems order under the constraint of conserved topological charge Q. However, the details of texture interactions are not well understood. It is observed that textures and antitextures can annihilate with each other and that more isolated textures can decay by unwinding [24, 25]. The details of the unwinding process depend on the model under consideration. For the action Eq.(1) textures can decay by pulling the field off the vacuum manifold and unwinding. This is analogous to isolated textures in higher dimensions which are unstable to shrinking and unwind when their gradient energy is large enough to move them off the vacuum manifold. In a NLSM where the fields must remain on the vacuum manifold, textures can unwind through higher-derivative terms present in the lattice discretization.
A Topological textures and the violation of dynamical scaling
When a disordered system is quenched into the ordered phase (e.g. by the removal of thermal fluctuations) the approach to a new equilibrium and associated long-range order is through a sequence of nonequilibrium states. A simple example is the Ising ferromagnet in 3 spatial dimension. Above the Curie temperature, spins are randomly oriented and there is no net magnetization. A snapshot immeadiately following the quench of this system to zero temperature shows a system containing many domains in which the spins are coherently aligned. The net magnetization remains zero because the domains are randomly oriented with respect to each other. However, the true ground state of this system consists of only one domain and no domain walls. The system approaches this equilibrium through the dynamical process of coarsening during which small domains shrink and large domains grow. The process of coarsening has been studied extensively in both condensed matter systems and in the early universe (for reviews see [29] and [30]). The scaling hypothesis arose from these studies and states that, at late times, in a quench from a disordered state, the domain distribution is statistically characterized by a single dynamical scale which grows in time. For simple dissipative systems, the approach to () equilibrium is governed by model-A time-dependent Landau-Ginzburg (TDGL) dynamics for a nonconserved order parameter
| (9) |
It has been shown both theoretically and experimentally that the average domain size grows with time as
| (10) |
which is also the power-law predicted by a dimensional analysis of Eq. (9). Not all systems coarsen in such a simple way and there is currently no general theoretical framework in which to explain why some systems scale while others do not. In particular, systems containing topological textures in one and two spatial dimensions are strong exceptions to the scaling hypothesis [24, 25, 31]. In a dimensional O(3) model with dissipative dynamics and an instantaneous quench from the disordered phase, late-time coarsening of topological textures is described by at least three different length scales [24, 25]. These three length scales are the average defect-defect separation , the average defect width , and the average texture-antitexture separation . The scaling hypothesis is violated since at late times these three length scales are observed to grow with different powers of time
| (11) | |||
| (12) | |||
| (13) |
where is the correlation length in the disordered phase. It is remarkable that length scales describing the late-time ordering of textures retain a dependence on the initial correlation length. In distinction, systems that obey the scaling hypothesis erase any memory of their initial state and at late times retain only a dynamical scale (Eq. (10) for the case of the ferromagnet). The scaling of systems that contain topological defects such as vortices implies that the vortex distribution at late times is independent of the dynamical details of the phase transition. For textured systems it is not possible to have such a clean separation between the dynamics of the phase transition and the late-time texture distribution. In the context of a nonequilibrium phase transition is determined not from initial conditions but from the Kibble-Zurek mechanism, thus connecting early-time critical dynamics and late-time coarsening. In Section VII we discus how this connection may provide late-time probes of nonequilibrium critical dynamics.
III The Kibble-Zurek Mechanism of Defect Formation
Before analyzing the dynamics of topological texture formation it is useful to review the basic Kibble-Zurek mechanism. The first estimate of the initial defect density in a cosmological context was made by Kibble [1]. The basic ingredients of the Kibble mechanism are causality and the Ginzburg temperature, . The Ginzburg temperature is defined as the temperature at which thermal fluctuations contain just enough energy for correlated regions of the field to overcome the potential energy barrier between inequivalent vacua,
| (14) |
where is the difference in free energy density between the true and false vacua and is the equilibrium correlation length. In the Kibble mechanism, the length scale characterizing the initial defect network is set by the equilibrium correlation length of the field, evaluated at . In a recent series of experiments [23], the Kibble mechanism was tested in the laboratory. The results, while confirming the production of defects in a symmetry-breaking phase transition, indicate that does not set the characteristic length scale of the initial defect distribution. These experiments were suggested by Zurek, who criticized Kibble’s use of equilibrium arguments and the Ginzburg temperature, [8].
Combining equilibrium and non equilibrium ingredients, Zurek offers a “freeze-out” proposal to estimate the initial density of defects. In the Zurek proposal, above the critical temperature, the field starts off in thermal equilibrium with a heat bath. As the temperature of the bath is lowered adiabatically, the field remains in local thermal equilibrium with the heat bath. Near the phase transition, the equilibrium correlation length and the equilibrium relaxation time of the field grow without bound as
| (15) | |||
| (16) |
where characterizes the proximity to the critical temperature,
| (17) |
and and are critical exponents appropriate for the theory under consideration. The quench is assumed to occur linearly in time
| (18) |
so that for , the temperature of the heat bath is above the critical temperature and the critical temperature is reached at . The divergence of the equilibrium relaxation time as the heat bath approaches the critical temperature is known as critical slowing down. Critical slowing down results from the finite speed of propagation of perturbations of the order parameter. As the correlation length diverges, small perturbations of the order parameter (e.g., lowering of the temperature) take longer to propagate over correlated regions and therefore it takes longer to reach equilibrium. As the critical temperature is approached from above there comes a time during the quench when the time remaining before the transition equals the equilibrium relaxation time
| (19) |
Beyond this point the correlation length can no longer adjust fast enough to follow the changing temperature of the bath. At time t* the dynamics of the correlation length “freezes”. The correlation length remains frozen until a time t* after the critical temperature is reached. In Zurek’s proposal the correlation length at the “freeze-out” time t* sets the characteristic length scale for the initial defect network. Solving for the value of the correlation length at t*, the frozen correlation length, and therefore the initial defect density, scale with the quench rate as
| (20) |
The power-law scaling of the topological defect density with the quench rate has been verified using 1-dimensional, 2-dimensional and 3-dimensional simulations of phenomenological time-dependent Landau-Ginzburg equations [17, 18, 19, 20] and in nonequilibrium quantum field theory [21]. However, experimental efforts to test the Kibble-Zurek prediction in condensed matter systems are inconclusive, lacking reliable error estimates and a mechanism to vary the quench rate [22]. In particular, quenches in and high-temperature superconductors do not seem to produce defect densities at the level expected from the freeze-out mechanism.
IV Critical Dynamics
In order to study the dynamical formation of topological texture the equations of motion Eq. (2) are modified with an externally controlled time-dependent effective mass,
| (21) |
where is the quench rate and defines the critical point where spinodal instabilities, characteristic of a second order phase transition, begin to grow. Both in the early universe and in the laboratory, texture formation occurs in an environment containing many other degrees of freedom. The effect of the environment is assumed to be that of a stochastic (white) noise driving term and simple ohmic dissipation, obeying a fluctuation-dissipation relation. The field equations of motion are
| (22) |
where the fluctuation-dissipation relation is
| (23) |
The use of a time-dependent mass in the equations of motion of this dimensional model deserves comment. At the effective mass is positive and the system fluctuates around the false vacuum . When t reaches the system is destabilized and the fields begin to roll to the true vacuum . This behavior mimics that of a phase transition in spacetime dimensions. It is well-known that there is no continuous symmetry breaking and accompanying long range order in spatial dimensions of two or less [32]. Therefore the time dependence of the effective mass does not come from changing a thermodynamic variable, such as temperature. However, though the dimensional action of Eq. (1) has no finite-temperature equilibrium phase transition there can still be an effective dynamical transition. When energy is dissipated, a high temperature initial state dominated by short wavelength thermal fluctuations will eventually evolve into a state dominated by long wavelength topological textures. Textures become quasi-stable excitations when the effective temperature drops substantially below the texture energy of . The use of an external time-dependent effective mass allows for a controlled passage between the fluctuation-dominated and texture-dominated phases. Within this controlled setting the role of the quench rate in the formation of texture can be isolated and studied effectively. The lessons learned are applicable to more realistic phase transitions, both in the early universe and in the laboratory.
A Numerical parameters and techniques
The dynamics of the non-linear stochastic system was solved numerically. Eq. (22) was discretized on a 2-dimensional lattice using a standard second-order leapfrog method for the time evolution [12, 33, 34] and a second-order spatial discretization for the laplacian ,
| (28) | |||||
| (29) |
where and . The labels identify the lattice point and labels the time step. At each time step and each lattice point the noise is generated through a sum of randomly distributed numbers [35]
| (31) |
where are a set of random numbers. In the limit when the distribution approaches that of a Gaussian with the variance required for the fluctuation-dissipation relation Eq. (23). In practice was used and no change in the dynamics was observed for larger . The timestep was and the lattice spacing was fixed at on a square lattice with sites per side. There are three physical parameters in the system, the quench rate , the dissipation constant , and the initial temperature . The quench rate was varied between and . Faster quenches (smaller ) deviate from the observed power-law behavior and asymptote to the behavior characteristic of an instantaneous quench as has been previously observed [19]. Longer quenches are in principal possible but take substantially more computer time. The dissipation constant was chosen at to produce relatively overdamped behavior. The evolution equations were supplemented with initial conditions generated by solving the equilibrium dynamics of Eq. (22) with a value of the effective mass fixed at one quench timescale from the critical point,
| (32) |
Run times for the system to reach an order parameter of on a DEC 500 Mhz workstation varied from hours for to days for .
B Properties of the texture distribution
Field configurations obtained from numerical simulations provide an embarrassment of riches. In order to explore fully the participation of topological textures in the dynamics of the phase transition it is necessary to cull from the abundance of information contained in the snapshots of the topological field configurations, a few well-chosen functions whose time evolution provides a clear indication of the dynamics. The late-time coarsening of a textured system is described by at least three different length scales [24, 25], the average defect-defect separation , the average defect width , and the average texture-antitexture separation . In the formation dynamics studied here we were able to measure reliably only and . These length scales are defined through the the topological charge density and the topological defect two-point correlation function. Consider the two-point defect density correlation function
| (33) |
where denotes average over the lattice. Define the normalized correlation function
| (34) |
is a statistical measure of the “lumps” in the defect density function . The average texture width is proportional to the half-height scale of defined by
| (35) |
To measure the average texture separation consider
| (36) |
counts the total number of topological defects in the system without distinguishing between textures and antitextures. On dimensional grounds,
| (37) |
where measures the average separation of the topological defects and is the physical size of the lattice which did not vary between runs. These two length scales, and , provide a detailed characterization of the topological texture network at the end of the transition. In principle, each scale offers a different window into the nonequilibrium phase transition.
C The dynamics of symmetry breaking
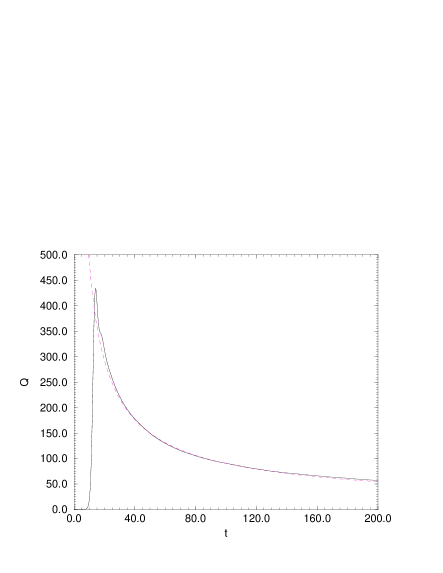
Plots of the time evolution of the order parameter and the total number of topological defects are shown in figures (1) and (2) respectively. The plots correspond to an evolution with quench parameter . In the symmetric state both and are close to zero. When the external effective mass is negative and the fields, kicked by the small stochastic force , begin to roll to the true vacuum . The order parameter is a measure of the number of lattice points where the fields have fallen to the true vacuum. As increases both the gradient energy and the number of defects increase. However as most of the lattice is near the ground state vacuum and the defect formation process is over. After formation, the defect density does not remain constant but decreases slowly as texture-texture and texture-antitexture interactions dominate.
V Unraveling critical dynamics
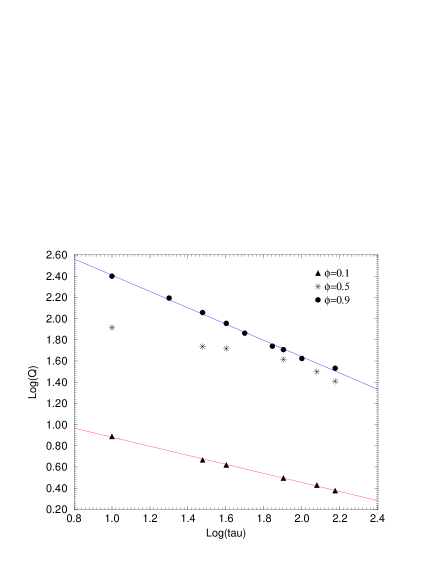
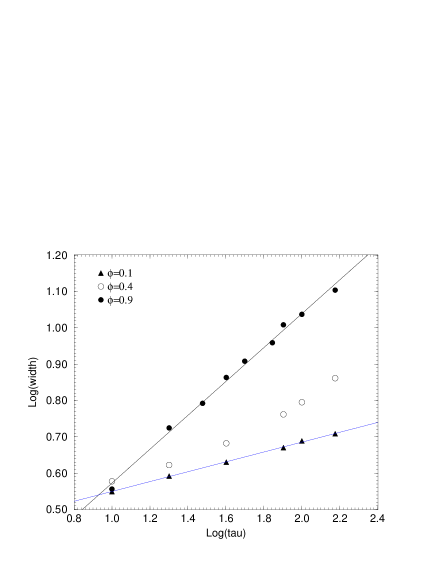
Figures (3) and (4) show Log-Log plots of the average number of textures and the average texture width versus the quench rate. The top graph in each figure displays the average number of textures and the average texture width measured near the end of the transition, taken to be the point where . The data are well-described by the power-law scalings
| (38) | |||
| (39) |
The best-fit exponents were derived using equal weighting for all lattice measurements. As we found no reliable means to estimate the error in individual lattice measurements, the errors in the scaling exponents arise from statistical errors in the fit. Certainly, power-law scaling is expected from the freeze-out picture. However, the Kibble-Zurek mechanism also provides a precise prediction for the value of the power-law exponent as derived from equilibrium critical exponents. The model under consideration is a mean field model and the only role of the small fluctuations is to seed texture formation. Therefore it is expected that , the mean field value of equilibrium correlation length exponent. This expectation was verified by equilibrium lattice simulations. With and the dynamics is overdamped at freeze-out. Therefore and the Kibble-Zurek mechanism predicts the scaling , in obvious disagreement with Eq. (38).
The larger observed exponent means that for longer quenches topological textures are both less numerous and bigger than the Kibble-Zurek mechanism predicts. However, slower quenches take longer for the phase transition to complete since as increases, the order parameter rolls more slowly. In fact, observations of the dynamics show that the time (measured from the critical point) it takes for the order parameter to reach increases with in a simple way . With more time to evolve between freeze-out and the end of the transition, slower quenches allow for more interactions among the texture distribution. This suggests that the apparent power-laws observed at the end of the transition are not indicative of a single scale but a combination of the Kibble-Zurek mechanism and the dynamical length scales of the evolving texture network.
Evolution of the power law exponents of the texture length scales is clearly indicated in the two lower graphs of figures 3 and 4. The lowest graph in each figure displays the average number of textures and the average texture width measured very early in the transition when . At these early times the effect of coarsening dynamics is insignificant and power-law scaling indicative of the Kibble-Zurek mechanism is evident,
| (40) | |||
| (41) |
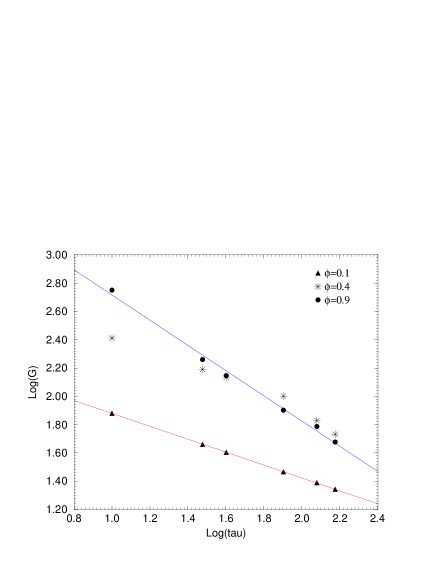
Although the power law exponent of is slightly smaller than predicted by the Kibble-Zurek mechanism, the difference is not likely to be significant. Textures are not well-formed at these early times and the method for measuring is sensitive to the details of the two-point function. In the middle graphs of each figure, the number of textures and the texture width were measured at intermediate times. Both show the crossover from formation dynamics to coarsening dynamics as longer quenches develop a steeper power-law indicative of texture interactions. A similar picture of the evolution of is given by the total gradient energy 5.
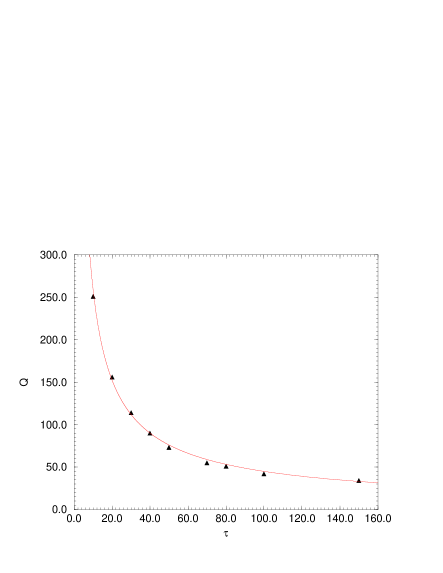
Figures 3 and 4 provide clear evidence of the evolution of the power-laws characterizing the length scales of the texture distribution. It is also possible to use the knowledge of texture coarsening dynamics to provide a quantitative understanding of the power-laws observed at the end of the transition. As discussed in section IIA, the phase ordering of a textured system results in a dynamical length scale characterizing the separation of defects, . The dynamics of this length scale for a fast quench (which enters the coarsening regime earlier) is shown in Figure 8. In the instantaneous quenches of [25] was identified with the initial correlation length. In a dynamical quench it is more natural to identify with the freeze-out correlation length. Combining the Kibble-Zurek mechanism with phase ordering dynamics I suggest that the evolution of the scale characterizing the separation of topological textures is given by
| (42) |
where is the length scale determined by the Kibble-Zurek mechanism, is the time from “freeze-out” and t is the time from the critical point. Although Eq. (42) is slightly complicated, its form is tightly constrained and the only free parameter is , the exponent of the freeze-out correlation length. When , the expected number of defects is matched against the number of defects determined from the numerical simulations. A plot of the data and the best-fit length scale is shown in figure 6. To obtain the fit one data point is used to normalize the scale and a value of is determined by minimizing . By using, in turn, each data point as a normalization a spread in the value of is obtained. The best-fit value of is taken as the average over all normalizations and the error is the standard deviation. As determined from these fits, in excellent agreement with expected from the Kibble-Zurek mechanism.
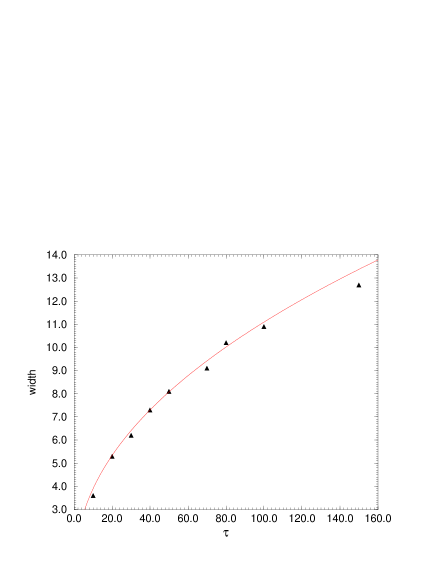
The dynamics of , the length scale characterizing the size of topological textures, is more complicated. Figure 9 provides an example of texture width dynamics for . In the simulations the texture width was observed to grow in time with a power law near the simple coarsening dynamics predicted for an overdamped model . However, this growth rate is different from previously reported studies of the late-time dynamics of the texture width. Consistent with previous studies [25] it is possible that reaches its asymptotic dynamics only at later times. It is also possible that is contaminated at early times by topologically trivial spin configurations whose decay then dominates the dynamics. The resolution of this issue requires a more accurate method of counting textures e.g. by looking explicitly at the winding around the vacuum manifold. Whatever the mechanism, Figure 9 shows that can evolve significantly between the early and late periods of the phase transition. As a concrete equation, I suggest that the evolution is given by
| (43) |
is the length scale determined by the Kibble-Zurek mechanism, is the time from “freeze-out” and t is the time from the critical point. As before, when , the expected width of the textures is matched against the width determined from the numerical simulations. A plot of the data and the best-fit length scale is shown in figure 7. The fits were obtained in the same way as for . As determined from these fits, also in agreement with expected from the Kibble-Zurek mechanism.
It is clear from Figs. (6) and (7) that the power-laws of equation (38) can be explained by incorporating texture dynamics. Eqns. 43 and 42 offer a conservative, simple guess to the proper combination of formation and coarsening dynamics. A more complete analysis, with better techniques for identifying textures, would fit and to functions with both general formation and coarsening exponents. Nonetheless it is remarkable that these simple equations are in good agreement with the Kibble-Zurek mechanism. Even if the exact form of Eqns. (42) and (43) changes, the observation remains that the length scales characterizing the topological defect distribution at the end of the phase transition are a combination of defect interaction and formation dynamics.
It is not surprising that defect interactions can influence the properties of the defect network before the end of the transition. Although the long-wavelength dynamics is very slow until after the freeze-out time (in the overdamped case), the time to complete the phase transition is allowing plenty of time for even partially formed defects to influence each other. In previous numerical simulations in 1 and 2 dimensions [17, 18, 19] this effect was not noticeable (in overdamped evolutions) because the interactions between defects were extremely weak. In a recent simulation of global vortex formation in 3 dimensions [20] one might expect an observable change in the scaling exponents since the defect interactions are much stronger. However, the transition was at relatively high temperature and the defects were at least partially screened by thermal fluctuations.
VI Texture Coarsening and the Kibble-Zurek mechanism
The close agreement between Eqns. (42) and (43) and the length scales observed at the end of the transition provides evidence that the a priori independent length scales, and , are formed by the same nonequilibrium dynamics of the Kibble-Zurek mechanism. That this should be so is not obvious. In fact, the Kibble-Zurek mechanism can be questioned even in models which at late times depend only upon a single scale. In [36] it was argued argued that the length scales defined by the field correlation length and vortex density, in principle, derive from different attributes of the power spectrum. Only under restricted circumstances does the defect separation follow the field correlation length and scale with the quench rate. However, the quench considered here was deep into the spinodal region and the early-time power spectrum is dominated by a single peak with momentum in the low-momentum modes. When the power spectrum is strongly peaked, the freeze-out correlation length determines a unique scale at early times to which all other length scales are connected.
A Late-time dynamics and Experiments
The strong violation of the scaling hypothesis observed in the coarsening of dimensional textured systems suggests the possibility of novel, late-time measurements of early-time critical dynamics. As discussed in section (IIA), the coarsening of a textured system with an instantaneous quench retains “memory” of a length scale , the correlation length in the disordered phase. In a nonequilibrium phase transition it is the freeze-out correlation length, determined by the Kibble-Zurek mechanism, and not the correlation length of the initial state, that scars the texture distribution at late times. For overdamped coarsening dynamics at late times,
| (44) |
The freeze-out correlation length can be measured by a late-time measurement of the (average) texture width and texture separation. It is the particular (and not well-understood) dynamics of texture-texture interactions that produces strong scaling violations and unusual memory effects. In contrast, experimental probes of vortex formation in nonequilibrium phase transitions of and are hampered by the details of the interacting vortex distribution. Because these systems approach a scaling solution at late times, vortex interactions work to erase any memory of the initial state. This is a particular problem in the experiments where the vortex network is experimentally observable only at later times and the number of initial defects must be inferred using detailed assumptions about the decay of the vortex tangle.
Textured systems in dimensions can be created in the laboratory. If their dynamics are approximately described by Eq. (22) then late-time experimental measurements of the Kibble-Zurek mechanism are possible. Topological textures can also be formed during phase transitions in dimensions in superfluid and the early universe. In dimensions without additional higher derivative terms in the action, topological textures are unstable. In this case the dynamics of coarsening is complicated by texture collapse. However, as long as textures exist in the system scaling violations and associated dynamical memory are possible.
VII Conclusion
In this work, we exploited the multiple length scales of a textured system to study a nonequilibrium phase transition of an overdamped classical 0(3) model in dimensions. At very early times, we identified power-law scaling characteristic of the Kibble-Zurek mechanism and a single freeze-out scale. This suggests that the multiple length scales characteristic of the late-time ordering of a textured system derive from the critical dynamics of a single nonequilibrium correlation length.
When observed near the end of the phase transition, we found the scaling of the texture separation and the texture width results instead from a competition between the length scale determined at freeze-out and the ordering dynamics of a textured system. We expect that this observation is not restricted to systems of topological textures or to low dimensions but is relevant anytime defect interactions are significant. It is not surprising that defect interactions can significantly modify the defect distribution even before the end of the phase transition. Well before defects are fully formed they frustrate the system from its true minimum energy ground state and interact with eachother.
The Kibble-Zurek mechanism provides a useful connection between critical dynamics and the length scales of the topological defect distribution observed at the end of the phase transition. However, power-law scaling provides a rough and rather opaque window into the complicated nonequilibrium processes of the phase transition. As demonstrated explicitly here, power-law scaling can also arise from completely different mechanisms such as defect interactions. To understand the characteristics of the topological defect distribution at the end of the transition it is therefore important to look closely both at the nonequilibrium dynamics of the phase transition and the evolution of the defect network.
Acknowledgments
This work is supported in part by the National Science Foundation under grant PHYS-9800967. I would like to thank Esteban Calzetta and Bei-Lok Hu for very useful criticisms and interesting discussions. I would also like to thank the National Scalable Computer Project at the University of Maryland for access to computing resources.
REFERENCES
- [1] T. W. B. Kibble, J. Phys. A9, 1387 (1976).
- [2] A. Vilenkin and E. P. S. Shellard, Strings and Other Topological Defects, (Cambridge Univ. Press, Cambridge, UK 1994).
- [3] D. Mermin, Rev. Mod. Phys. 51, 591 (1979).
- [4] R. Durrer, M. Kunz and A Melchiorri, Phys. Rev. D59, 123005 (1999).
- [5] A. H. Guth, Phys. Rev. D23, 347 (1981).
- [6] L. Kofman, A. Linde and A. A. Starobinsky, Phys. Rev. Lett. 76, 1011 (1996).
- [7] S. Kasuya and M. Kawasaki, Phys. Rev. D56, 7597 (1997). I. Tkachev, S. Khlevnikov, L. Kofman and A. Linde, [Report. No. hep-ph/9805209]. B. A. Bassett and F. Tamburini, [Report. No. hep-ph/9804453], to be published in Phys. Rev. Lett. B. A. Bassett, D. Kaiser and R. Maartens, [Report No. hep-ph/9808404].
- [8] W. H. Zurek, Nature 317, 505 (1985): W. H. Zurek Phys. Rep. 276, 178 (1996).
- [9] I. Chuang, R. Durrer, N. Turok, and B. Yurkee, Science 251, 1336 (1991); M. J. Bowick, L. Chandar, E. A. Schiff, and A. M. Srivastava, Science 263, 943 (1994).
- [10] G. E. Volovik “3He and Universe Parallelism”, [Report No. cond-mat/99021710], (1999). G. E. Volovik “Superfluid 3He, Particle Physics and Cosmology”, [Report No. cond-mat/9711031], (1997).
- [11] N. Turok, Phys. Rev. Lett. 63, 2625 1989.
- [12] D. N. Spergel, N. Turok, W. H. Press and B. S. Ryden, Phys. Rev. D 43, 1038 (1991).
- [13] A. Knighavko, B. Rosenstein and Y. F. Chen, “Magnetic skyrmions and their lattices in triplet superconductors”, [Report No. cond-mat/9901249] (1999).
- [14] A. Travesset, “Quantum hall effect, skyrmions and anomalies”, [Report No. cond-mat/9808211] (1998).
- [15] M. M. Salomaa and G. E. Volovik, Rev. Mod. Phys. 59, 533 (1987).
- [16] R. J. Rivers “Slow Quenches Produce Fuzzy, Transient Vortices”, [Report no. cond-mat/9909249] (1999); T. W. Kibble and G. E. Volovik, JETP Lett. 65, 102 (1997);
- [17] P. Laguna and W. H. Zurek, Phys. Rev. Lett 78, 2519 (1997).
- [18] J. Dziarmaga, “Density of Bloch Waves after a Quench”, [Report No, cond-mat/9805215] (1998).
- [19] A. Yates and W. H. Zurek, Phys. Rev. Lett 80, 5477 (1998).
- [20] N. D. Antunes, L. M. A. Bettencourt and W. H. Zurek, Phys. Rev. Lett. 82, 2824 (1999).
- [21] G. J. Stephens, E. A. Calzetta, B. L. Hu and S. A. Ramsey, Phys. Rev. D59, 045009 (1999).
- [22] P. C. Hendry et al, Nature 368, 315 (1994); C. Bauerle et al, Nature 382, 332 (1995); M. E. Dodd et al, J. Low Temp. Phys. 115, 89 (1999); R. Carmi and E. Polturak, “Search for Spontaneous Nucleation of Magnetic Flux During Rapid Cooling of YBCO films Through Tc”, [Report no. cond-mat/9908244] (1999).
- [23] V. M. Ruutu et al, Nature 382, 334 (1996);
- [24] M. Zapotocky and W. Zakrzewski, Phys. Rev. E51, R5189 (1995).
- [25] A. D. Rutenberg, Phys. Rev. E51, R2715 (1995).
- [26] A. A. Belavin and A. M. Polyakov, JETP lett. 22, 245 (1975).
- [27] G. H. Derrick, J. Math. Phys. 5, 1252 (1964).
- [28] T. H. R. Skyrme, Proc. Roy. Soc., A260, 127 (1961).
- [29] A. J. Bray, Adv. phys. 43, 357 (1994).
- [30] M. B. Hindmarsh and T. W. B. Kibble, Rep. Prof. Phys, 58, 477 (1995).
- [31] A. D. Rutenberg and A. J. Bray, Phys. Rev. E51, R1641 (1995).
- [32] N.D. Mermin and H. Wagner, Phys. Rev. Lett. 22, 1133 (1966).
- [33] N. D. Antunes and L. M. A. Bettencourt, Phys. Rev. D55, 225 (1997).
- [34] W. H. Press, B. S. Ryden and D. N. Spergel, Ap. J. 346, 590 (1989).
- [35] F. J. Alexander, S. Habib, and A. Kovner, Phys. Rev.E48, 4284 (1993).
- [36] G. Karra and R. J. Rivers, Phys. Lett. B414, 28 (1997).