On the Interpretation of the Atmospheric Neutrino Data in Terms of Flavor Changing Neutrino Interactions
Abstract
Flavour changing (FC) neutrino–matter interactions have been proposed as a solution to the atmospheric neutrino anomaly. Here we perform the analysis of the full set of the recent 52 kTy Super-Kamiokande atmospheric neutrino data, including the zenith angle distribution of the contained events as well as the higher energy upward–going stopping and through-going muon events. Our results show that the FC mechanism can describe the full data sample with a d.o.f which is acceptable at the 90 % confidence level. The combined analysis confines the amount of FC to be either close to maximal or to the level of about (10–50)%.
pacs:
PACS numbers: xxxI Introduction
Neutrinos produced as decay products in hadronic showers from cosmic ray collisions with nuclei in the upper atmosphere [1] have been observed by several detectors [2, 3, 4, 5, 6, 8]. Although the absolute fluxes of atmospheric neutrinos are largely uncertain, the expected ratio of the muon neutrino flux () over the electron neutrino flux () is robust, since it largely cancels out the uncertainties associated with the absolute flux. In fact, this ratio has been calculated [1] with an uncertainty of less than 5% over energies varying from 0.1 GeV to 100 GeV. In this resides our confidence on the long-standing atmospheric neutrino anomaly.
Although the first iron-calorimeter detectors in Fréjus [2] and NUSEX [3] reported a value of the double ratio, R() = , consistent with one, all the water Cerenkov detectors Kamiokande [4], IMB [5] and Super-Kamiokande [6] have measured R() significantly smaller than one. Moreover, the Soudan-2 Collaboration, also using an iron-calorimeter, reported a small value of R() [8], showing that the so-called atmospheric neutrino anomaly was not a feature of water Cerenkov detectors.
Recent Super-Kamiokande high statistics observations [6] indicate that the deficit in the total ratio R() is due to the number of neutrinos arriving in the detector at large zenith angles. Although -like events do not present any compelling evidence of a zenith-angle dependence, the -like event rates are substantially suppressed at large zenith angles.
The as well as the [9, 10] oscillation hypothesis provides a very good explanation for this smaller-than-expected ratio, which is also simple and well-motivated theoretically. This led the Super-Kamiokande Collaboration to conclude that their data provide good evidence for neutrino oscillations and neutrino masses [11]. However, alternative explanations to the atmospheric neutrino data have been proposed in the literature including the possibility of neutrino decay [12], the violation of relativity principles [13, 14] or the violation of CPT symmetry [15]. These explanations, however, have been challenged by the precise data of Super-Kamiokande on upward going muon events [16] which allows to study the energy dependence of the neutrino survival (or disappearance) probability [17, 18]. Based on such observations, both the possibility of an explanation of the anomaly in terms of neutrino decay [19] as well as the violation of relativity principles or the violation of CPT symmetry [18], have been disfavoured.
In Ref. [20] an alternative explanation of the atmospheric neutrino data in terms of FC neutrino-matter interactions [21] was proposed, and it was shown that even if neutrinos have vanishing masses and/or the vacuum mixing angle is negligible, FC neutrino matter interactions could account for the Super-Kamiokande results on contained events providing an excellent description to the data, statistically as good as neutrino oscillations. The validity of this explanation was first questioned in Ref. [17] where the authors presented arguments against the FC neutrino-matter interaction solution on the basis of a fit to the up-going muons data from SuperKamiokande.
In this paper we re-analyze the possibility of explaining the atmospheric neutrino anomaly by means of conversion induced by flavour–changing neutrino–matter interaction which can be effective during the neutrino propagation in the Earth. We extend the analysis of Ref. [20] to the new set of Super-Kamiokande data by including also the up-going muon samples.
II Massless Neutrino Evolution with FC Interaction
In our phenomenological approach we assume that the evolution equations which describe the transitions in matter may be written as
| (7) |
where () are the probability amplitudes to find these neutrinos at a distance from their creation position, is the forward scattering amplitude and is the difference between the and elastic forward scattering amplitudes, with being the number density of the fermions which induce such processes.
The parameters and contain the information about FC neutrino interactions. Such FC interactions may be accompanied by neutrino mass [22] but this need not be the case [23, 24]. One description would be to parametrize directly the FC interactions in terms of an effective four-fermion Hamiltonian. This could, for instance, arise by renormalization effects from the unification scale down to the electroweak scale in, say, supergravity models [24]. An alternative more phenomenological way is to consider the existence of a tree–level FC process where is an elementary fermion (charged lepton or quark). The interaction can be mediated by a scalar or vector boson of mass and the neutrino–fermion coupling is generically denoted by ( is a flavour index) and can be written as
| (8) |
Since we are assuming vanishing neutrino masses, the anti–neutrino transitions are governed by the same evolution matrix given in Eq. (7). For the sake of simplicity, we consider and , which implies that we have only two free parameters in the analysis. Moreover, we set our normalization on these parameters by assuming that the relevant neutrino interaction in the Earth is only with down-type quarks. One could also assume that the incoming atmospheric neutrino has FC interactions off-electrons or equivalently, due to charge neutrality, off-up-type quarks. For simplicity, in the present analysis we consider only the case of interactions on down-type quarks.
III Fitting the Data to the FC Hypothesis
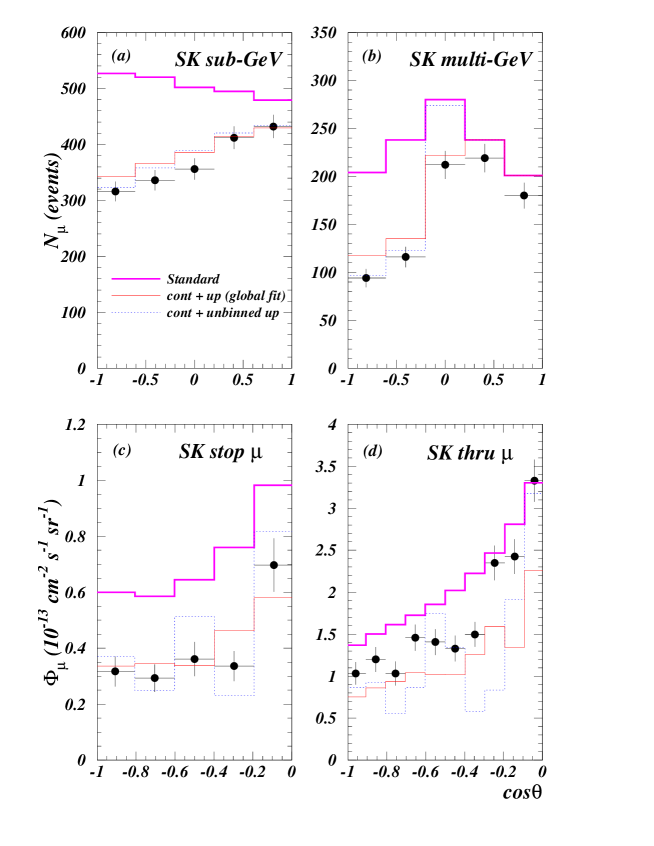
We have then used these probabilities to compute, as a function of the two parameters, and , the theoretically expected numbers of events for the four sets of data reported by Super-Kamiokande: sub-GeV, multi-GeV, stopping muons and through-going muons. The expected number of contained events are computed by convoluting the probability with the corresponding neutrino fluxes (for which we use the Bartol calculations [1]) and interaction cross sections and taking into account the experimental efficiencies as detailed in Ref. [9]. For the up-going muon samples we obtain the effective muon fluxes for both stopping and through-going muons by convoluting the probabilities with the corresponding muon fluxes produced by the neutrino interactions with the Earth. We include the muon energy loss during propagation both in the rock and in the detector according to [27, 28] and we take into account also the effective detector area for both types of events, stopping and through-going. We compute the effective area using the simple geometrical picture given in Ref. [29]. Our final results show good agreement with the full MC simulation of the Super-Kamiokande collaboration in the Standard Model case (see the thick solid line in Fig. 3.)
In our statistical analysis we adopted the technique [9, 30] of fitting separately the angular distributions of the - and -like contained events ( and , stands for sub-GeV and multi-GeV) and the up-going muon fluxes (, stopping, through-going). The expected number of events have been compared with the recent 52 kTy data reported by the Super-Kamiokande Collaboration [7] and the allowed regions in the (, ) plane have been determined from a fit. In constructing the function, we explicitly take into account the correlation of errors, both of theoretical and experimental origin. Details on the definition of the correlation matrix for contained events can be found in Ref. [9], while the definition of the sources of errors and their correlations for the up-going muons fluxes are given in Ref. [31, 30]. Here we simply summarize that we consider the overall normalization of the up-going muon fluxes to be affected by an uncertainty of 20% but in order to account for the uncertainties in the primary cosmic ray flux spectrum we allow a 5% variation in the ratio between muon events in different energy samples. We further introduce a 10% theoretical error in the ratio of electron-type to muon-type events of the different samples. Other important source of theoretical uncertainty arises from the neutrino interaction cross section which at Super-Kamiokande ranges from 10–15 %. Uncertainties in the ratio between different angular bins are treated, similarly to Ref. [30], by allowing a variation of 5% times the difference between the mean bin cosines. With our definition we obtain, for instance, 122/(35 d.o.f) which means that the SM has a CL of ! Using this same function for the case of oscillations we obtained allowed regions for masses and mixing angles very similar to those obtained by the Super-Kamiokande collaboration both for contained events as well as for upward going muons [9].
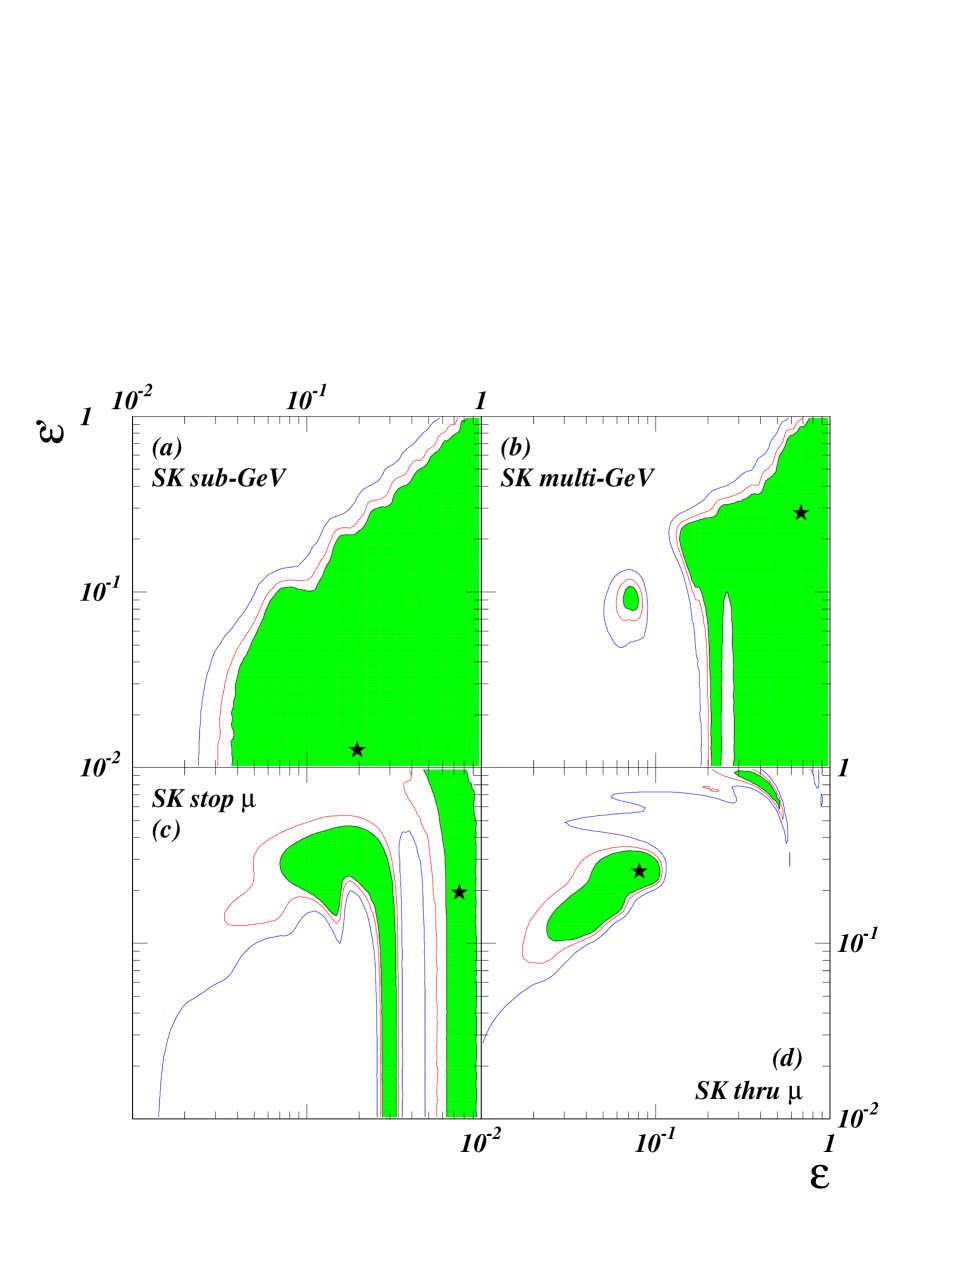
In Fig. 1 we show the contours of the regions allowed by the Super-Kamiokande data. The different panels of the figure refer to the fits performed over the different sets of data separately: (a) sub-GeV; (b) multi-GeV; (c) stopping muons; (d) through-going muons. The shaded areas are the regions allowed at 90% C.L., while the dashed and dotted contours refer to 95 and 99 % C.L., respectively. The condition used to determine the allowed regions is: where for 90, 95 and 99 % C. L., respectively.
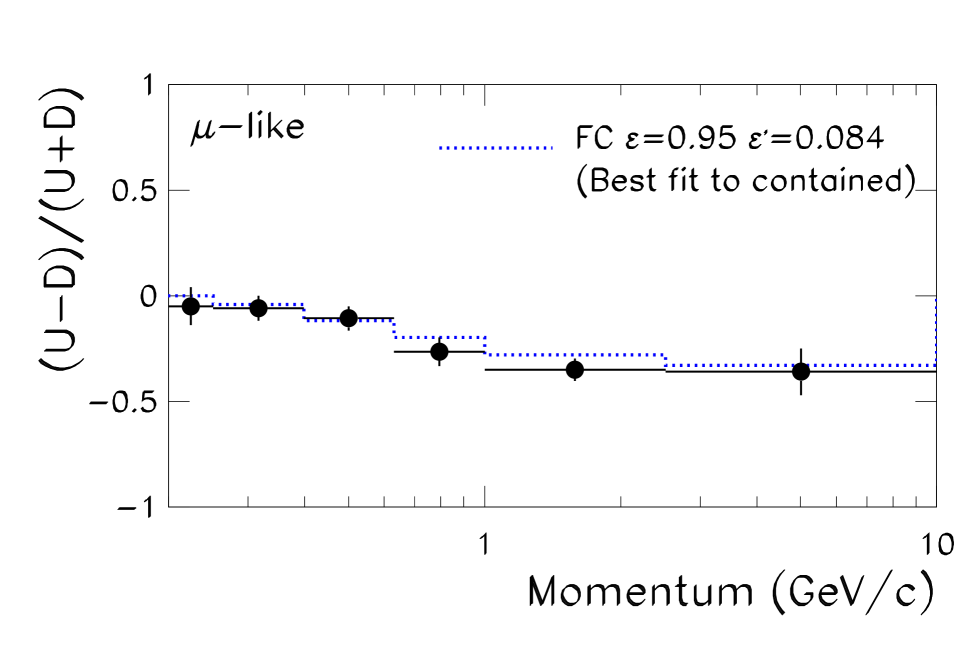
The allowed regions for the contained events are, as expected, similar to the ones obtained in Ref. [20]. The individual best fits now improve with respect to the analysis of the old data: 2.4/(8 d.o.f.) for the sub-GeV data ( and ) and to 6.4/(8 d.o.f.) for the multi-GeV sample ( and ). The combination of the two sets of contained events leads to allowed regions which are analogous to the ones reported in the Ref. [20] and which are not reproduced again here. The best fit point corresponds to and with 9.3/(18 d.o.f.). The goodness of the fit to the contained events in the FC-neutrino interaction scenario can be understood since the suppression of the expected event rates for contained events is the same for sub-GeV and Multi-GeV samples. The Super–Kamiokande collaboration has also measured the energy dependence of the up-down asymmetry for contained events [11] and this clearly indicates a strong energy dependence of the asymmetry for muon-like events in the momentum range GeV GeV. The asymmetry is consistent with zero at low momentum but significantly deviates from the expectation in the SM at higher momenta. One may naively expect that since the FC conversion mechanism is energy-independent it could be in contradiction with this measurement. However, one must notice that the average angle between the directions of the final-state lepton and the incoming neutrino ranges from at 200 MeV to at 1.5 GeV, so that at low momenta the possible asymmetry of the neutrino flux is largely washed out. In Fig. 2 we plot, together with the Super–Kamiokande data, the momentum behaviour of the asymmetry in the FC-neutrino interaction scenario calculated for the best fit point to the contained event sample. As seen in the figure the agreement is excellent.
In Fig. 1, we also show the regions which are allowed by the up-going muons samples of Super-Kamiokande. Panel (c) stands for stopping muons and panel (d) for the through-going sample. In the case of stopping muons, we see that, analogously to the contained events, the allowed region lies in the sector of the plane where the average survival probability is of the order of a half, which is what appears to be needed for explaining the data. Instead, in the case of through-going muons, the experimental data do not show such a strong reduction with respect to the theoretical calculations, and therefore the allowed region lies in the upper-left corner of the parameter space, which refers to a smaller transition probability. In both cases, the best fit point for each individual sample is good: 1/(3 d.o.f.) for stopping muons ( and ) and 10.3/(8 d.o.f.) for the through-going case ( and ). Both for the contained and for the up-going events, the best fits have the same level of statistical confidence as compared to the oscillation interpretation of the atmospheric neutrino data. This is shown in Table I, where we report the best fit values we obtain for the different data sets in the case of the FC– interactions scenario and in the case of the neutrino oscillation scenario[31].
The allowed regions can be qualitatively understood in the approximation of constant matter density. The conversion probability in this case is
| (9) |
where . For and , the oscillation length in matter is given by
| (10) |
From Eq. (9) one can see that in order to have a relatively large transition probability, as required by the contained events and, also, by the stopping muons events, the FC parameters are required to be in the region and . This last condition leads to a lower bound on . The island in Fig. 1.(b) corresponds to .
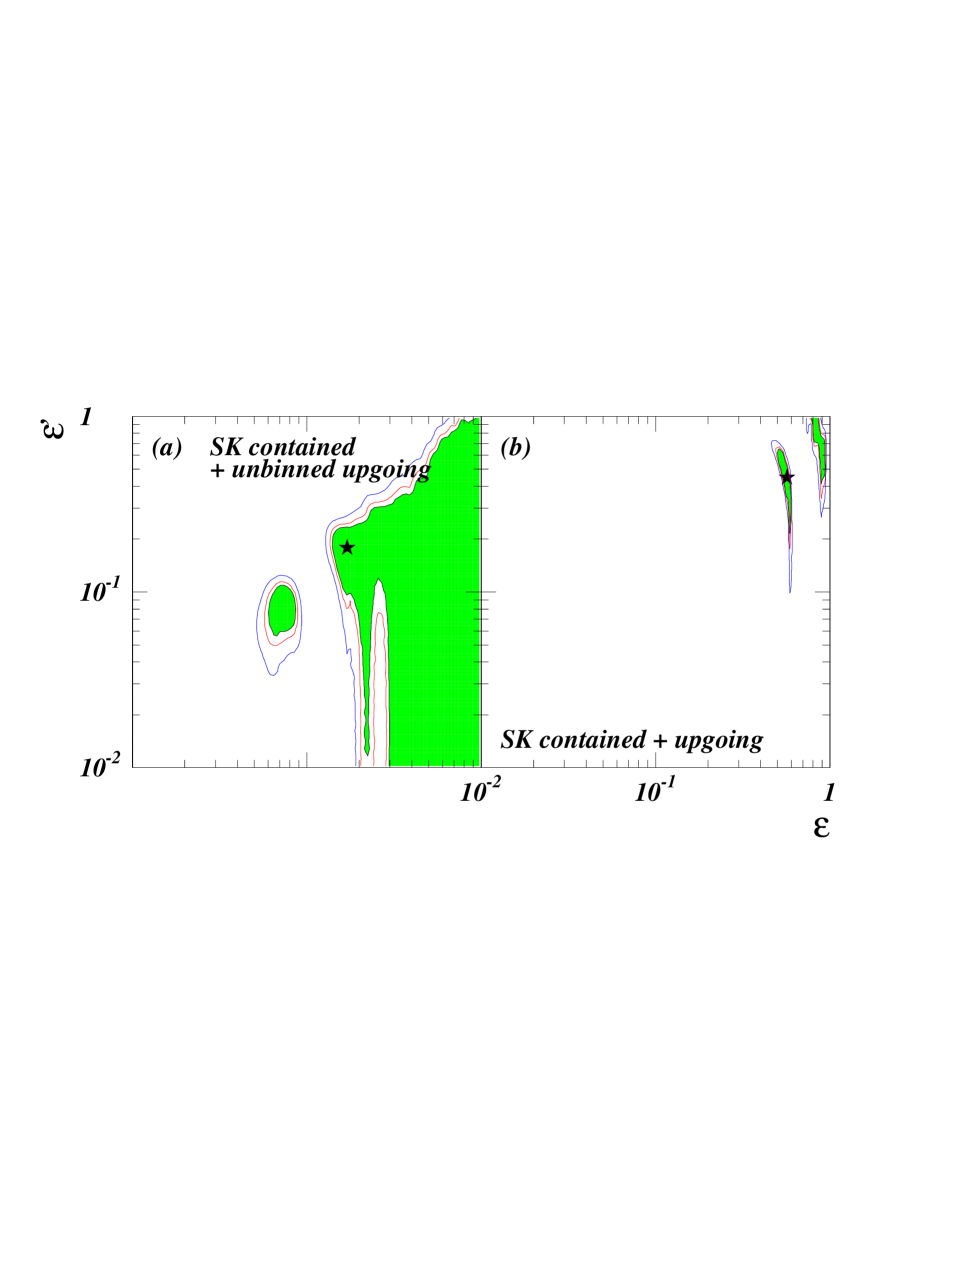
The combination of the different data sets in a single -analysis is shown in Fig. 3. Panel (a) shows the combination of the full angular distribution of contained events with the total (unbinned) event rate of stop and through-going muons data, while panel (b) refers to the combination of all the angular distributions, including that of through-going muon events. In Fig. 3.(a) the information brought by the higher energy data is effective at the normalization level, since no information about their angular dependence is included. In this case the allowed region is still relatively large although the description is already worse than in the oscillation case as can be seen by comparing the corresponding (20.4/(10 d.o.f.) for FC as compared to 9.6/(10 d.o.f.) for the oscillation scenario). This worsening is due to the fact that in the FC scenario the transition probability is energy independent while the data shows a smaller conversion for the higher energy through-going muon events. As seen in Fig. 3.(b), when the angular information of both stopping and through-going muons is included in the data analysis, the description becomes even worse, mainly due to the angular distribution of the through-going data set. The allowed regions now form a set of isolated small ’islands’. The best fit point corresponds to and acceptable at the 90 % CL ( 44/(33 d.o.f.)).
The behavior of the allowed regions can be understood by observing Fig. 4 where we show the angular distributions for the four cases: (a) sub-GeV; (b) multi-GeV; (c) stopping muons; (d) through-going muons. We show the distributions for the best fit point obtained from the combination of contained events with the total number of upward going muons = (0.17,0.28) and for the best fit point obtained from the analysis of the full data set = (0.57,0.45). Although both points give a similar normalization to the up-going muon data samples, point gives a better description to the angular dependence of the contained events, but it does not describe well the zenith angle distribution of the through-going muon events. As commented above, such point correspond to an effective FC-oscillation length of the order of the Earth radius. In this case we can see the imprints of the “oscillatory” sine behavior in the expected angular distribution of the up-going muon events. Such behavior, however, does not appear to be present in the Super-Kamiokande data, leading to a worse overall fit. In the case of multi-GeV contained events, this oscillatory behavior is averaged out due to the smaller angular resolution in the data and point can give a good description of the data. On the other hand, point gives a worse description of the contained events but fits better the shape of upward going muon data, with the exception of the last three angular bins of the through–going sample, where it does not produce a sufficient amount of through-going muons at angles below the horizon.
IV Discussion
What can we say about the required strength of the neutrino-matter interaction in order to obtain a good fit of the observed data? From our best fit results we obtain that the atmoshperic neutrino data can be explained if and . In terms of the neutrino–quark couplings introduced in Eq. (8) we see that for masses GeV combinations of couplings and of the order of 1 are needed.
Model independent constraints on the parameters can be extracted from their contribution to the neutral current cross section measured at low energy [32]. These limits are stronger for interactions with quarks due to the better precision of the data as compared to the . We have estimated that these data constrain –, depending on the fermion coupled to the neutrino. No limit on the parameter can be obtained from these measurements. From this, we see that the FC mechanism is somewhat disfavoured, although not strictly ruled out. Additional limits can be obtained from the non-observation of lepton flavour violation in decays. Indeed, if symmetry is assumed [34] these limits are rather stringent. However, they strongly depend on the amount of violation present in the model. For the purpose of illustrating this explicitly, let us consider a supersymmetric model with broken -parity as a way to parameterize the FC neutrino-matter interaction [33]. In this case the FC -matter interactions are mediated by a scalar down-type quarks, , so that we need only to check the couplings where a -quark and a - or -neutrino is involved,i.e , . The are the coupling constants in the broken -parity superpotential , where , and are standard superfields, and . The most stringent limit to the values of the relevant FC quantities comes from limits on the FC tau decay BR( which implies that GeV. This constraint can be satisfied by cancellation between the contributions from the up-squarks exchange of the third and second generation, although a certain degree of fine-tuning is needed between their masses and couplings. Notice that the may still be large as long as the cancellation does not occur for the down-quarks. This can be achieved by a small splitting between the up and down-squark masses without conflicting with the limits from .
V Conclusions
In summary, in this paper we have re-analyzed the possibility of explaining the atmospheric neutrino anomaly by means of conversion induced by flavour–changing neutrino–matter interaction which can be effective during the neutrino propagation in the Earth. We extend the analysis of Ref. [20] to the new set of Super-Kamiokande data by including also the up-going muon samples. Our results show that that flavour changing -matter interactions are able to describe the full set of data of Super-Kamiokande on atmospheric neutrinos at the 90 % CL. The agreement between the data and the calculated events for the Super-Kamiokande detector is notably good for the individual sets of data collected by Super-Kamiokande, with a confidence level as good as for the oscillation hypothesis. When the data are combined together, in particular once the upward–going muon zenith–angle distribution is included in the analysis, the oscillation provides a much better description. However, the FC mechanism is compatible with the data at the quoted 90% level of statistical confidence. The worsening of the fit which occurs when the through–going muons sample is included is partly due to the fact that in the FC scenario the transition probability is energy independent while the data shows a smaller conversion for the higher energy up-through-going muon events. The ensuing result is that the expectations from FC-neutrino interaction for neutrinos arriving mainly at angles above 20 degrees below the horizon do not reproduce the experimental data.
The amount of FC neutrino interactions required by our combined analysis in order to fit the data is somewhat large, either close to maximal or at the level of about (10-50)%. Although significant, FC at this level in the neutrino sector can be accomodated in speficic models without conflicting with existing experimental limits. These realizations of large neutrino FC may require some degree of fine tuning, like for instance in broken R-parity supersymmetric models, but are theoretically viable.
The above FC mechanism can be also tested at future Long Baseline experiments. From Eq. (9), using mol/cc, we can predict that for (0.1) the planned K2K experiment [35] should obtain (0.004) while for MINOS [36] one finds (0.04).
In conclusion, we have to comment that although FC interactions would be eventually ruled out as the only source of the modification of the atmospheric neutrino predictions with respect to those of the Standard Model they could still be there at some level, even if the data would admit a very good interpretation in terms of standard oscillations. This is theoretically not an ad hoc assumption, since in many theoretical models neutrino masses naturally co-exist with FC-neutrino interactions.
On the other hand, one may turn the argument the other way around: should the atmospheric neutrino anomaly be explained in terms of neutrino oscillations, then it will be possible to use the non-observation of an additional effect in the atmospheric neutrino data in order to impose new model independent limits on the strength of the and parameters, as can be foreseen by looking at Fig. 1(d).
Acknowledgements.
We thank R. Vazquez for providing us with the program to compute the muon energy loss. We are also grateful to S. Nussinov for pointing us out the limits from the neutrino neutral current measurements. M.C. G-G is grateful to the Instituto de Fisica Teorica from UNESP and to the CERN Theory division for their kind hospitality during her visits. This work was supported by Spanish DGICYT under grant PB95-1077 and by the European Union TMR network ERBFMRXCT960090.REFERENCES
- [1] L. V. Volkova, Sov. J. Nucl. Phys. 31, 784 (1980); M. Honda et al., Phys. Rev. D52, 4985 (1995); V. Agrawal et al., ibid D53, 1314 (1996); T. K. Gaisser and T. Stanev, ibid D57, 1977 (1998).
- [2] K. Daum et al. Z. Phys. C66, 417 (1995).
- [3] M. Aglietta et al., Europhys. Lett. 8, 611 (1989).
- [4] H. S. Hirata et al., Phys. Lett. B280, 146 (1992); Y. Fukuda et al., ibid B335, 237 (1994).
- [5] R. Becker-Szendy et al., Phys. Rev. D46, 3720 (1992).
- [6] Y. Fukuda et al., Phys. Lett. B433, 9 (1998); Phys. Lett. B436, 33 (1998).
- [7] M. Nakahata, Talk at the Sixth International Workshop on Topics in Astroparticle and Underground Physics, TAUP99, Paris, September 1999.
- [8] W. W. M. Allison et al., Phys. Lett. B449, 137 (1999).
- [9] M. C. Gonzalez-Garcia, H. Nunokawa, O. L. G. Peres, T. Stanev and J. W. F. Valle, Phys. Rev. D58, 033004 (1998); M.C. Gonzalez-Garcia, H. Nunokawa, O.L. Peres and J. W. F. Valle, Nucl. Phys. B543, 3 (1999). For an updated analysis including upward going muons see also M. C. Gonzalez-Garcia, hep-ph/9910494.
- [10] R. Foot, R. R. Volkas and O. Yasuda, Phys. Rev. D58, 013006 (1998); O. Yasuda, Phys. Rev. D58, 091301 (1998); G. L. Fogli, E. Lisi, A. Marrone, G. Scioscia, Phys. Rev. D59, 033001 (1999), hep-ph/9808205; E.Kh. Akhmedov, A.Dighe, P. Lipari and A.Yu. Smirnov, Nucl. Phys. B542,3 (1999), hep-ph/9808270.
- [11] Y. Fukuda et al., Phys. Rev. Lett. 81, 1562 (1998); See also the talk by K. Scholberg, hep-ex/9905016.
- [12] V. Barger, J.G. Learned, S. Pakvasa, and T.J. Weiler, Phys. Rev. Lett. 82, 2640 (1999).
- [13] M. Gasperini, Phys. Rev. D38, 2635 (1988); J. Pantaleone, A. Halprin, C.N. Leung, Phys. Rev. D47, 4199 (1993); A. Halprin, C.N. Leung, J. Pantaleone Phys. Rev. D53, 5365 (1996).
- [14] S. Coleman, S. L. Glashow, Phys. Lett. B405, 249 (1997); S. L. Glashow, A. Halprin, P.I. Krastev , C.N. Leung, J. Pantaleone, Phys. Rev. D56, 2433 (1997).
- [15] S. Coleman, S. L. Glashow, Phys. Rev. D59, 116008 (1999).
- [16] Y. Fukuda et al., Phys. Rev. Lett. 82, 2644 (1999).
- [17] P. Lipari, M. Lusignoli Phys. Rev. D60, 013003 (1999).
- [18] G.L. Fogli, E. Lisi, A. Marrone, G. Scioscia, hep-ph/9904248.
- [19] G.L. Fogli, E. Lisi, A. Marrone, G. Scioscia, Phys. Rev. D59, 117303 (1999).
- [20] M.C. Gonzalez-Garcia, M.M. Guzzo, P.I. Krastev, H. Nunokawa, O.L.G. Peres, V. Pleitez, J.W.F. Valle and R. Zukanovich Funchal, Phys. Rev. Lett. 82, 3202 (1999).
- [21] L. Wolfenstein, Phys. Rev. D17, 2369; J. W. F. Valle, Phys. Lett. B199, 432 (1987); M. Fukugita, T. Yanagida, Phys. Lett. B206, 93 (1988); M. M. Guzzo, A. Masiero and S. Petcov, Phys. Lett. B260, 154 (1991); E. Roulet, Phys. Rev. D44, 935 (1991); V. Barger, R. J. N. Phillips and K. Whisnant, Phys. Rev. D44, 1629 (1991); P. I. Krastev and J. N. Bahcall, hep-ph/9703267; S. Bergmann, Nucl. Phys. B515, 363 (1998); E. Ma and P. Roy, Phys. Rev. Lett. 80, 4637 (1998).
- [22] J. Schechter and J. W. F. Valle, Phys. Rev. D22, 2227 (1980).
- [23] R. Mohapatra, J. W. F. Valle, Phys. Rev. D34, 1642 (1986); D. Wyler and L. Wolfenstein, Nucl. Phys. B218, 205 (1983).
- [24] L. J. Hall, V. A. Kostelecky and S. Raby, Nucl. Phys. B267 415 (1986); Y. Okada, hep-ph/9809297.
- [25] A. M. Dziewonski and D. L. Anderson, Phys. Earth and Planet. Interiors, 25, 207 (1981).
- [26] J. Bahcall and P. Krastev, Phys. Rev. C56, 2839 (1997).
- [27] W. Lohmann, R. Kopp and R. Voss, CERN Yellow Report EP/85-03.
- [28] E. Zas, F. Halzen, R.A. Vazquez, Astropart. Phys. 1 297 (1993).
- [29] P. Lipari, M. Lusignoli Phys. Rev. D58, 073005 (1998).
- [30] G. Fogli and E. Lisi, Phys. Rev. D52, 2775 (1995); G. Fogli, E. Lisi, D. Montanino and G. Scioscia, ibid D55, 485 (1997); G.L. Fogli, E. Lisi, A. Marrone, G. Scioscia, Phys. Rev. D59, 033001 (1999).
- [31] N. Fornengo, M.C. Gonzalez-Garcia and J.W.F. Valle, in preparation.
- [32] C. Caso et al, The European Physical Journal C3 (1998) 1.
- [33] L.J. Hall and M. Suzuki, Nucl. Phys. B231 (1984) 419; G.G. Ross and J.W. Valle, Phys. Lett. 151B (1985) 375; J. Ellis, G. Gelmini, C. Jarlskog, G.G. Ross and J.W. Valle, Phys. Lett. 150B (1985) 142
- [34] S. Bergmann, Y. Grossman, D. M. Pierce, hep-ph/9909390.
- [35] C. Yanagisawa et al., in Physics Beyond the Standard Model: from Theory to Experiment, World Scientific, 1998 (ISBN-981-02-3638-7) Eds. I. Antoniadis, L. E. Ibanez and J. W. F. Valle.
- [36] D. Michael et al., Nucl Phys. B, Proc. Suppl. 66, 432 (1998).
| Data | d.o.f | ||
|---|---|---|---|
| sub-GeV | 8 | 2.4 | 2.4 |
| multi-GeV | 8 | 6.4 | 6.3 |
| contained | 18 | 9.3 | 8.8 |
| stopping- | 3 | 1. | 1.3 |
| through-going- | 8 | 10.3 | 10.4 |
| contained + total up- | 10 | 20.4 | 9.6 |
| contained + angular up- | 33 | 44. | 23.5 |