CERN-TH/99-14
Universal Pion Freeze-out Phase-Space Density
D. Ferenca,b, U. Heinza,c, B. Tomášika, U.A. Wiedemanna,d
aInstitut für Theoretische Physik, Universität Regensburg,
D-93040 Regensburg, Germany
bPhysics Department, University of California, Davis, CA 95616-8677,USA
cTheory Division, CERN, CH-1211 Geneva 23, Switzerland
dPhysics Department, Columbia University, New York, NY 10027, USA
and J.G. Cramer
Nuclear Physics Laboratory, University of Washington, Seattle, WA 98195, USA
Abstract: Results on the pion phase-space density at freeze-out in sulphur-nucleus, Pb-Pb and -p collisions at the CERN SPS are presented. All heavy-ion reactions are consistent with the thermal Bose-Einstein distribution at 120 MeV, modified for radial expansion. -p data are also consistent with , but at 180 MeV and without radial flow.
Introduction. In ultrarelativistic heavy-ion collisions, the pion freeze-out phase-space density determines the importance of multiparticle pion correlations and of dileption production from annihilation. G. Bertsch [1] suggested a way of estimating this quantity by combining measurements of one-particle momentum spectra with two-particle correlations, thereby testing the thermal equilibrium of the pion source created in the collision. In local thermal equilibrium at temperature the pion energy distribution is given by the Bose-Einstein function
| (1) |
where is the 4-velocity of the local rest frame at point in the observer frame. The coordinate space average of this function is the quantity to be measured:
| (2) |
Here is the normal vector on a space-like space-time hypersurface . According to Liouville’s theorem, is arbitrary as long as its time arguments are later than the time at which the last pion passing the surface at point was produced.
If the measured single-particle -spectrum is parameterized by an exponential with inverse slope parameter ,
| (3) |
and the two-particle correlation function by a Gaussian [2],
| (4) |
where the subscripts refer to the usual out-side-long coordinate system and accounts for unresolvable contributions from long-lived resonances [3], one obtains for the spatially averaged phase-space density at freeze-out [4, 5]
| (5) |
Here , with . The numerator (with experimental input ) gives the momentum-space density at freeze-out while the denominator (involving the measured two-pion Bose-Einstein correlation radii ) reflects the space-time structure of the source at freeze-out and can be interpreted as its covariant homogeneity volume for particles of momentum . The factor ensures [4] that only the contributions of pions from the decays of short-lived resonances, which happen close to the primary production points, are included in the average phase-space density.
We have calculated for the S-S, S-Cu, S-Ag, S-Au, S-Pb and Pb-Pb data from the experiments NA35 [6], NA49 [7, 8], and NA44 [9], and for the -p data from the NA22 experiment [10] (all at the CERN SPS). The projectile energies were 200 GeV per nucleon in S-nucleus collisions, 158 GeV per nucleon in Pb-Pb collisions and 250 GeV in -p collisions, which correspond to projectile rapidities 6, 5.8 and 8.2, respectively. Our results will also be compared with the average phase-space density in Au-Au collisions at projectile momentum 10.8 GeV/c, published by the E877 collaboration at the AGS [4]. In all cases the analysis was done in the LCMS (longitudinally comoving system) where the longitudinal momentum of the pion pair vanishes.
Calculation of the phase-space density. The experimental input into Eq. (5) is partly incomplete. This concerns particularly the intercept parameter which was measured in all the considered experiments but not always published in the final corrected form. However, the necessary information is still available, and in the following we explain how we used it. The following experimental effects are responsible for the uncertainties in the measurement of the parameter:
-
(i)
Finite momentum resolution reduces the correlation intercept, since it leads to a smearing or widening of the correlation peak.
- (ii)
-
(iii)
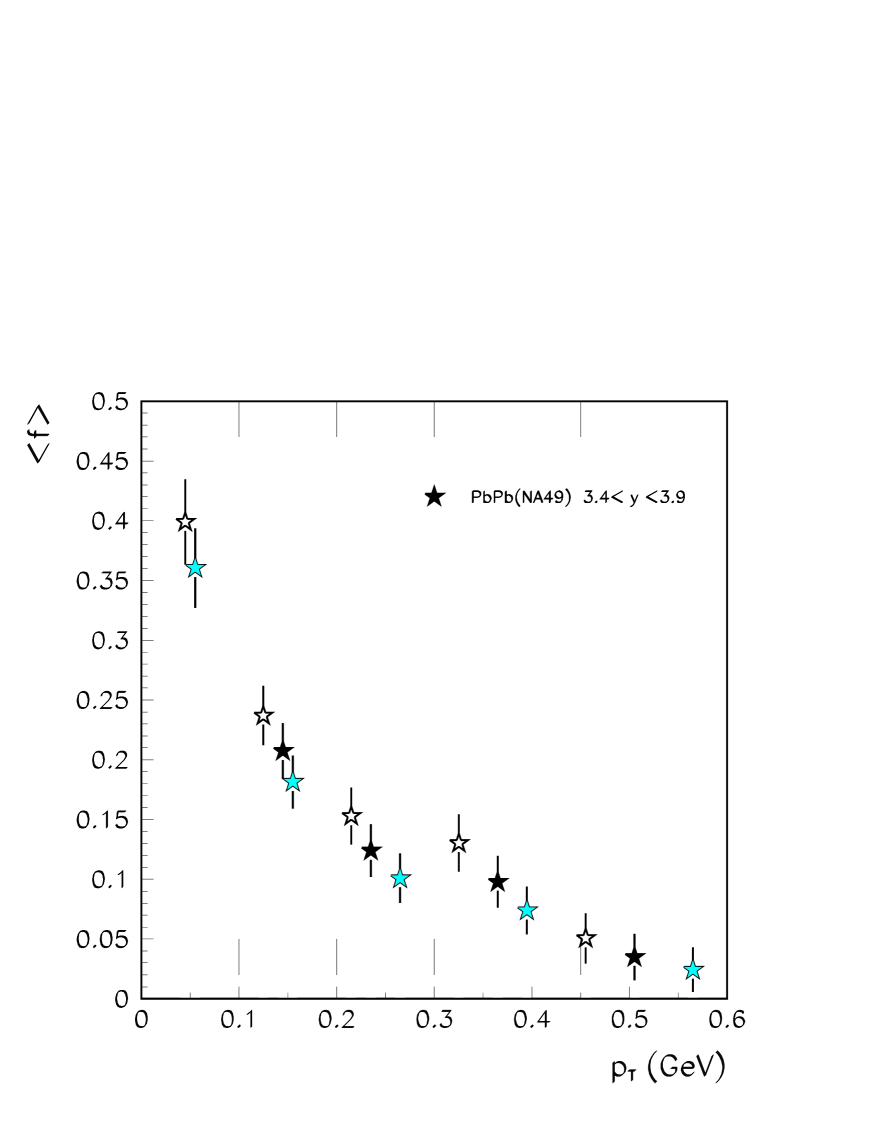
If pions are not positively identified, as is the case in NA35 and NA49, the direct-pion sample is contaminated with kaons, converted electrons, protons and other particles. NA35 and NA49 have performed a contamination correction based on detailed Monte Carlo simulations [6], but unfortunately the resulting corrected results for have not been directly published. However, since the contamination levels were published, as well as the uncorrected results for , we were able to estimate the corrected values ourselves. For example, in the NA49 Pb-Pb collisions, in the rapidity interval 3.43.9, the fraction of pure pairs is % [7], and the uncorrected measured is between 0.4 and 0.5 [7]. The contamination-corrected value is then 0.73-0.91.
-
(iv)
Pions originating from weak decays also contaminate the direct pion sample when the decay takes place unresolvably close to the main interaction point. In the rejection of decayed pions, the experiments NA35 and NA49, with continuous tracking detectors covering the region close to the target, are in an advantage over the NA44 spectrometer with tracking devices placed only far away from the target. Since there are more hyperons (, , ) than antihyperons in the fireball which produce more negative than positive pions, the measurement of with positive pions is less affected and should be more reliable. Note that NA44 indeed reported [9] significantly different results: and , the difference being mostly reproduced in a detector simulation with the RQMD event generator, and thereby traced to the weak decay asymmetry.
NA44 and NA49 both reported an approximate independence of on , valid to about 10%. Regarding the absolute values, for S-Pb data NA44 has reported (with negligible non-pion contamination), consistent with the lower half of the NA35 interval, (contamination corrected). The latter may be read out directly from the correlation functions presented in Fig. 2 of Ref. [6]. That figure also provides an insight into the reliability of the measurement, since it presents the evolution of the correlation function through different correction steps.
In case of Pb-Pb collisions the NA44 results are again consistent with the lower end of the NA49 interval, see Fig. 1: (NA49)0.7-0.9, obtained with “our” correction for contamination, and (NA44)0.66-0.69, without a correction for the contamination due to weak decays. Since positive pions are also contaminated by weak decay products, the NA44 result is certainly an underestimate, unlike the NA49 result which has been corrected for all sources of contamination, including those weak decays which could not be filtered out by vertex cuts.
If only the contamination by weak decay products were to explain the difference between (NA44) and (NA44), as suggested by NA44 [9], then the contamination effect itself on (NA44) should be quite strong, probably on the order of 10%. After shifting the NA44 results up by this ad hoc 10% correction, as shown in Fig. 1 by full lines, the NA44 and NA35/NA49 intervals already fully overlap.
In comparing S-nucleus and Pb-Pb results one has to take into account also a difference in the Coulomb correction methods. Sophisticated Coulomb correction methods lead to higher measurements than the “old” Gamov correction. This effect seems to be around 5-15% for Pb-Pb data [8, 9], and should be lower for S-nucleus data [12, 11], probably 0-10%, depending on the way the normalization has been done [6, 11, 12]. Note that the Pb-Pb data have been Coulomb-corrected in the appropriate way, while the S-nucleus data were only Gamov corrected, which might be the reason for the discrepancy seen in Fig. 1. Assuming that the S-nucleus data indeed need to be corrected by 10% to account for the systematical error due to the inappropriate Gamov correction, one arrives at the results presented by dotted lines in Fig. 1 which are in much better agreement with the Pb-Pb results. Our assumption is, however, rather doubtful and should serve as an illustration of the systematic uncertainties rather than as a quantitative result. Note that also the correlation radii should in principle increase due to a proper Coulomb correction, which would partly cancel or even reverse the effect of an increased , see Eq. (5).
It is beyond our ability to check all these points in further detail, since this would require detailed Monte Carlo simulations of the detector response, with a realistic event generator as input. It is quite obvious that with the quality of the presently available data an accurate determination of the factor to be used in Eq. (5) is not possible. We have therefore proceeded in a rather pragmatic way, taking the most probable interval for for all the data sets from Fig. 1, based on a consideration of the corrected data presented by full (and to some extent also dotted) lines in Fig. 1. The most likely value for all these data sets seems to be = 0.7, with a relatively wide error 0.1. This value has been used in our analysis.
Fortunately, enters Eq. (5) under a square root, and a systematical error of e.g. 15% for will result in only 7% error of the final result, which raises the confidence into our simplistic approach.
In the introduction we stated already that we shall use an exponential function, Eq. (3), to parametrize the -spectrum. One of the reasons for our choice was the general accessibility of for all the data sets; equals , a quantity which is usually quoted together with the data. The best method would be to use directly the measured , but most of the data have not been published in a useful form. The pion rapidity density was derived from the NA35 and NA49 measurements of the negative hadron rapidity density , by a simple scaling with a factor 0.9 [13].
One should also specify the value representative for a given -interval, both in order to calculate and to allow for a meaningful model comparison, i.e. to properly place the calculated points in the plot . Fortunately, the result is almost insensitive to systematical errors in the choice of the representative value. To estimate the effect of this error we have shifted each measured point by 10% up and down in from the average for the interval, as shown in Fig. 2. The resulting smearing is elongated along the actual shape of the entire distribution. The systematical error in the choice of the value representative for a given interval is therefore essentially harmless.
With the S-nucleus collision data from NA35 and NA44 and with the -p collision data from NA22 we had yet another problem: the two-pion correlation functions of these data have not been fitted with the proper functional form which includes the out-longitudinal cross term [2]. For those data the resulting volume term in the denominator of Eq. (5) reduces to . To estimate the systematic error arising from the omission of the cross term we considered the ratio of the expressions for with and without the cross term:
| (6) |
With the explicit expressions given in [2] and the Cauchy inequality one shows that such that this ratio is always well-defined. It must be 1 at midrapidity since there by symmetry. Larger values of 1.2-1.3 were only found for data far away from mid-rapidity for which the measured cross term was comparable to or . In this publication we have considered data for which no cross term was included in the analysis only near mid-rapidity where is small. We estimate that that this procedure limits the (downward) systematic error on due to this effect to less than 5%.
Results. In Figures 3-6 we show the average phase-space density as a function of , for different systems and rapidity bins, as extracted from Eq. (5). The error bars reflect the statistical errors of the single-particle spectra and correlation radii, but not the systematic uncertainties discussed above (including the dominant uncertainty in the intercept ). We also plot for comparison the Bose-Einstein distribution (1) for a static system () and different temperatures . In doing so we set which is justified if the longitudinal pair momentum can be neglected. Since the correlation data which we used were analyzed in the so-called “fixed longitudinal co-moving system” (FLCMS) in which the pair rapidity corresponding to the center of the rapidity bin vanishes, this approximation holds as long as the considered rapidity interval is narrow. Rapidity intervals of 0.5 (as in the NA49 Pb-Pb data) and 1 (as for the NA35 S-nucleus data) result in a systematic overestimate of the theoretical distribution function by approximately 2% and 7%, respectively.
-
(i)
Universal average phase-space density at freeze-out:
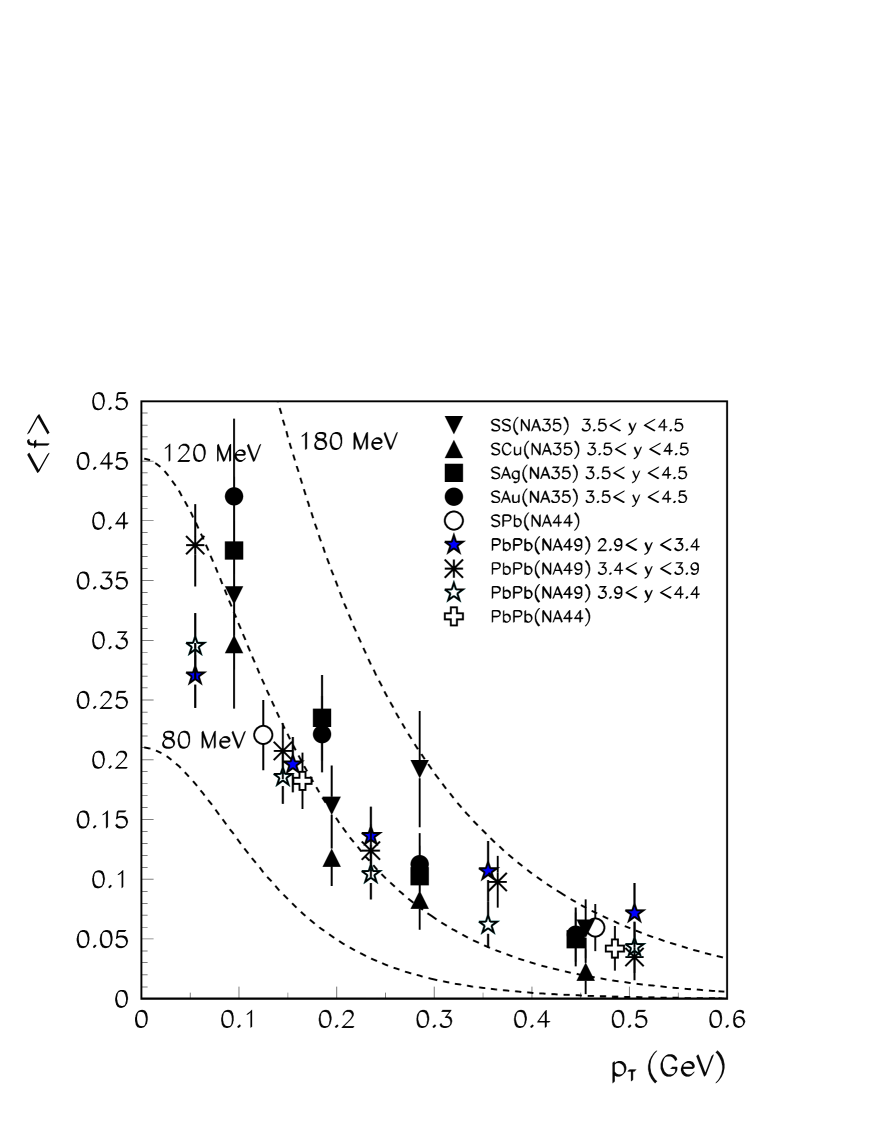
Even though the heavy-ion data span about an order of magnitude in multiplicity density ((S-S)=22, (S-Cu)=24, (S-Ag)=28, (S-Au)=37, and (Pb-Pb)=40-185, depending on rapidity), the resulting average phase-space densities vary by much less. Given the large error bars, all the nuclear collision data at mid-rapidity from the SPS experiments in Figs. 3,4 are almost indistinguishable. Freeze-out happens in all cases at comparable values of the average phase-space density. -
(ii)
Rough agreement with the Bose-Einstein distribution:
The dashed lines in Fig. 3 indicate thermal Bose-Einstein distributions for static sources at various freeze-out temperatures. A rough comparison with the SPS heavy-ion data indicates consistency with temperatures in the range of 100-140 MeV. Thermal freeze-out temperatures in this domain were recently obtained in analyses of the measured spectra and correlation functions [8, 14, 15, 16]. -
(iii)
Multiparticle symmetrization effects are small:
Irrespective of the collision system and , we find phase-space densities smaller than 0.5. For the Bose-Einstein phase-space enhancement is dominated by two-particle symmetrization effects, and multiparticle symmetrization effects are weak [5]. This is an important consistency check for the current practice of calculating the two-particle correlation function from the two-particle symmetrized contributions only. For the system is far away from a pion laser. We find no sign for a striking pion excess or a pion condensate. -
(iv)
Radial flow:
Looking in more detail, in particular applying a logarithmic scale as in Fig. 4, one finds that the data indicate a somewhat slower decrease with increasing than the Bose-Einstein curve. Particularly strong differences are seen for the NA49 Pb-Pb data at mid-rapidity (). These data can be fitted with the function (/ndf=0.2), presented in Fig. 4 by a dotted line, which has a considerably flatter slope than the Bose-Einstein distribution. This behaviour can be reproduced by a model for the emission function which includes radial collective expansion and whose parameters are adjusted to reproduce the single- and two-particle spectra [16]. The (strong) radial expansion adds extra transverse momentum to the particles (Doppler blue shift), i.e. the local values appear in the lab frame at a higher than in the rest frame of the effective source. A detailed study will be published elsewhere [16]. -
(v)
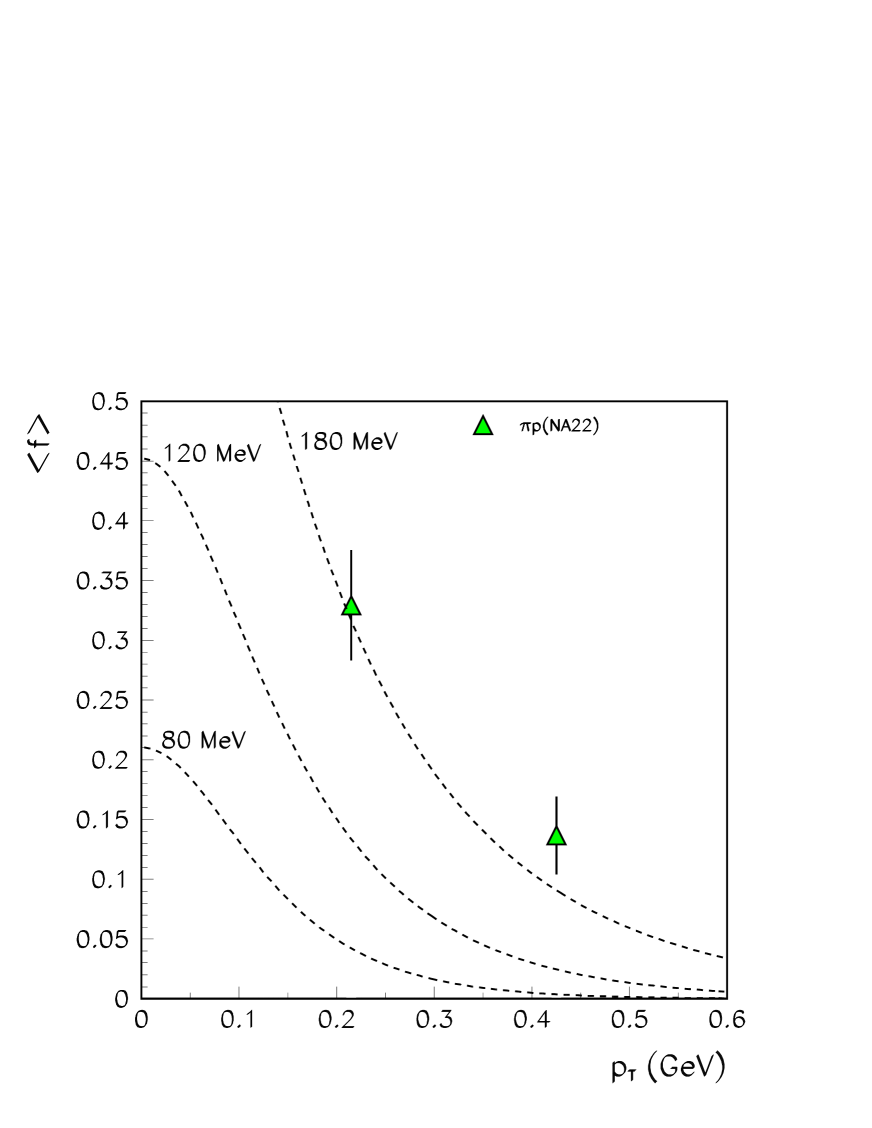
Decoupling at high temperature in -p collisions:
In contrast to freeze-out in nuclear collisions which takes place in two steps (chemical freeze-out of particle abundances at around MeV [17], thermal freeze-out of momentum spectra at around MeV [8]), pion production in -p collisions [10] is essentially immediate, without the second evolution stage, and therefore common chemical and thermal freeze-out temperatures of around 170-180 MeV should be expected. The data on are indeed consistent with this expectation, as seen in Fig. 5. -
(vi)
Rapidity dependence:
A certain departure from the universal scaling is seen for the data at rapidities close to the projectile rapidity, see Fig. 6, both at AGS and SPS; but again the results at these two widely different beam energies are mutually consistent and agree with the expectations from a thermalized expanding source. The sources at AGS and SPS energies show strong longitudinal expansion at freeze-out, but with maximal longitudinal flow rapidities well below the beam rapidity ( at the SPS and at the AGS [18, 19]). Pions with CMS rapidities larger than thus come from the tail of the thermal longitudinal momentum distribution [4]. A similar decrease of which is seen near midrapidity as a function of is thus seen near beam rapidities as a function of .
Acknowledgement: This work was initiated during the Heavy Ion Workshop at the Institute for Nuclear Theory (Seattle) in March 1998, and U.H. would like to thank the INT for its hospitality. We also acknowledge support by DAAD, DFG, GSI, BMBF, and the US Department of Energy.
References
- [1] G.F. Bertsch, Phys. Rev. Lett. 72 (1994) 2349; 77 (1996) 789(E).
- [2] S. Chapman, P. Scotto, U. Heinz, Phys. Rev. Lett. 74 (1995) 4400.
- [3] B.R. Schlei, U. Ornik, M. Plümer, and R.M. Weiner, Phys. Lett. B 293 (1992) 275; U.A. Wiedemann and U. Heinz, Phys. Rev. C 56 (1997) 3265.
- [4] J. Barrette et al., Phys. Rev. Lett. 78 (1997) 2961.
- [5] U.A. Wiedemann and U. Heinz, nucl-th/9901094, Phys. Rep. (1999), in press, and references therein.
- [6] T. Alber et al., Z. Phys. C 66 (1995) 77; Phys. Rev. Lett. 74 (1995) 1303.
- [7] H. Appelshäuser et al., Eur. Phys. J. C 2 (1998) 661.
- [8] H. Appelshäuser, Ph.D. Thesis, Univ. Frankfurt, 1997, http://na49info.cern.ch/cgi-bin/wwwd-util/NA49/NOTE?150.
- [9] H. Beker et al., Phys. Rev. Lett. 74 (1995) 3340; I.G. Bearden et al., Phys. Rev. C 58 (1998) 1656.
- [10] N.M. Agababyan et al., Z. Phys. C 71 (1996) 405.
- [11] D. Ferenc et al., Symposium on Quantum Correlations in High Energy Nuclear Collisions, Hiroshima, Japan, 10-14 April 1995, Nuclear Physics Research 40 (1996) 59.
- [12] T. Alber et al., Z. Phys. C 73 (1997) 443.
- [13] F. Becattini and M. Gaździcki, Nucl. Phys. B (Proc. Suppl.) 71 (1999) 324.
- [14] S. Chapman, J.R. Nix, Phys. Rev. C 54 (1996) 1396; J.R. Nix, Phys. Rev. C 58 (1998) 2303.
- [15] Proceedings of Quark Matter ’97, Nucl. Phys. A638 (1998), in particular presentations by S. Pratt, E. Shuryak, and U. Wiedemann.
- [16] B. Tomášik, PhD thesis, Univ. Regensburg, 1999; B. Tomášik, U.A. Wiedemann and U. Heinz, in preparation.
- [17] F. Becattini and U. Heinz, Z. Phys. C 76 (1997) 269; J. Phys. G 23 (1997) 1933.
- [18] E. Schnedermann, J. Sollfrank, and U. Heinz, Phys. Rev. C 48 (1993) 2462.
- [19] J. Stachel, Nucl. Phys. A610 (1996) 509c.