Long baseline neutrino oscillation disappearance search
using a beam from muon decays
Abstract
We study the feasibility of performing a disappearance long-baseline experiment using a neutrino beam coming from muon decays. The advantage of such a technique with respect to the production of neutrino beams from pions is that in a muon decay both muon and electron neutrinos are produced in the same quantity. In case of oscillations, the charged current (CC) events can be used as a control sample, to predict in situ the rates, thus reducing the systematics due to the knowledge of the neutrino flux, which is the main source of uncertainties for disappearance experiments. We consider as our neutrino target, the ICARUS detector in its final mass configuration of 4.8 kton.
1 Introduction
The most satisfactory explanation of the observed disappearance of atmospheric muon neutrinos result, strongly confirmed by the latest observations of the Super-Kamiokande[1] and SoudanII [2] collaborations, is (or ) oscillations.
The importance of this result requires however confirmation in a different environment, i.e. using neutrinos produced from accelerators.
Several proposals have been made to test the oscillations using a long baseline experiment, in Europe [3, 4, 5, 6, 7], in Japan [8], and in the US [9]. The first long-baseline experiment, K2K, will start data taking in January 1999. This experiment, based on a flux of muon neutrinos from the KEK laboratory to the Kamioka mine, is expected to test disappearance reaching the region down to at 90% C.L. after three years of running.
Two of the proposed experiments for the CERN-LNGS long-baseline project (ICARUS[3] and OPERA [5]) will be able to observe the appearance of the in oscillation, and will ultimately reach the sensitivity of about at 90% C.L. [10].
While the region for oscillations suggested by the SuperKamiokande result is quite precise in the determination of the mixing angle consistent with maximal mixing, the uncertainty in indicated by the SuperKamiokande zenith angle distribution is quite large, and does not exclude the possibility of this parameter to be as small as . For this reason it is important to envisage an accelerator-based experiment able to cover the full parameter space.
The probability for neutrino oscillations between two families is given by
| (1) |
where is the mixing angle between the two neutrino flavours, and (in ) is the difference of the squares of the neutrino masses. In the region with full mixing and small probability, it can be approximated as
| (2) |
Thus, using a baseline of 732 km and neutrino energies of a few GeV, in the region suggested by the atmospheric neutrinos the oscillation probability is of the order of a few per cent.
The ultimate sensitivity at low in the disappearance mode will be limited by the knowledge of the neutrino flux. In fact, since the oscillation probability shows a dependence, the oscillated events are all concentrated in the low-energy region, where it is very difficult to observe any shape distorsion due to the oscillation. So, the only visible effect is a deficit in the total number of neutrinos observed. The integrated oscillation probability in this case is
| (3) |
showing a quadratic dependence on .
In long-baseline experiments performed using a pion beam, the problem of the flux uncertainty has been addressed by the use of a near detector, this solution having the disadvantage that the solid angle covered by the two detectors is not the same, thus requiring a non-trivial extrapolation from the near to the far flux[11] [12].
In the last few years there has been growing interest in studying the technical feasibility and the impact on physics of a muon collider with high intensity beams[13]. Muons decaying in this machine are a continuous source of both muon and electron-like neutrinos [14] via the following relation222In this paper we always refer to the decay of negative muons. The same considerations are obviously valid in the case of positive muons.:
| (4) |
Between production and detection, neutrinos oscillate with a certain probability. Let us consider three possible cases of mixing between two neutrino flavours:
-
1.
Pure oscillations: in this case there will be disappearance of neutrinos, with oscillation probability P, given by equation 1. If we define as the initial flux, the oscillated flux will be:
(5) The produced by the oscillation will have a flux
(6) but will not be seen in the detector because of the kinematical suppression resulting from the mass. The component of the beam remains the same, since in this case neutrino electrons do not oscillate. The beam, however, provides a way to predict at the far detector the initial flux. In the muon rest frame, the distribution of muon neutrinos and electron antineutrinos is precisely predicted by the V-A theory:
(7) (8) where , is the average polarization of the muon beam, and is the angle between the momentum vector of the neutrino and the mean angle of the muon polarization. In a muon collider, the beam polarization can be carefully measured via the spectrum of the electrons from muon decay; thus the spectra of the two components of the neutrino beam can be known with good accuracy, and so the ratio of the fluxes reaching the far detector .
-
2.
Pure oscillations: the flux and spectrum are exactly the same as for the case, and also the beam is not affected. It is possible, however, to discriminate between and oscillations, since the ratio of neutral current to charged interactions is different in the two cases.
-
3.
Pure oscillations: in this case, also electron antineutrinos would oscillate into , with the same probability as the oscillation. If we call this probability P (given as above by equation 1), the final flux will be composed of four neutrino types:
(9) (10) (11) (12) The total detected flux in this case would be the same, i.e. equal to the initial flux. The antineutrinos coming from the oscillation would produce leptons of opposite sign with respect to neutrinos from the beam, so a magnetic detector with charge discrimination capability would be able to study in detail this kind of processes, as explained in [15] for a different choice of the oscillation parameters. If no magnetic detector is available, it is possible to use the difference between neutrinos and antineutrinos cross-sections to get some hint for this kind of process. Let us call R the ratio between neutrino and antineutrino cross sections:
(13) The fluxes of and are equal at production, but since the energy spectra are different, the number of neutrinos reaching the far detector is slightly different for the two flavours. We assume this effect to be negligible, and we set (deviations from this behaviour can anyway be computed for a more accurate estimation). Thus, the number of interactions for the different kind neutrino flavours would be (assuming no charge discrimination):
(14) (15) where A is the product of the flux times the neutrino cross section. The ratio between the two flavours is still dependent on P:
(16) where we have assumed , independent of energy. The above equation allows to derive the oscillation probability, with no assumption in the initial neutrino flux. Without charge assignment the interpretation of an observed deficit in terms of disappearance or oscillations is not straightforward, and the ambiguity could be solved considering data from other experiments (as usually done in the interpretation of the SuperKamiokande results) or studying the modification in the distribution due to the the antineutrinos produced in oscillations.
2 Event rates
The muons are produced in the decay chain of hadrons behind an appropriate target and are subsequently captured, cooled, accelerated and stored into a ring where they are let to decay.
The muon yield is determined by several parameters. If a pulsed proton source is assumed, the total number of muons is given by the total proton yield times the average pion yield per proton, times the muon yield per pion, so that the total number of muons accelerated is given by the following relation:
We assume a bunch repetition frequency of 10 Hz, with protons per bunch. Given a standard yearly running of , it corresponds to protons per year.
Based on results from muon collider studies[13], we assume that the yield is about 0.6 pions per proton, half of which can produce useful muons, and 0.25 muons per pion survived cooling and acceleration, thus resulting in about 0.1 muons per proton. Overall, a total muon production above muons per year can be achieved. Let us remark that the requirement on cooling should be less stringent than that for a high luminosity muon collider where overlap between two high density beams is required. We assume that the total muon flux can be improved by a factor 2 with respect to the figures quoted above. By running the experiment during 5 years, a total of muons could be reached.
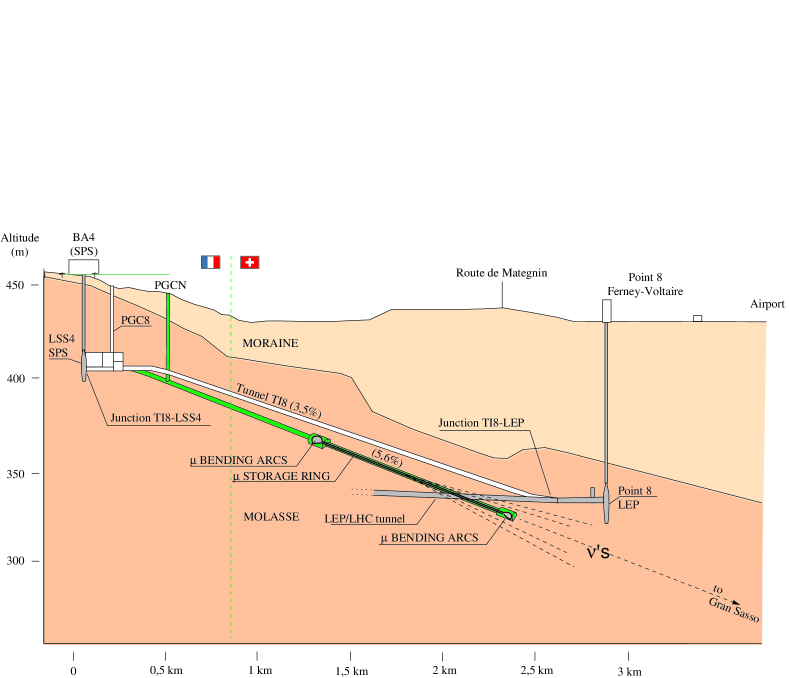
We assume that the storage ring would be placed inside the proposed tunnel for the CERN-Gran Sasso neutrino facility (NGS)[16] (see Figure 1). An optimized geometrical configuration of the storage ring is that of a ”cigare”, in which two long straight sections are closed by two small arcs in which the muons are strongly bent. The radius of curvature (in meters) of a charged particle in a uniform magnetic field is given by
where is the momentum normal to the magnetic field in GeV, and B is the value of the field in Tesla. The straight section would fit in the decay tunnel of the NGS, which is foreseen to have a diameter of about 3 meters and a length of about 1 km. Given this configuration, the losses in the arcs can be neglected, and about 50% of the muon decays are directed towards the target.
Using conventional magnets for the dipoles of the arcs, and assuming a magnetic field of 2 Tesla, the radius of curvature would be about 10 meters, therefore some modification would be needed to the proposed target and hadron stop caverns to accomodate the arcs. If on the other hand superconducting magnets could be used (8 Tesla), the radius of curvature would be around 2.5 meters, and both arcs could fit in the caverns proposed in the NGS project.
In this configuration, half of the neutrinos would be emitted in the backward direction with respect to the Gran Sasso laboratory. Given the slope of the tunnel, they would reach the surface in a site located about 1.5 km from the muon accelerator, between the CERN-Meyrin and CERN-Prevessin laboratories. There, a detector could profit from the extremely intense beam to provide a further cross-check on the neutrino flux. This location would act as a near detector, but in a much more favorable location.
In the other direction, the neutrinos directed towards the Gran Sasso would travel the distance between the two laboratories (732 km), to be detected in one of the large apparatus installed there.
We consider the ICARUS [3] detector as a target, in its final mass configuration of 4.8 ktons. We have there an excellent energy resolution for electrons, and a very good electron-muon separation capability. We purposely ignore the charge measurement, not considering the possibility of studying oscillations using the charge of the lepton as a discriminator.
The total number of and charged current interactions in ICARUS as a function of the muon beam energy is shown in Figure 2 and in Table 1, considering unpolarized muon beams. The energy spectra of the two types of neutrinos for different values of the muon energy are shown in Figure 3. We have assumed for simplicity that the neutrino cross sections scale linearly with energy even in the very low-energy part of the spectrum:
The relevant point is that for the energies considered here the cross section for electron and muon neutrinos are the same.
| Muon energy (GeV) | CC events | CC events |
|---|---|---|
| 2.5 | 560 | 240 |
| 3.5 | 1540 | 660 |
| 4.5 | 3280 | 1410 |
| 5.5 | 6000 | 2570 |
3 Results
We consider the results that could be achieved by the experimental setup described above, without near detector, in the case of pure oscillation.
For the different values of muon beam energy, the oscillation probability as a function of the parameter is shown in Figure 4. In the region of small probabilities, the dependence of this quantity on is quadratic, as seen from equation 2. The probability has also a quadratic dependence on the neutrino energy, so the low-energy muons yield a higher oscillation probability with respect to the high-energy muons. In the region of interest, between and , the oscillation probability is between 1 and 10%, and a similar or better sensitivity is needed for observing the oscillation signal.
If the energy shape of the oscillated events is not considered, and only a counting experiment is performed, as is the case for the small- region, the statistical error is just given by the total number of muon neutrinos observed:
The total error on the oscillation probability has to account also for systematic effects. The main systematic effect comes from the knowledge of the flux. Without the near detector, this is given in first approximation by the statistical error on the number of electron neutrinos detected in the far detector. Other sources of systematics are corrections due to the knowledge of the muon polarization, and from uncertainties on electron and muon identification efficiencies:
The contribution of the first two components of the total error, of pure statistical nature, are plotted in Figure 5 as a function of the integrated flux. Even in the most favorable case, this error never gets below 2%, and it is assumed that the other sources of systematics, indicated by S in the above expression, are controlled to a better level, so they are neglected in the total error estimation.
Being of only statistical nature, the total error decreases as the square root of the total flux. If a near detector is built, the statistical error on the number of detected becomes negligible, but then systematic effects due to the extrapolation from the near to the far detector become relevant.
The error also shows a dependence on the inverse of the square of the beam energy, because of the combined effect of the increased neutrino cross section and of the larger number of neutrinos reaching the far detector as an effect of the Lorentz boost. Since, as seen before, the oscillation probability decreases with the square of the beam energy, at first approximation the sensitivity of the experiment is independent on the energy.
From the curves shown, it is possible to see that for the low energy beam the oscillation probability is equal to the error in the case of muons for values of around .
The above discussion is based on the fact that at low oscillation probabilities the oscillation occurs in the low energy part of the spectrum, where statistics is limited. At higher values of , however, more information can be extracted from the energy distribution of the detected neutrinos, in addition to the total flux, since in this case the characteristic oscillation pattern can be seen. As an example, the spectra of , without oscillations, with oscillations and their ratio are shown in Figures 6 and 7 assuming value of of and , and considering the smearing due to the energy resolution of the ICARUS detector. The oscillation patterns are clearly visible.
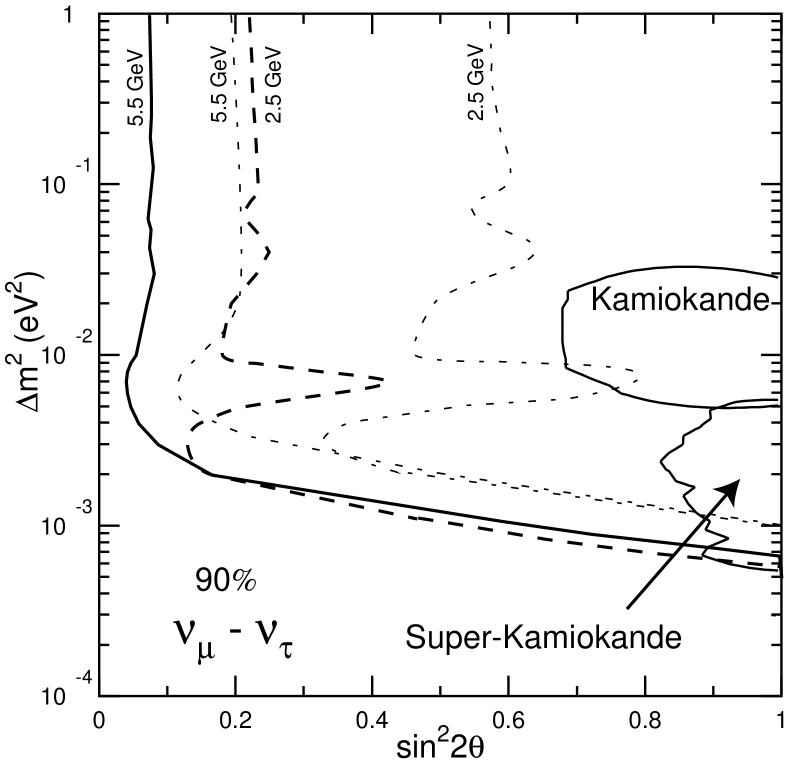
All considerations done so far have been made in the assumption of maximal mixing. When smaller mixing angles are also considered, two-dimensional oscillation contours can be extracted. For the final result we consider the two cases of integrated fluxes: and muons. The 90% C.L. contours are shown in Figure 8 for a muon energy of 2.5 and 5.5 GeV. It can be seen that, while in the “low” intensity scenario the covered area reaches values of of about , for the high intensity case the sensitivity goes to about , thus covering at 90% C.L. all the range indicated by the atmospheric neutrino results.
4 Conclusions
The SuperKamiokande result, allowing the possibility of very small for neutrino oscillations, pose strong challenges to the experiments willing to explore this region of the parameter space. The method presented here is based on disappearance of coming from a muon beam. Given the layout of the accelerator, a near position could be placed on the surface, opposite with respect to the far laboratory. Since a built-in control sample of coming from the same muons can be exploited for normalization, the experiment can however be performed without requiring a near detector, and in this configuration it has the potentiality of reaching in a clean way the low- region suggested by the atmospheric neutrino results.
References
- [1] Y.Fukuda et al. (SuperKamiokande collaboration) preprint hep-ex/9803006 and hep-ex/9805006
- [2] H.Gallagher on behalf of Soudan 2 Collaboration, talk presented at ICHEP98, Vancouver, CA, July 1998
- [3] P.Cennini et al. “ICARUS II. A second generation Proton Decay Experiment and Neutrino Observatory at the Gran Sasso Laboratory”. Experimental proposal LNGS 94/99-I and 94/99-II (1994)
- [4] ICARUS-CERN-Milano Coll., CERN/SPSLC 96-58, SPSLC/P 304, December 1996; J. P. Revol et al., ICARUS-TM-97/01, 5 March 1997, unpublished.
- [5] H.Shibuya et al. “The OPERA emulsion detector for a long-baseline neutrino-oscillation experiment.” Letter of intent LNGS-LOI 8/97.
- [6] M.Ambrosio et al. NOE collaboration, NIM A 363 (1995) 604.
- [7] T.Ypsilantis et al. AQUARICH collaboration, NIM A 371 (1996) 330.
- [8] Y.Oyama, “K2K (KEK to Kamioka) neutrino oscillation experiment at KEK-PS” preprint hep-ex/9803014
- [9] see e.g. http://www-numi.fnal.gov:8875/numi/beam/spectrum.html
- [10] see e.g. F.Pietropaolo, Talk presented at NEUTRINO98 conference, Takayama 1998.
- [11] D.Ayres at al., MINOS proposal, NUMI-L-63, February 9, 1995.
- [12] G.Baldini et al., NICE Proposal, LNGS-LOI 98/13 (1998).
- [13] Status of muon collider, C.M. Ankenbrandt et al.http://www.cap.bnl.gov/mumu/
- [14] S.Geer, Phys.Rev. D 57 (1998) 6989.
- [15] A.Bueno, M.Campanelli, A.Rubbia in preparation.
- [16] C.Acquistapace et al. “The CERN Neutrino beam to Gran Sasso (NGS)” preprint INFN/AE-98/05 (1998).