Problems with Atmospheric Neutrino Oscillations
Abstract
The neutrino oscillation hypothesis does a poor job of representing the
atmospheric neutrino anomaly. The anomaly is observed over 4 decades in
path length and at least a factor of 30 in energy. This restricts the
potential oscillation solutions to those with large amplitudes and mixing
mass differences that are ruled out by other observations. The
region in the range leads to
inconsistencies within the atmospheric neutrino data itself.
The observed value of seems to be incompatible with the
implied by recent results
Subject headings: Cosmic Rays — Elementary Particles — Neutrino Oscillations
pacs:
PACS numbers: 14.60.Pq, 14.60.St, 11.30.-jThe atmospheric neutrino anomaly [1, 2, 3] is the discrepancy between the observed and expected rate of electron and muon neutrino interactions in underground detectors. In general it is believed that these neutrinos originate in the Earth’s atmosphere as a consequence of the decay of short lived particles created by cosmic ray interactions.
The atmospheric neutrino anomaly is characterized by a low fraction of muon neutrino interactions relative to the observed rate of electron neutrino interactions[7]. Only 61% of the expected rate is found. The deficiency is energy independent in the range 200 MeV to 4000 MeV. The deficiency appears to be isotropic up to at least 120 MeV. In particular neutrinos entering the detector from above evidence the same muon neutrino deficiency as in other directions.
The Kamioka experiments like to present their results on the atmospheric neutrino anomaly in terms of . is interpreted as the fraction of muon neutrino events observed compared to what is expected. is defined as
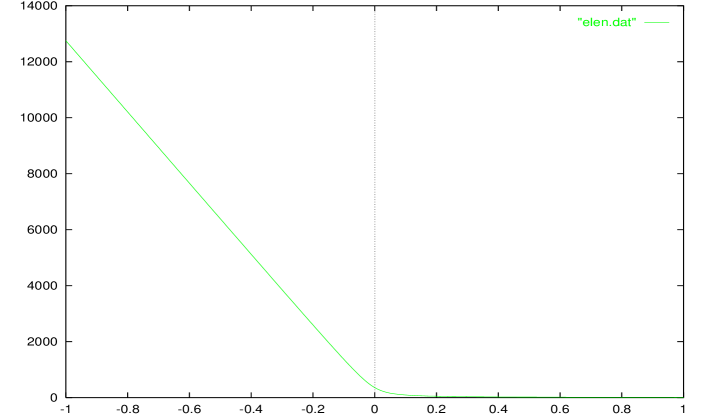
Underground detectors sample the neutrino flux from all directions. Since the neutrinos are produced by particle decays in the atmosphere, different directions correspond to different neutrino flight distances. Neutrinos coming from below the detector are primarily from a distance of the order of 8,000 km. Those from above have a flight path on the order of 20 km. Since a decay can occur anywhere in the atmosphere the decay distance is uncertain by about 10 km. The transition from the short flight distance to the long flight distance is rather rapid (figure 1). Most of the solid angle is composed of sources at the two distances. 40% of the solid angle corresponds to a flight length under 45 km. 40% of the solid angle corresponds to a flight length in excess of 2600 km. The neutrino spectrum peaks at 200 MeV but the contained sample extends out to about 1300 MeV.
Figure 1 shows the approximate neutrino flight path as a function of the zenith angle. The path length as a function of zenith angle can be represented (approximately) by With representing the distance from the center of the earth to the upper atmosphere where the neutrinos are born and representing the distance from the center of the earth to the detector ().
The most popular explanation for the source of the anomaly is the oscillation of muon neutrinos. Recently the Super-Kamioka collaboration has provided strong evidence for neutrino oscillations as a source of the atmospheric neutrino anomaly[4, 5]. But these results seem to be internally inconsistent and inconsistent with other recent Super-Kamioka observations of atmospheric neutrinos[6] and much of the prior work on the anomaly[1, 2, 3].
Oscillations must be capable of mixing the neutrino flux over the energy and distance scales observed. The oscillation length is given by:
or
So the neutrino energy and oscillation distance set the scale for the neutrino mass. At MeV and km (4 times 30 km since the amplitude is proportional to ) gives a mass scale of eV2. At lower mass scales the downward flux will not have had a chance to fully oscillate. Isotropy would no longer be apparent.
For mass scales below these it also becomes very difficult to obtain the observed deficiency in the global sample since the upper hemisphere would not have oscillated in the short distance available and the maximum attenuation from the long path length lower hemisphere would be 50% (if no other oscillation length were comparable). So the maximum attenuation of the global muon neutrino signal under these conditions would be on the order of 75%.
To explain the isotropic reduction of the contained event sample in the momentum range less than about 1 GeV/c2 requires a in the range of eV2. But the reduction appears to be constant out to about 4 GeV[6] which implies a mass near the upper part of this range. IMB has presented evidence that the isotropy extends out to at least a mean energy of 4 GeV [8]. Super-Kamiokande indicates a value of is about 0.6 at 4 GeV[6]. These observations push the minimum mass scale possible up to eV2.
These arguments about isotropy and maximal flux reduction are well known and have motivated the energy-distance scale of a number of long baseline accelerator and reactor neutrino experiments designed to study the oscillation hypothesis. Such regions have been probed, and limited by studying energetic upward going muons in underground detectors[9]. Upward going muons come from the interactions of energetic muon neutrinos in the rock underneath the detector. They, in general, come from a much higher region of the neutrino energy spectrum.
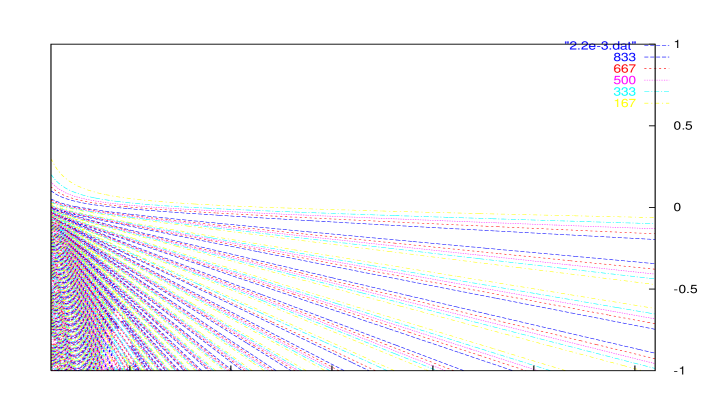
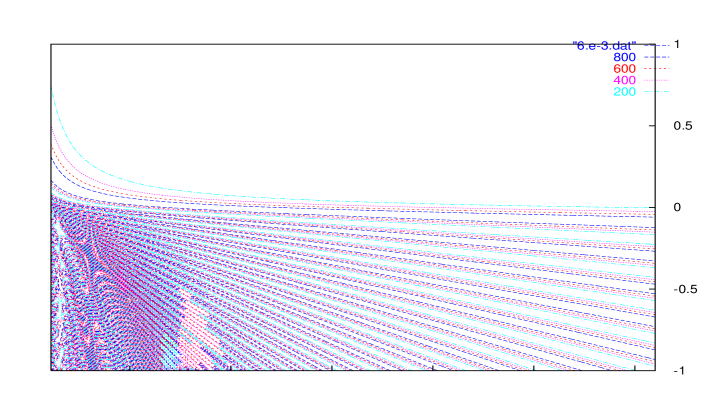
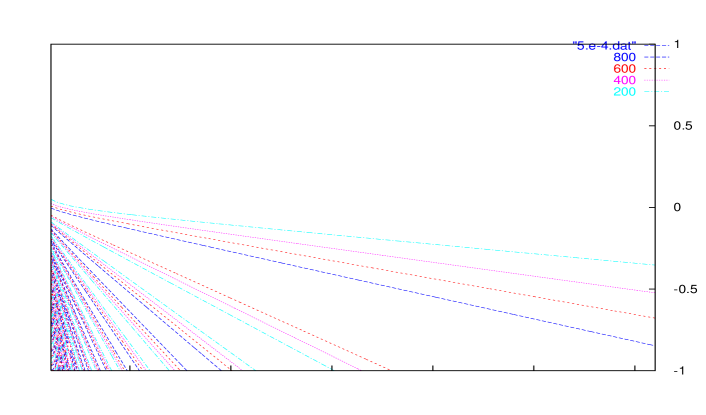
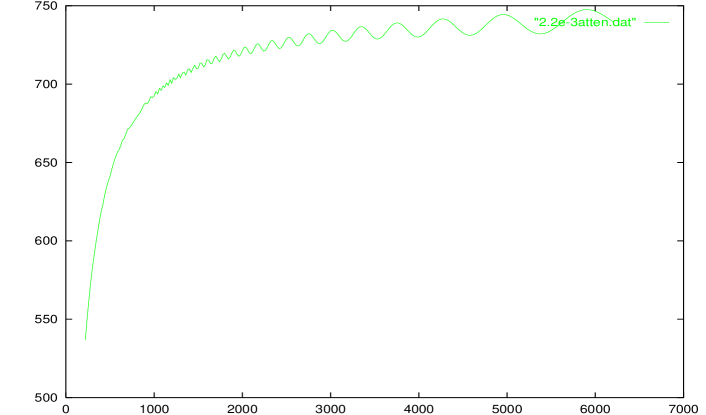
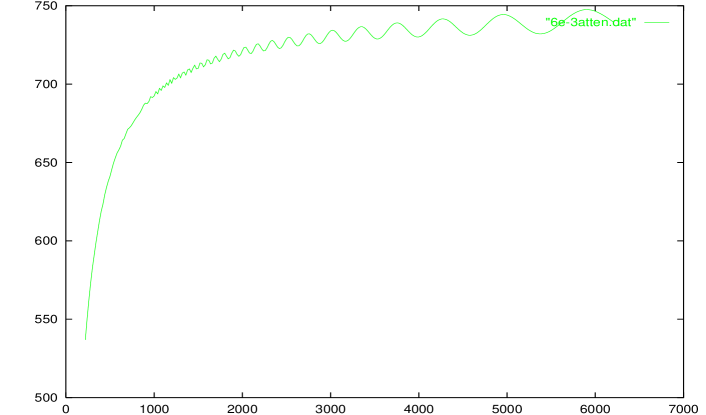
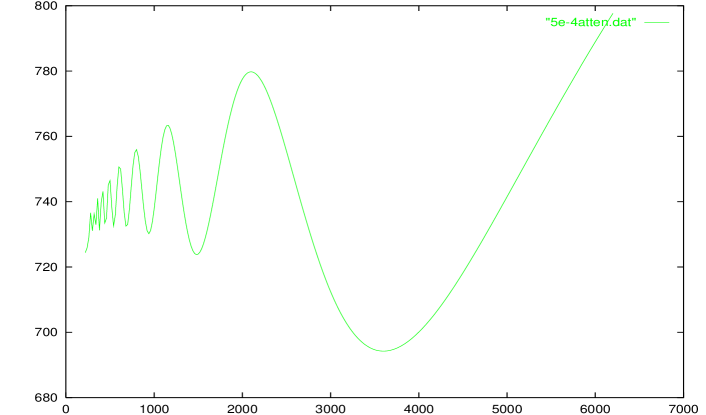
Figure 2 shows a contour plot of the function for a range of neutrino energies from 200 MeV to 6200 MeV. The plot is made for the mass scale eV2 favored by the recent Super-Kamioka results. The lowest contour present in the figure represents a 17% reduction in flux. Almost no reduction is seen for neutrinos originating in the upward hemisphere. Figure 3 and figure 4 are similar plots for eV2 and eV2 respectively.
Integrals over portions of Figures 2, 3 and 4 give the maximum decrease in muon neutrino flux attributable to oscillations for that interval. (Maximum since these plots have been made for the maximum mixing angle.) This, of course, must be weighted by the neutrino interaction rate, which is a function of energy if the integral is made over much of a range of energies. The global attenuation factor at an energy is given by:
Figures 5, 6 and 7 are plots of numerical evaluations of these integrals, as a function of energy. Figure 7 shows that at the rather small value of eV2, the wavelength at modest energies starts to become comparable to the Earth’s diameter. So at 3.5 GeV a very large portion of the lower hemisphere is maximally oscillated away.
Figures 5 6 and 7 are the values that would be found if the anomaly could be explained by a simple neutrino oscillation hypothesis that would remove muon neutrinos by turning them into inactive objects, such as tau neutrinos. We note that it seems to be hard to get a value of this way.
To be isotropic the integrals over subranges in solid angle should also give the same value. For example:
It should be clear from figures 2, 3 and 4 that these integrals will differ. For all mass scales permitted by the recent results these integrals differ by about since the upper region is not mixed and the lower region has been, in general, mixed over several cycles. In cases where the oscillation length is comparable to the Earth’s diameter even larger asymmetries would be seen. The two integrals are equal in both the low and high limit. At very small both integrals are zero. At very high values of both sides average over many cycles and are hence .
The puzzling feature that the attenuation attributable to oscillations for these values of is smaller than that observed could be due to a number of factors. If the is large and mixing is maximal as much as 50% of the muon sample could be removed. If muon neutrinos oscillate into electron neutrinos, either via a direct path or via other neutrinos this would raise the observed electron rate above expectations and therefore lower the value of . But the Super-Kamioka data[4] shows no evidence for electron modulation. The Chooz reactor experiment[10] has fairly strong limits on electron antineutrino oscillations at comparable . One might evade the Chooz limit with CP violation since Chooz limits not and one might fix the atmospheric with . But CP violation effects are unlikely to work in a 3 neutrino scheme since the transition must have a short wavelength and the other amplitudes needed to interfere with it to get CP violation have at least one long wavelength part. It might be possible in a 4 neutrino scheme with 14 parameters. But the ratio observed seems to be normal.
A puzzling feature of most atmospheric neutrino experiments has been that the rate of neutrino interactions agrees fairly well with expectations even though the number of muon neutrino induced events is low. The observed event rate[7] is 962% of the expected value (943% of the expected rate for the multi GeV sample[6]). Since the muon neutrino rate appears to be reduced by about 39% and the muon neutrino rate is expected to be about twice that of the electron neutrino rate one might expect an observed flux of only about 75% of that expected. The true neutrino flux may in fact be 25% higher than predicted.
This might imply that the electron neutrino rate is too high and compensates for the loss. It is also possible that there are sources other than the atmosphere for neutrinos observed in these detectors.[11]
The Super-Kamioka result[4] came as a bit of a surprise to the community since the mass scale in question had been probed and ruled out by prior experiments. For example the Super-Kamioka 90% confidence level contour of neutrino oscillation parameters is barely consistent with that from Kamioka. IMB[8] failed to confirm the modulation observed in the Kamioka Multi GeV data[12]. Aside from concluding that some of these observations were wrong is there a physical picture which is compatible with most of them? The mass of the neutrino is a constant of nature that can not be different at different times or places. Since the Earths magnetic field is not a simple dipole aligned along the Earth’s axis one does not expect the cosmic ray flux to be uniform[13]. The most difficult observation to interpret is the isotropy of the electron sample in [4] in the presence of a large muon anisotropy. While geomagnetic effects and the solar cycle can be expected to modulate the atmospheric spectrum and to give it temporal variation. These changes would be manifest in all neutrinos of atmospheric origin.
It may be difficult to rule out any neutrino oscillation hypothesis from the atmospheric results alone. The prior, unmodulated, results are insensitive to large scales. It was these relatively large that provided the motivation for long baseline reactor and accelerator neutrino experiments. The magnitude of the atmospheric effect means that at least some of the mixings to the muon neutrino would be large.
Acknowledgments
I would like to thank John Learned, Danka Kielczewska, Wojtek Gajewski and Maurice Goldhaber for helpful communications about the Super Kamiokande results. I am deeply indebted to Ikaros Bigi for stimulating discussions and for assuring me of my sanity. Some of this work was performed at SLAC.
REFERENCES
- [1] T.J. Haines et al., Phys. Rev. Lett. 57, 1986 (1986).
- [2] K.S. Hirata et al., Phys. Lett. B205, 416 (1988).
- [3] R. Becker-Szendy et al., Phys. Rev. D46, 3720 (1992). D. Casper et al., Phys. Rev. Lett. 66, 2561 (1991).
- [4] Y. Fukuda et al., “Evidence for Oscillation of Atmospheric Neutrinos”, hep-ex/9807003 (to be published).
-
[5]
“Atmospheric Neutrino Results from Super-Kamiokande and
Kamiokande – Evidence for Oscillations”, Talk presented at
Neutrino ’98, Takayama Japan, June 4, 1998.
The New York Times, CXLVII, 1 (June 5, 1998). - [6] Y. Fukuda et al., “Study of the Atmospheric Neutrino Flux in the Multi-GeV Enegy Range”, (to be published).
- [7] Y. Fukuda et al., “Measurement of a Small Atmospheric Ratio”, Phys. Lett. (to be published)
- [8] R. Clark, et al., “The Atmospheric Muon Neutrino Fraction Above 1 GeV”, Phys. Rev. Lett. 79, 345-348 (1997).
- [9] R. Becker-Szendy, et al., “A Search for Muon Neutrino Oscillations with the IMB Detector”, Phys. Rev. Lett. 69, 1010 (1992).
- [10] M. Apollonio et al., “Initial Results from the CHOOZ Long Baseline Reactor Neutrino Oscillation Experiment”, hep-ex/9711002.
- [11] J. LoSecco, “Bounds on Dark Matter from the ‘Atmospheric Neutrino Anomaly’ ”, Phys. Rev. D 56, 4416 (1997).
- [12] Y. Fukuda et al., Phys. Lett. B335, 237 (1994).
- [13] M. Honda et al., Phys. Rev. D53, 4985 (1995).