The Phase Diagram of QCD
Abstract
We show that current experimental knowledge of QCD together with general model independent arguments such as continuity, universality and thermodynamic relations, as well as the information gained from various models can be used to constrain the phase diagram of QCD as a function of temperature and baryon chemical potential.
1 Introduction
Understanding the phase diagram of QCD as a function of temperature, , and chemical potential of the baryon charge, , is an important ingredient in the analysis of the results of heavy ion collision experiments. We know a good deal about the behavior of QCD at finite temperature. The basis for our understanding is provided by the first principle lattice QCD Monte Carlo calculations. In particular, we know that QCD with two massless quarks undergoes a phase transition to the quark-gluon plasma phase at a temperature of about 160 MeV. In contrast to that our understanding of the behavior of QCD at finite baryon charge density, or finite , is extremely poor. This is due to the unfortunate fact that lattice QCD calculations based on Monte Carlo methods are not possible because the measure of the Euclidean path integral is complex when is not zero. In this report, based on the work [1], we put together available experimental facts about QCD, results from various models, and apply general model independent arguments such as continuity, universality and thermodynamic relations in order to construct the phase diagram of QCD in the plane.
We perform our analysis for the two-flavor QCD — a well-known and phenomenologically successful approximation to real QCD. The effects of the strange quark and electroweak interactions lead to quantitative and in some cases qualitative modifications which we also consider. The theory is described by a partition function:
| (1) |
The Euclidean action, , is given by
| (2) |
where is the number of flavors, is the number of colors, and is the quark mass. The Euclidean matrices are hermitian. The normalization of differs from the normalization customary in lattice calculations by a factor (i.e., the baryon charge of a quark).
What do we actually mean by understanding the phase diagram? The most prominent features of a phase diagram are phase transitions. They manifest themselves through the singularities or discontinuities in the dependence of various thermodynamic observables on the parameters and . Such observables can be obtained by differentiating the thermodynamic potential with respect to and :
| (3) |
where is the baryon number density, and is the entropy density. These are the densities of extensive quantities, such as baryon charge and entropy, per volume, . The pressure, , is not independent from and (and also ):
| (4) |
This equation can be used to derive Clapeyron-Clausius-type relations between the slopes of the first-order transition lines and the discontinuities of , and [1, 2, 3].
There are two thermodynamic observables which turn out to be more useful than others in discovering phase transitions: and . This is because both are good order parameters, i.e., they vanish identically in one phase and are nonzero in the other. There must be a singularity, and thus a phase transition, separating such two phases. Theoretically, we understand, at least qualitatively, the behavior of because it is an order parameter of a global symmetry, SU(2)SU(2)R, and it distinguishes two phases with two different realizations of this symmetry: spontaneously broken and exact. However, phenomenologically we know little about this phase boundary (yet!). On the contrary, it is harder to understand theoretically the behavior of , but, fortunately, we happen to live near the phase boundary separating phases with and . As a result, we have a good empirical and quantitative knowledge about this phase transition.
2 Zero
To see why can serve as a good order parameter consider the partition function (1) written in the form of the Gibbs sum over the quantum states of the system characterized by their energy, , and baryon charge, :
| (5) |
In the limit , the state with the lowest value of determines the properties of the system. This is the ground state at given . Let us introduce
| (6) |
As long as no state with nonzero can compete with the vacuum state (, ) for the role of the ground state. Therefore, as long as and , the equation holds exactly. If when , the point must be a singular point.
In QCD without electromagnetism this singularity is a first order phase transition separating vacuum phase from nuclear matter phase, distinguished (at only) by the order parameter . The function has a step at MeV equal to the density of nuclear matter at zero pressure as in Fig. 1a. The slope of just above is also known. In the real world, the electromagnetic interaction and the presence of electrons produce a tiny step at MeV to the density of iron. The step to the density of neutron matter occurs at somewhat larger value of (see Fig. 1b) at non-zero pressure (as in neutron stars).


(a) (b)
Increasing further takes QCD into the region about which we have very little reliable theoretical or experimental information. Various interesting phenomena have been predicted using different models. Rigorously, however, one can only expect that the function continues to grow, to satisfy thermodynamic stability. Since is non-zero it cannot serve as a good order parameter anymore and we shall turn to another one: .
At very large the ground state of the system is to a good approximation a Fermi sea of quarks. (This fact also leads to an interesting possibility of quark-quark pairing around the Fermi surface and color superconductivity [4].) Thanks to the asymptotic freedom and the screening of color interactions by the sea of quarks, nonperturbative effects are suppressed. This motivates the conclusion that at very large the condensate vanishes (provided that quark masses are zero). If we denote by the value of such that for and otherwise, then the point must be a singular point. It separates two phases with distinct realizations of the global SU(2)SU(2)R chiral symmetry.
There has been a wealth of theoretical research on the phase transition at (see, e.g. [6]). However, since no first principle lattice calculations are possible at present, the best we have is a collection of estimates obtained in various models approximating the behavior of QCD at the chiral symmetry restoration transition. The common denominator seems to be that the transition is most likely of the first order. The value of is somewhere of the order of 1 GeV. Also, the empirical fact that stable nuclear matter with and exists indicates that . (The strange quark tends to lower the value of . An interesting, but empirically disfavored, possibility that , strange quark matter at zero pressure, arises in this case [5].)
3 Nonzero
At finite the baryon density is no longer a good order parameter. However, since the transition at is of the first order, continuity ensures that it remains first-order for sufficiently small . The end-point of this transition is a critical point in the Ising universality class, which is probed in the multifragmentation experiments [7].
The chiral condensate is a good order parameter at , as long as . This means that the regions at low and and at high and must be separated by a phase transition. At lattice simulations predict that the chiral symmetry is restored at MeV for two-flavor QCD [8]. A beautiful argument [9] suggests that this transition is likely to be a second order transition in the universality class of spin models in 3 dimensions.
At nonzero there is a line of second order phase transitions in the universality class (the direction is not relevant near this critical point). Since this line cannot terminate, and since at the transition is, presumably, of the first order, a logical possibility arises that the transition turns first order in some point , on the phase diagram. This point has been observed in various models of QCD chiral phase transition [3, 6, 1, 10]. We wish to point out that the critical behavior near this point is determined by universality (the observation also made independently in [10]). Study of tricritical points shows [11] that the upper critical dimensionality for such a point is 3 and, therefore, in QCD with two massless quarks the critical behavior near the tricritical point must be given by the mean field theory up to logarithmic corrections.
In this work we used a random matrix model to describe the chiral phase transition. In accordance with generic expectations and other models it predicts a tricritical point.
4 A random matrix model at finite and
A successful and very simple model which describes the degrees of freedom of QCD related to the spontaneous breaking of chiral symmetry is the random matrix model. It is based on the famous observation of Banks and Casher that the value of is related to the density of small eigenvalues of the Dirac operator . Since we do not need to describe all the degrees of freedom of QCD, but only those relevant to chiral symmetry breaking, a natural and simple approximation of the Dirac operator by a random matrix arises [12]. This approach is reminiscent of the one introduced by Wigner in the study of spectra of heavy nuclei. The power of the random matrix model in describing the chiral symmetry breaking and restoration at finite chemical potential is in the fact that, on the one hand, this model shares an important property of QCD at — the complex fermion determinant, and it is exactly solvable, on the other hand. A successful example is the explicit demonstration that at nonzero quenched QCD is not a smooth limit of real QCD [13].
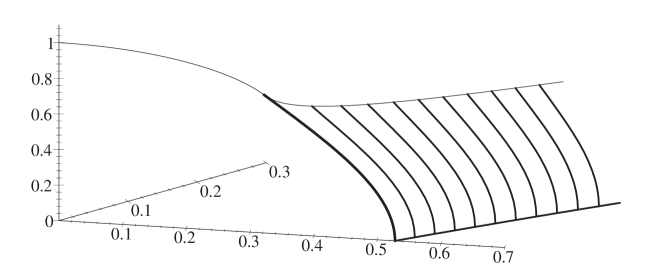
The phase diagram calculated in the random matrix model [1] is shown in Fig. 2. We see that the second order phase transition line in the plane turns into a first order line at the tricritical point. The coordinates of this point are given by: , . Taking MeV and MeV, we find that MeV and MeV. A similar estimate has been obtained recently using a different model [10].
5 Conclusions

We conclude with a sketch of the phase diagram (Fig. 3) of QCD with two massless quarks which we find by analyzing the behavior of two thermodynamic quantities: and . These quantities are distinguished by the fact that both are good order parameters in a certain sense: they identically vanish in some region of the phase diagram and are non-zero in the other. The change of the behavior of such a parameter from one region to the other is qualitative and must proceed through a thermodynamic singularity.
Perhaps, the most interesting feature of this phase diagram is the presence of the tricritical point. At small nonzero quark mass the main change in the phase diagram is the disappearance of the second order phase transition line (see Fig. 2). The first-order line remains, but it no longer separates phases with different symmetry properties — the chiral symmetry is explicitly broken. What is important is that the criticality at the end-point of the first-order phase transition line remains.
The strategy for locating this end-point in the heavy ion collision experiments is discussed in [14]. The signatures proposed in [14] are based on universal thermodynamic properties of the critical point. For example, the divergence of the heat capacity will lead to suppression of the event-by-event fluctuations of the apparent temperature. Another signature is due to the long-wavelength fluctuations of the sigma field near the critical point, which leads to enhanced production of soft pions. An inspiring example that the study of critical behavior in heavy ion collisions may, in principle, be possible is provided by the multifragmentation experiments [7], which can probe the end-point of the nuclear liquid-gas phase transition.
References
- [1] M.A. Halasz, A.D. Jackson, R.E. Shrock, M.A. Stephanov and J.J.M. Verbaarschot, hep-ph/9804290.
- [2] H. Leutwyller, Phys. Lett. B 284 (1992) 106.
- [3] A. Barducci, R. Casalbuoni, G. Pettini, and R. Gatto, Phys. Rev. D51 (1994) 426.
- [4] D. Bailin and A. Love, Phys. Rept. 107 (1984) 325; M. Alford, K. Rajagopal and F. Wilczek, Phys. Lett. B422 (1998) 247 and hep-ph/9804403; R. Rapp, T. Schäfer, E. V. Shuryak and M. Velkovsky, hep-ph/9711396.
- [5] E. Witten, Phys. Rev. D 30 (1984) 272; E. Farhi and B. Jaffe, Phys. Rev. D 30 (1984) 2379.
- [6] S.P. Klevansky, Rev. Mod. Phys. 64 (1992) 649.
- [7] L.P. Csernai and J.I. Kapusta, Phys. Rep. 131 (1986) 223; W. Trautmann, in Dronten 1996, Correlations and clustering phenomena in subatomic physics, nucl-ex/9611002.
- [8] HEMCGC and HTMCGC collaborations, Nucl. Phys. B (Proc. Suppl.) 30 (1993) 315.
- [9] R. Pisarski and F. Wilczek, Phys. Rev. D 29 (1984) 338.
- [10] J. Berges and K. Rajagopal, hep-ph/9804233.
- [11] I. Lawrie and S. Sarbach in Phase Transitions and Critical Phenomena 9, (Academic Press, 1984) 1, ed. C. Domb and J. Lebowitz.
- [12] E. V. Shuryak and J. J. M. Verbaarschot, Nucl. Phys. A 560 (1993) 306; For a review and further references, see, e.g., J.J.M. Verbaarschot, these proceedings.
- [13] M.A. Stephanov, Phys. Rev. Lett. 76 (1996) 4472; Nucl. Phys. B (Proc. Suppl.) 53 (1997) 469.
- [14] M. Stephanov, K. Rajagopal, and E. Shuryak, hep-ph/9806219.