with a production
F. Yuasa111fukuko.yuasa@kek.jp, Y.
Kurihara222kurihara@minami.kek.jp and S. Kawabata333kawabata@minami.kek.jp
PACS numbers:13.65.+i, 14.65.Ha
Keywords: top quark, semi-leptonic, 6body, linear colliders, GRACE
High Energy Accelerator Research Organization
Oho 1-1, Tsukuba, Ibaraki 305, Japan
The cross section of process with a complete set of tree diagrams, 232 diagrams in the unitary gauge, was calculated at the energy range of = 340 - 500 GeV by using GRACE system. A main contribution to the cross section comes from production, where and decay into and , respectively. It was found that the interference between the diagrams with production and those with single- through pair production amounts to 10% at the threshold energy region. In the energy region above twice of the top quark mass, more than 95% of the cross section comes from the diagrams.
1 Introduction
The top quark physics[1, 2, 3, 4] is one of the most interesting targets in the near future linear collider experiments[5]. Since the top quark mass is around 174 GeV[6, 7], by the linear colliders at the energy GeV the top physics can be studied precisely. For example, due to the large top decay width, decays into without non perturbative QCD interaction at the long distance. This means that the study of perturbative QCD can be done clearly by using the production process[8, 9].
So far, the investigation of the top quark physics at the future linear colliders has made a great progress both from the theoretical and experimental points of view. At the threshold region, the cross section is expected to depend on several parameters as follows:
where is the top YUKAWA coupling. Fujii et al. have studied quantitatively on the determination of above physical parameters under the realistic conditions. A precise cross section scan was discussed including the initial state radiation, beamstrahlung, and beam energy spread[1]. Above the threshold region, the future linear colliders can provide opportunities to investigate a new physics related the top quark. For example, the studies on the top quark couplings have been made by Comas et al.[2].
The pair production process decays mainly into: 6-jets (), 4-jets plus 1 charged lepton (), and 2-jets plus 2 charged leptons (), where , , and . In this paper we concentrated on the second, the semi-leptonic process . This semi-leptonic (4-jets plus 1 charged lepton) process has several advantages in the event selection for the top quark physics both at the threshold region and above. Firstly, since the semi-leptonic process has less than 6-jets, it is less suffered from the backgrounds due to the wrong combination of jets. Secondly, these semi-leptonic events are produced with enough statistics because is about 44% and is 45% after QCD correction. Moreover, when we use the electric charge of the lepton as tag, we can identify the hemisphere where 3-jets, the decay products of the top quark, appear.
Although the main contribution to the total cross section at = 340 - 500 GeV comes from the diagrams through the production, those from the other diagrams are not negligible small at all. To study the production process precisely, an accurate estimation of the other diagrams is essentially required. We have calculated the cross section of process with a full set of Feynman diagrams, 232 diagrams in unitary gauge. Generally speaking, as the number of final state particles increases, the calculation of the cross section becomes more complicated and more tedious because there exist a lot of Feynman diagrams and there occur interferences among these diagrams. In order to cope with this complex calculation, we have used an automatic Feynman diagrams calculation package, GRACE[10]. All the results obtained for the process are immediately applicable to the other semi-leptonic processes such as when we neglect the difference of mass between and .
In addition to an accurate calculation of the total cross section, the effects of interferences among diagrams have been studied. These interferences change the threshold shape destructively. Also we present the invariant mass and angular distributions of the final state particles at =500 GeV. In order to enhance the signals of production process against the background, we studied on the effective cuts in the invariant mass distributions such as and and the cut for the angle of the final lepton in these distributions. Recently, the similar calculations of six fermions are performed by two groups. Montagna et al.[11] reported a full calculation of the six-fermion process in the linear colliders, where the higgs boson with the intermediate mass are produced, by the program package ALPHA[12] for the matrix elements calculations and HIGGSPV/WWGENPV[13] for Monte Carlo event generation. Accomando et al.[14] have been calculating a semi-leptonic process such as by program package PHACT[15].
In Section 2, we present the details of the computational parameters for the calculations in GRACE at first. Secondly, the numerical results are shown: the total cross sections (Section 2.1), effects of the interferences among diagrams (Section 2.2), and the mass and angular distributions of interest (Section 2.3).
2 Cross Section Calculation
The cross sections have been calculated based on a complete set of the tree level diagrams using GRACE system, a program package for an automatic Feynman diagram calculation and the event generation. When the initial and final states are specified, GRACE generates the matrix elements in terms of helicity amplitudes. The total cross section is computed by the Monte Carlo integration of the matrix elements over the phase space[16]. As for the kinematics, we only have to prepare the suitable program code to the physics process of interest. Usually, as the number of the final state particles increases, it becomes more and more difficult to prepare such a program code of kinematics that may catch every singularities appeared in all diagrams and give a good convergence of the multidimensional Monte Carlo integration. We have developed a kinematics code for the process , which makes the calculation of the total cross sections converge rapidly enough to a good accuracy of better than 1 % at GeV.
The cross sections has been calculated with the parameters shown in Table 1. The widths of and bosons are taken to be the fixed values. The QCD correction is not included in the calculations. The quark masses are set as in Table 2. The quark width of 1.558 GeV corresponds to the decay width of , which means that the decay branching ratio of channel is 100%.
The total cross section of process is calculated to be pb at CM energy of 500 GeV by GRACE. This is consistent with the cross section of processes of pb calculated by GRACE. The cross section of process only with the production diagrams is calculated to be pb ( in Table 3) and is also consistent with pb. Here, we took = 100 %.
2.1 Results of the numerical calculation
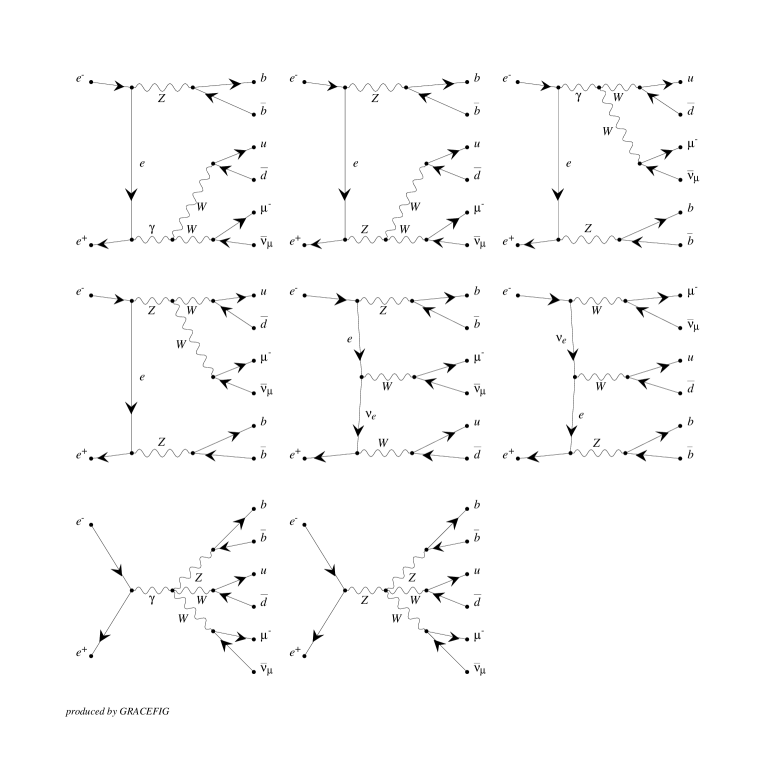
Among all 232 diagrams (unitary gauge) of the process, the production diagrams of Fig.1 are dominant over the others. We have divided the major background diagrams into three categories: the diagrams with (hereafter ) in Fig.2, those with (hereafter ) in Fig.3, and those with single- through pair production (hereafter ) in Fig.4.
The total cross sections with a full set of diagrams at the CM energy points of 340 - 500 GeV are summarized in Table 3 and Fig.5 a) and b). Both in a) and b) of Fig.5, solid lines show the numerical result of the total cross section with all the diagrams. The result with only the dominant diagrams are shown by dashed line in both a) and b). Besides results with all the diagrams and that with diagrams, we also showed those with and the major background diagrams. Dotted lines in a) and b) show the result with and and that with and , respectively. Dot-dashed lines in a) and b) show the result with , , and and that with , , and , respectively. These results shown by dotted lines and dot-dashed lines include the interferences among selected diagrams.
As shown in Fig.5, cross sections with both and the major background diagrams show different behaviors from that with all the diagrams. The difference between them is about 3% at = 500 GeV. This means that the effect from the interference between and the rest diagrams except , , and are also not negligible and important. The contribution from the background diagrams to the total cross section, , is less than 5% in total above the energy of twice of the top quark mass.
2.2 Interference between diagrams
Due to the large decay width of the top quark, at the threshold region it decays so immediately that the non perturbative QCD effect at the long distance does not take part. Thus, the cross section of can be calculated by means of the perturbative QCD theory[8]. By measuring the cross section of the production around the threshold region at the future linear colliders, a clear test of the perturbative QCD theory is possible. To determine the QCD parameters like , it is essential to measure of the cross section accurately. In our calculation, the effects from initial state radiation, beamstrahlung, and beam energy spread were neglected. These effects to the shape of cross section has been well investigated by Fujii el al.[1, 2, 3]. Besides these effects, it is important to take the effect such as the interferences between diagrams and the other background diagrams into account.
It is found that there are destructive interferences between diagrams with production and those with single- through WW pair production around the threshold region. In order to see the behavior of these destructive interferences the values of are plotted at several energy points in Fig.6. The magnitude of the destructive interference is as large as 10 % at = 340 GeV. Then it drops rapidly as CM energy goes up. In the energy region above twice of the top quark mass, this destructive interference becomes less than 2 % and above = 360 GeV it becomes negligible small.
When we generate Monte Carlo events with the luminosity 1 in each energy points, the destructive interference of 10 % is not negligible compared to the statistical errors at the threshold region. For example, at = 350 GeV the total cross section of is pb and the statistical error is estimated to be a few %.
2.3 Invariant mass and angular distributions
Above the threshold energy region, there open the opportunities of measuring the top production and decay couplings. For this analysis, the process of semi-leptonic 4-jets plus 1 charged lepton is useful to distinguish from by the electric charge of the lepton. Generally, in order to select the semi-leptonic production events, firstly an isolated charged lepton and 4 jets are required in the event. Then two jets out of the four are to be identified as jets in the vertex detector. From the electric charge of lepton, we can determine the hemisphere where 3 jets from the top quark appear. If the invariant mass of 2 jets in this hemisphere and one of jets becomes nearly equal to the mass of the top quark, we accept it as the production event.
The invariant mass distribution of , and , and that of and at GeV are shown in Fig.7 a) and b), respectively. In Fig.7, histograms show the invariant mass distributions for the diagrams of production and crosses show those for all the diagrams. As shown in Fig.7 a), if we take only those events around the top quark mass on the distribution, the contribution from the background diagrams becomes negligibly small. At the energy of = 500GeV, when the top quark mass cut, e.g. 148 GeV 204 GeV is applied, the contribution from the background diagrams is reduced from about 5% to less than 3%. In Fig.7 b), crosses shows that the contribution from diagrams can be seen at the low-end and the contribution from diagrams can be seen at the mass of Z boson.
For the analysis of the top couplings, it should be noticed that the top quark decays immediately before it hadronizes and its spin information is transferred to the final state particles[2]. The angles of the final state particles are important parameters in order to reconstruct the production angle of the top quark. Here, we show the angular distributions of final in Fig.8. The backgrounds in the forward angle region, from all the diagrams are significant in the distribution of the angular distribution, at GeV. For example, when the top quark mass cut such as 148 GeV 204 GeV is applied, the effects from the background in the angular distribution of can be reduced to less than 2% but still exists as shown in Fig.8 b).
3 Conclusion
The total cross section of process at the energy range of = 340 - 500 GeV was calculated with a complete set of tree diagrams by using GRACE. Among all diagrams, the main contribution to the total cross section comes from the production diagrams. The background to the production from all the diagrams is below 5% above the threshold. The contributions from the major background diagrams such as , , and single- through pair production are also calculated. Compared these results to those with all diagrams, it is found that the interference between and the rest diagrams except the major backgrounds is not negligible. It is also found that the diagrams of production and those with single- through WW pair production make a strong destructive interference (as large as 10%) around the threshold region. This destructive interference has a deep effect on the shape of the cross section at the threshold region.
We calculated the distributions of the invariant masses and the angular distribution of the final state particles at GeV. Angular distributions of shows a large effect of backgrounds at the forward angle. Even when we apply the cut in the invariant mass distribution of , , and to enhance the top quark signal, the background from the diagrams with , and single- through WW pair did not disappear in the angular distribution of
As a conclusion, for the analysis of the top quark physics around the threshold region and above, the accurate calculation including full set of 232 Feynman diagrams is essential.
Acknowledgements
The authors wish to acknowledge to Minami-Tateya Collaboration. Especially, we are indebted to Prof. Y.Shimizu, Prof. T.Ishikawa and Dr. J.Fujimoto for valuable suggestions and encouragements. The authors also wish to thank Dr. E. Accomando and Prof. A. Ballestrero for useful discussions and comparisons with their work are gratefully acknowledged. One of the authors (F.Y.) thanks Dr. T.Omori for fruitful discussions. This work is supported in part by Ministry of Education, Science, and Culture, Japan under Grant-in-Aid for International Scientific Research Program (No.09044359).
References
-
[1]
K.Fujii, T.Matsui, and Y.Sumino, Phys. Rev. D50 (1994) 4341.
K.Fujii, Proceedings of the Second Workshop on JLC, Tsukuba, Japan, 1990. -
[2]
P.Igo-Kemenes, M. Martinez, R. Miquel, and S. Orteu,
Proceedings of the Workshop on Physics and Experiments with Linear
Colliders (LCWS93), Waikoloa, Hawaii, USA, 1993.
P.Comas, R.Miquel, M.Martinez, and S.Orteu, Proceedings of the Workshop on Physics and Experiments with Linear Colliders (LCWS95), Morioka-Appi, Iwate, JAPAN, 1995. - [3] Proceedings of the Workshop Collisions at 500 GeV: The Physics Potential, Munich-Annecy-Hamburg, ed. P.M.Zerwas, Reports DESY 92-123A, 327 and 93-123C.
- [4] Raymond Frey et al., hep-ph/9704243 4 Apr 1997, Top Quark Physics: Future Measurements.
-
[5]
JLC Group, KEK Reports 92-16, 1992, JLC-I.
TESLA collaboration (R. Brinkmann for the collaboration), DESY-M-95-08N, Jun 1995. 3pp. Presented at 16th IEEE Particle Accelerator Conference (PAC 95) and International Conference on High Energy Accelerators (IUPAP), Dallas, Texas, 1-5 May 1995. Published in IEEE PAC 1995:674-676.
The NLC Design Group, Zeroth-Order Design Report for the Next Linear Collider, SLAC-474, May 1996. - [6] F. Abe et al. (CDF Collaboration), Phys. Rev. Lett. 74 (1995) 2626.
- [7] S. Abachi et al. (D0 Collaboration), Phys. Rev. Lett. 74 (1995) 2632.
-
[8]
V.S. Fadin and V.A. Khoze, JETP Lett. 46 (1987) 525.
V.S. Fadin and V.A. Khoze, Sov. J. Nucl. Phys. 48 (1988) 669. - [9] M. Strasseler and M.Peskin, Phys. Rev. D 43 (1991) 1500.
-
[10]
T. Ishikawa, T. Kaneko, K. Kato, S. Kawabata, Y. Shimizu and H. Tanaka,
KEK Report 92-19, 1993, The GRACE manual Ver. 1.0.
H. Tanaka, Comput. Phys. Commun. 58 (1990) 153, and H. Tanaka, T. Kaneko and Y. Shimizu, Comput. Phys. Commun. 64(1991) 149. - [11] G. Montagna, M. Moretti, O. Nicrosini and F. Piccinini, hep-ph/9705333 16 May 1997, Six-Fermion Calculation of Intermediate-mass Higgs Boson Production at Future Colliders.
- [12] F. Caravaglios and M. Moretti, Phys. Lett. B358 (1995) 332.
-
[13]
G.Montagna, O.Nicrosini and F.Piccinini, Comput.
Phys. Commun. 90 (1995) 141.
D.G. Charlton, G.Montagna, O.Nicrisini and F.Piccinini, Comput. Phys. Commun. 99 (1997) 355. -
[14]
E. Accomando, S. Ballestrero and M. Pizzio,
Torino preprint DFTT 74/96, hep-ph/9706201 2 Jun 1997.
E. Accomando, talk given at the ECFA/DESY LC Workshop, DESY, Hamburug, November 1996. - [15] A. Ballestrero, E.Maina, Phys. Lett. B350 (1995) 225.
-
[16]
S. Kawabata, Comput. Phys. Commun. 41(1986) 127.
S. Kawabata, Comput. Phys. Commun. 88(1995) 309.
| 91.187 GeV | |
| 2.49 GeV | |
| 80.22 GeV | |
| 2.052 GeV | |
| 1/128.07 |
Table 1 The parameters
| 174 GeV | |
|---|---|
| 1.558 GeV | |
| 4.1 GeV | |
| 2 MeV | |
| 5 MeV |
Table 2 The mass and width parameters
| all diagrams | + | + | ||||
| 340 | ||||||
| 350 | ||||||
| 360 | ||||||
| 370 | ||||||
| 380 | ||||||
| 390 | ||||||
| 400 | ||||||
| 450 | ||||||
| 500 |
Table 3 The total cross sections in pb.