hep-ph/9609309
DESY 96-185
Edinburgh 96/24
STRUCTURE FUNCTIONS
Richard D. Ball111Royal Society University Research Fellow
Department of Physics and Astronomy
University of Edinburgh, EH9 3JZ, Scotland
and
Albert De Roeck
DESY, Notkestr.85,
D-22607 Hamburg, Germany
We summarize recent developments in the understanding of nucleon structure. New data on , and , over a wide range of (from GeV2 down to GeV2) and (down to ), are described. Conventional leading twist NLO perturbative QCD gives an excellent description of all the new data with above a GeV, leaving very little room for either higher twists or higher logarithms. We summarize the current status of NLO fits, and the determination of the gluon distribution and the strong coupling constant from structure function data. Finally we consider some of the theoretical issues raised by the new data.
Summary Talk of WG1 at DIS96, Rome, April 1996
to be published in the proceedings
August 1996
STRUCTURE FUNCTIONS
We summarize recent developments in the understanding of nucleon structure. New data on , and , over a wide range of (from GeV2 down to GeV2) and (down to ), are described. Conventional leading twist NLO perturbative QCD gives an excellent description of all the new data with above a GeV, leaving very little room for either higher twists or higher logarithms. We summarize the current status of NLO fits, and the determination of the gluon distribution and the strong coupling constant from structure function data. Finally we consider some of the theoretical questions issues by the new data.
Until a few years ago our knowledge of structure functions and derived quantities such as parton distributions came almost entirely from fixed-target experiments, using muon and electron beams. Now it is being complemented and extended by results from the HERA collider, especially in the regions of low and high . At this workshop both the fixed target and the HERA experiments have presented new data on , extending the kinematical range and reaching a precision of more than a factor two better than the results from the 1993 run shown at last year’s meeting in Paris. The ZEUS data now reach values down to 0.1 GeV2, and values as low as . New measurements of the ratio of the longitudinal to transverse photon absorption cross section were shown by NMC and CCFR. A first glimpse of at low was presented by H1. There were also new data on the charm quark contribution to .
Already at last year’s meeting it was clear that HERA data at low but with above a few GeV2 are well described by conventional leading twist NLO perturbative QCD evolution from a flat or valence-like boundary condition. The increased precision of the new data have considerably reinforced this conclusion, putting tight constraints on the size of novel effects such as BFKL logarithms (i.e. higher orders) and parton recombination (i.e. higher twist). The apparent absence of such contributions poses various interesting theoretical problems, some of which were discussed at this meeting.
On the other hand the serendipitous success of NLO perturbative QCD at small encourages us to use it to extract parton distributions in the proton, and in particular the gluon content of the proton at low . At large the gluon can be constrained with the help of the newly available inclusive jet data from the Tevatron and an improved understanding of the older prompt photon data. Both of these recent developments lead to new information on the strong coupling.
Here we only discuss in detail data on unpolarized nucleon structure functions: data on diffractive and polarized nucleon structure functions was presented in the sessions of other working groups, and discussed in joint sessions.
1 The Structure Function Data
The differential cross section for neutral current deep inelastic scattering is related to the three structure functions and according to
| (1) |
Here is the four momentum transfer, the Bjorken- value and the energy transfer from the electron to the proton in the proton rest frame. The parity violating structure function only becomes significant in the region where exchange or interference dominates, i.e. at large . The effect of is important at large , typically .
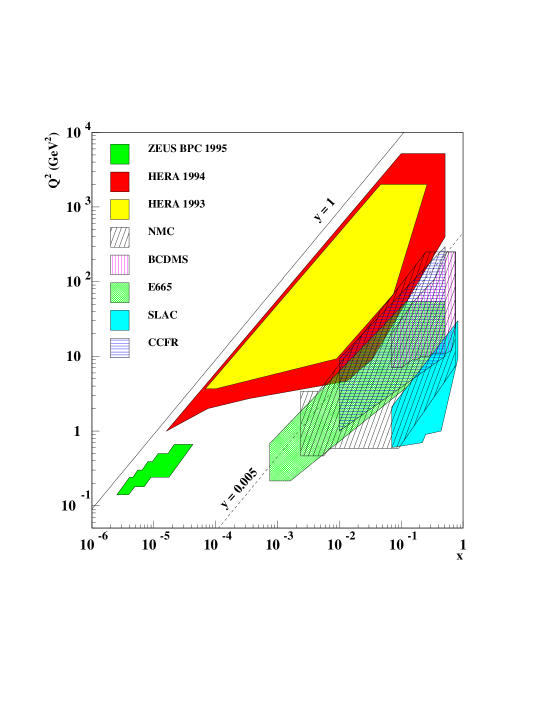
The new kinematical region covered by the HERA and fixed target data is shown in fig.1. The HERA data were collected in 1994 and represent a tenfold increase in statistics with respect to the 1993 data, allowing a significant extension of the covered region towards higher . A further extension towards higher was possible due to better methods of calculation of the kinematic variables from the hadronic final states. The improvement is due to using a mixture of the electron and hadron information, and momentum balance. For not too high the ZEUS data reach values as low as , hence the HERA data have now a small region of overlap with data from fixed target experiments. Such an overlap will be important for precise gluon density extractions. A substantial extension to smaller was achieved by shifting the interaction vertex for part of the time, by analysing events with a hard photon radiated in the initial state, and by improving the detector components around the beampipe. This allowed both H1 and ZEUS to reach values down to about GeV2.


1.1 Measurements of
The data from the HERA 1994 run, together with the published data from fixed target experiments, are shown in figs.2 and 3. Good agreement between the two HERA experiments is seen, as well as a smooth continuation from the fixed target data to the collider data. At fixed rises with decreasing down to the smallest values of , although the steepness of the rise is clearly seen to decrease with decreasing . Similarly at fixed rises with , the rise becoming steeper as decreases.
The evolution of the rise with may be demonstrated by parameterizing at fixed values. The result for as function of is shown in fig.4. The parameter clearly becomes smaller with decreasing (although the region in over which the function is fitted is reduced for each bin, which slightly enhances the effect).
These two rises, with decreasing (fig.2) and increasing (fig.3) may be neatly combined together: at large enough the data in the low region display the universal non-Regge rise from a flat boundary condition predicted by perturbative QCD. This is demonstrated in fig. 5, where the rescaled is shown as function of the two scaling variables
| (2) |
the rescaling factor is a simply calculable subasymptotic function, while . The measured slope of the rise with is , to be compared with the QCD prediction of for five active flavors. There exist other satisfactory parameterizations the data, but these do not predict the slope of the rise with and .
An excellent fit to the data may be achieved using the full NLO perturbative QCD evolution equations, with a fitted boundary condition, as demonstrated in figs.2 and 3. More details of such fits will be discussed in the next section. Models based on Regge phenomenology, but not including QCD evolution, generally undershoot the data even for the smallest values shown.
The increase in statistics means that it is possible to make significant differential measurements in the high region for the first time. The data are beginning to become sensitive to the valence and sea quark distributions, but it is as yet too early for significant measurements of . Combining the data on charged current interactions of both experiments a measurement on the propagator mass yields GeV, consistent with direct measurements at the proton-antiproton colliders. The large end of the spectrum for neutral current data is used to set limits on the effective scale for contact interactions. Depending on the sign of the interference term with the Standard Model interactions, 95% C.L. limits lead to lower limits of in the range 1.0-2.5 TeV.


First preliminary results were presented by ZEUS of data taken with a small calorimeter placed 3m downstream of the interaction point to accept electrons deflected under a very small angle. The kinematical region covered is GeV2 and . The data are shown in fig. 6 together with data from the muon experiment E665. The latter cover the region and GeV2. While the Regge inspired model predicts too low a cross section at low for values above 1 GeV2, the agreement in this region is much better. It thus appears that there is a transition from the perturbative region to the Regge region at GeV2. Future HERA data will cover this region and will thus bridge the two presently disjoint data samples.
New preliminary results on from muon-proton and muon-deuteron scattering have been shown by the NMC collaboration. The data taken with the small angle trigger in 1989 have been analysed, giving access to a lower and region than in previous NMC measurements. For incident muon beam energies of 200 and 280 GeV, scattered muons were detected with angles down to 6 mrad. The proton and deuteron structure functions were measured in the range from 0.0045 to 0.6 and the range of 0.5 to 75 GeV2. The for deuterons is shown in fig. 7 including the old and new datasets. The new NMC results compare very well with the E665 results. For the ratio of for neutrons to protons, the range covered extends to and GeV2. The dependence of this ratio shows slopes which are larger than expected from QCD at large , while there is essentially no dependence measured a small . The deuteron data show indications of a small amount of shadowing at small .
1.2 Measurements of
New preliminary data on have been presented from the neutrino experiment CCFR, from NMC and from H1. The CCFR data cover values of in the range for the range GeV2. The new data are in agreement with the SLAC fit through previous data. NMC has released new data on measured on proton and deuterium targets, for values in the range and GeV2. The systematic errors are preliminary around 0.1, flat in , and are dominated by the 0.15% normalization uncertainty between the two datasets. The difference - is consistent with zero.
Despite the availability of data on for below 0.1 from fixed target experiments, a substantial uncertainty still exists in the extrapolation of down to the low- region at HERA. Furthermore at small the quantity is a sensitive probe of the gluon density in the proton. Therefore measurements of at HERA are mandatory.
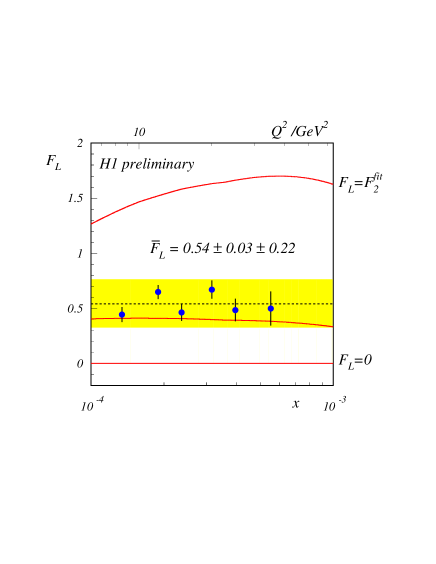
While can be measured at fixed target experiments by varying the incoming beam energy (which results in a variation of for fixed and in expression (1), no such opportunity exists so far at HERA. However a first glimpse of at small can be obtained by taking the measurement of in a region where the effect of is negligible (for example ), making a NLO QCD fit to these data, and then using the fit to extrapolate into the region of large (for example ). The comparison of the extrapolated value of with the experimentally measured cross section then gives a handle on . The result is shown in fig.8. For this determination the cross section measurement has been extended to . The value of is around 0.5 with a systematic error of about 0.2. The result is self-consistent, in the sense that it is compatible with the QCD prediction obtained using the gluon distribution found in the fit.
Future prospects for the measurement of at HERA by reducing the proton beam energy were also discussed. A precision of about 0.3 can be reached on using two beam energies (820 and 450 GeV) with the 1996 luminosity. The measurement is again limited by systematics.
1.3 Measurements of
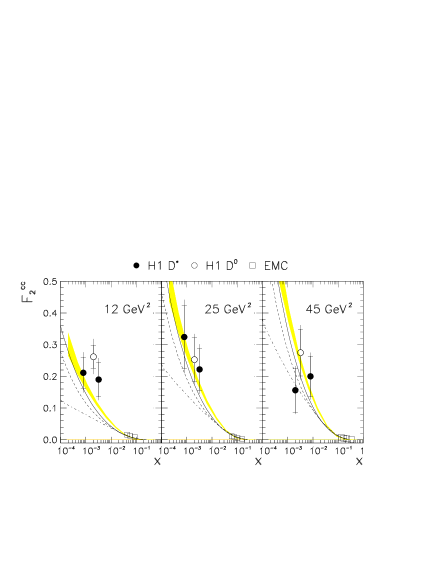
Also reported at this meeting were results on the charm contribution to , . H1 and ZEUS have shown that deep inelastic scattering events with charm can be tagged through the detection of and mesons. The decays and (and charge conjugate channels) have been analysed. H1 also demonstrated that the production mechanism for charm in DIS is compatible with photon-gluon fusion, the non-perturbative charm sea contribution being no more than a few per cent. Hence may be useful as a direct probe of the gluon density in the proton. The results of the measurements, assuming , both for and meson production, are displayed in fig. 9. The errors refer to the statistics and to the experimental systematics. These measurements extend previous knowledge of (from measurements by the EMC experiment ) towards smaller values of by two orders of magnitude. When combined with this earlier measurement a steep rise of is observed with decreasing . This is consistent with predictions from NLO fits.
2 Parton Distributions and the Strong Coupling
The success of conventional leading twist NLO perturbative QCD in describing all available structure function data with GeV2, even that at very small , means that we can use the data to extract input parton distributions (and in particular the gluon distribution) and the strong coupling constant. At this meeting new global fits were presented by both the CTEQ group (the CTEQ4 distributions) and the MRS group (the R distributions). While the CTEQ starting scale generally remains at GeV2, they have in the light of recent data also offered a distribution with GeV2; MRS have now reduced the starting scale of all their latest distributions from GeV2 to GeV2. Both groups now assume that at small the input singlet quark and gluon distributions behave as , respectively, the two parameters and being now fitted independently, rather than assumed to be equal. Note that these ‘effective powers’ must be interpreted with some care: their precise values are dependent on the form of the parameterization, on the choice of scheme (the data in fig.4 are by construction in DIS scheme, while the curve is in ) and the treatment of thresholds. Nonetheless, certain qualitative conclusions may be drawn: both powers increase with , in line with that extracted from the H1 data (see fig.4), and leading . At smaller scales however, somewhere between and GeV2, goes negative and the gluon becomes increasingly valence-like.
The soft (i.e. flat or valence-like) initial gluon found in these fits is of course perfectly consistent with the double asymptotic scaling seen in fig.5, since this characterizes the non-Regge rise generated dynamically in perturbative QCD by gluon bremsstrahlung from a flat input. It also accounts for the remarkable success of the GRV prediction of this rise, in which valence-like inputs were evolved from a very low scale GeV2: the shape of any rise generated dynamically from a valence-like input at a very low scale is universal (while its overall normalization, not calculable in perturbation theory, was fixed by GRV by comparison with prompt photon data, and imposition of the momentum sum rule).
The non-Regge rise of the parton distributions is actually slower than any power of , while faster than any power of , growing instead as a power of . In fact the data are not consistent with perturbative evolution from input distributions at large which rise as a power of , since the growth with of the slope of the rise is no longer reproduced (although in any particular bin it is not yet easy to distinguish between a power of and a power of ). It is thus useful to consider fits with alternative parameterizations of the small- input.

2.1 The Gluon
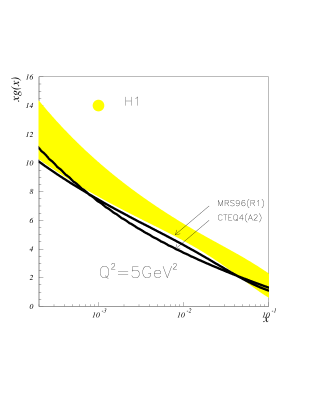
The gluon distribution at low is of particular interest, since it is this that drives the growth in the quark distribution. Although many less inclusive methods of determining the gluon have been proposed, the analysis of the scaling violations of remains the best method at small . Indeed the gluon is now fairly well determined since the data are so precise, the Bjorken scaling violations relatively large, and driven essentially by the steep rise in the gluon. The results of some of the various fits are compared in fig.10. The H1 fit, based on structure function data only (for details see ref. 4), also includes error bands derived from the statistics and experimental systematics. This error bands have been reduced with more than a factor two compared to the results based on earlier HERA data. Similar preliminary results became available from ZEUS. Note that the gluon gets steeper as is increased: as explained above this is only possible in perturbative QCD if it rises more slowly than a power of .
However, care must be taken as there is no unique way of extracting the gluon: besides depending on the choice of scheme and the value of , it also depends to some extent on the assumed parametrization at the input value and on the treatment of the charm threshold. Near threshold it seems necessary to use the boson gluon fusion mechanism for charm production rather than charm production via massless evolution. It is also difficult to ascertain the experimental and theoretical uncertainties. Recently the HERA experiments have provided a full error matrix of the systematic uncertainties in the data, which make a full error analysis on the gluon density possible. The two groups providing global fits to the data and extracting parton densities are strongly encouraged to take this information into account in the future.
2.2 Calculations of , , Direct Photons and Jet Rates
An equally clean but entirely independent determination of the gluon density could in principle be made from an accurate measurement of the longitudinal structure function . The results presented at this meeting are consistent with the gluon extracted from using NLO perturbative QCD (see fig.8), albeit with a large systematic error.
A measurement of the contribution to which arises from charm production, has also been advocated as a sensitive probe of the gluon density. It was shown recently that at small the NLO QCD predictions are stable, with scale variations of less than , and that they offer a rather local measurement of the gluon. The dominant uncertainty in the QCD calculations arises from non-perturbative effects conveniently expressed by the uncertainty in the charm quark mass. Although the present level of precision of the data does not yet allow yet the extraction of the gluon from the data, they are consistent with NLO perturbative calculations using gluons obtained from global fits (see fig.9).
The gluon distribution may also be determined from the jet rate measured at HERA, since a full NLO perturbative calculation of the partonic cross-section is now available. There is good agreement with gluon distributions found in global fits, the method being particularly useful in the intermediate range ().
Further information on the gluon distribution, especially at larger () can be extracted from the Tevatron collider data on direct photon and jet production. New measurements of the production of single isolated photons show good agreement with NLO QCD calculations for photons with a transverse energy larger than 30 GeV. At lower values the data overshoots theory, which can possibly be explained by extra generated by initial state parton showers. The CDF inclusive single jet cross section measurement shows a remarkable excess over theory for transverse momenta larger than 200 GeV. Some doubt has been cast on the assertion that it is not possible to absorb the excess by adjusting parton distributions at large : CTEQ have found a reasonable (if not optimal) fit to both CDF and BCDMS data, if one is ready to accept a somewhat less conventional shape for the gluon at high . No rise at high- is seen in the D0 data, which however have larger systematic errors in this region. The precise inclusive jet data at lower can however be used to give strong constraints on the gluon in the intermediate range, and CTEQ now include this data in some of their global fits.


2.3 The Strong Coupling
The success of conventional NLO perturbative QCD at small , both in accounting for the shape of and in consistently describing other observables driven by the gluon distribution, suggests that a determination of from HERA data may be possible. Furthermore, since the double scaling rise of depends strongly (and nonlinearly) on , but only weakly on the shape of the distributions at large , precise data on at small and large (say GeV2) provide an opportunity for a relatively clean measurement. The first such determination, using data from the 1993 run, gave a value
| (3) |
this is currently being updated using 1994 data. The statistical significance of the determination may be seen in the contour plots fig.11: with the new data, the experimental error is considerably reduced. Despite some initial scepticism, the result (3) has since been confirmed in global fits (see for example fig.12a). It is interesting because it is somewhat larger than the BCDMS result
| (4) |
but is instead closer to determinations made using time-like processes, such as the jet rate at HERA.
The CDF inclusive jet data with medium- (that is GeV) also seem to prefer the larger value of , although similar data from D0 now prefer lower values. The impact of the jet data on the value of in the CTEQ fits may be judged from fig.12b. MRS are now providing two sets of fits: R1 with and R2 with . R2 provides a significantly better fit to both the HERA data and the CDF inclusive jet data, while the fixed target structure function data generally prefer R1.
3 Higher Twists and Higher Logarithms
Before the advent of HERA data it was widely expected that the effects either of higher order logarithms of (summed to give the ‘hard pomeron’) or multiparton correlations (leading to ‘screening’ or ‘shadowing’) would be very important at small , and invalidate the use of conventional NLO perturbative QCD. At this meeting results were presented which put quantitative empirical constraints on the size of these effects, and explanations were put forward as to why they might be so small.
3.1 Higher Twists
The standard way of quantifying the effects of higher twists in deep inelastic cross sections is to rerun the perturbative NLO fits to the data using instead
| (5) |
an estimate of the size of the higher twist effects is then given by the size of fitted in various bins in . Fits to SLAC and BCDMS data show that at large is of order GeV2, but falls rapidly, becoming small and negative for (see fig.13). Recent fits to data follow the same pattern, while fits to the HERA data give GeV2 for .

The numbers obtained in all these estimates must be treated with caution: twist-4 contributions will not evolve with in precisely the same way as the leading twist contribution, and leading twist evolution is difficult to compute reliably in the vicinity of the charm threshold. However, it seems that except at large the characteristic scale for higher twist effects is no more than a few hundred MeV, and may indeed be much smaller. This is entirely consistent with theoretical estimates of higher twist effects in nonsinglet channels based on renormalons. Such calculations also suggest that twist-6 contributions to structure functions are also very small at small . In fact at presently obtainable energies no ‘unitarization’ corrections are necessary since the inelastic cross-section is always far below any reasonable unitarity bound.
Of course at sufficiently small conventional perturbation theory must eventually break down for all values of , since in order to maintain finiteness of the cross-section , as . However there is as yet no quantitative theory of inelastic lepton-proton scattering at low . Fits to low data generally have two ingredients: the dependence given by Regge theory (with a pomeron intercept of ) and the dependence given by a combination of vector meson dominance and the photo-production limit. Such parameterizations give a satisfactory account of the new ZEUS data for GeV2(see fig.6). The fit to the data can be maintained above GeV2 only if the pomeron intercept is allowed to rise with : some groups claim to be able to calculate this rise non-perturbatively, while others use a parameterization based on the rise expected from perturbative QCD.
3.2 BFKL Logarithms
At small one might expect conventional perturbation theory to eventually break down, even when is large enough for to be small, due to large logarithms of . Naively one expects at -loops terms of the form , but for the sufficiently inclusive quantities, such as the singlet component of , these double logarithms cancel to all orders. Single logarithms, of the form , remain however. At fixed coupling they may be summed up using the BFKL equation to give a gluon distribution which rises as in the Regge limit, with . However this behaviour is far too singular to be compatible with HERA structure function data; as explained above, a steep power-like rise would spoil double scaling. Recent fits now deliver a flat or valence-like input gluon (see for example fig.4).
Many explanations have been put forward for the absence of the perturbative pomeron in inclusive quantities. In particular it is often said that since at present only leading order logarithms can be included, the as yet unknown subleading effects might somehow reduce the rate of the rise. Another major source of uncertainty are the contributions from the small- region; the overall normalization of the perturbative rise is rather sensitive to the value of an infrared cutoff, and phenomenological studies of the perturbative contribution to the total cross-section suggest that it is completely swamped by the soft contribution. Nonetheless, the Lipatov approach, or some development thereof, remains at present our only hope of actually being able to compute the behaviour of structure functions in the Regge limit. Considerable effort has been put into numerical solutions of modified BFKL or CCFM equations, with some success in obtaining reasonable fits to HERA data.
A less ambitious way of including the higher order logarithms is to observe that at large we can project out the leading logarithmic component of the BFKL equation, retaining only an infinite (but convergent) series of contributions to the perturbative splitting function. Factorization of infrared singularities is accomplished by the -factorization theorem, a generalization of the more usual mass-factorization, and likewise proven formally to all orders in perturbation theory. The effect of the higher logarithms is then interpreted not as a prediction of the form of the input distribution, but as a systematic modification of the subsequent perturbative evolution with , and as such can be searched for in the data.
There are several reasons why the resulting effects turn out to be
small:
In the gluon channel the coefficients of the LO logarithms of
happen to vanish at , and
, and the remaining coefficients turn out to be rather
small. However, although in the quark channel the splitting
functions only begin at NLO in logarithms of , their
coefficients are relatively large. Presumably the same is true at NLO
in the gluon channel, although as yet these subleading terms have not been
calculated.
When runs with , the effect of
the higher logarithms dies away as increases, and is thus
concentrated in a narrow wedge at small and low .
Much of the effect of the higher logarithms may be absorbed in
the initial condition: this is the essence of factorization. When comparing
calculations using different perturbative expansions it is thus essential to
refit the boundary condition: calculations which simply evolve from a
fixed boundary condition inevitably over-estimate the
effect of the higher-order logarithms.
Although the LO logarithms are scheme independent, the size
of the NLO logarithms depends on the choice of factorization scheme.
A universal (i.e. process-independent) reduction in the size of all NLO
logarithms may be made by absorbing the (singular) gluon normalization
factor into the input distribution. Furthermore, it is possible
to find a scheme in which the NLO logarithms in the quark channel
vanish. Alternatively, one can argue for the adoption of a
‘physical’ scheme in which quarks and gluons are directly
identified with and at small : the NLO logarithms are then
non-zero, but relatively small.
Subleading logarithms may be chosen in various ad hoc ways in order
to impose momentum conservation by hand. In fact it is
possible to choose a particular
class of factorization schemes in which momentum is conserved at
NLO, fixing completely the NLO logarithms in the gluon channel
in terms of those in the quark channel. Momentum conservation
generally reduces the subasymptotic effect of the logarithms,
since the subleading terms subtract from the leading.
Retaining the higher order logarithms in the large- region
is clearly meaningless: splitting functions at more than two loops will
only be well approximated by their leading approximation
when is small. It is thus important to only include the higher
loop contributions when , with a suitable (but essentially
unknown) parameter.
In practice this may be done by replacing
by in all
terms beyond two loops, thereby ensuring continuity at .
As the
effect of the higher order logarithms is then reduced systematically to zero:
the empirically determined value of thus gives a useful
parameterization of the
constraints put on the size of the logarithms by the HERA data.


The first calculations including higher-order logarithms in which all these considerations were properly taken into account found that with the 1993 HERA data excellent fits could be achieved at NLO with in all schemes, while values of as large as unity were acceptable only when LO logarithms are summed, or in NLO schemes where the NLO logarithms are suppressed. However it was also noted that there were large scheme dependent fluctuations at small and low . Since the 1994 data, besides being much more precise than the 1993 data, also explore this region, they are much more sensitive to the effects of the higher-order logarithms. It turns out that the new data effectively exclude such logarithms: in each scheme the best fit to the data is obtained as , and in the complete NLO calculations a reasonable fit is only obtained when is unnaturally small (see fig.14).
It should also be noted that the NLO logarithms in the quark channel would lead to a suppression of the gluon distribution extracted from at small by a factor of around two, and thus to a corresponding suppression of both and as compared to the two loop expectation. No such suppression is seen in the data, which if anything lie a little above the two loop predictions (see figs.8 and 9, also ref.72).
In our opinion a completely satisfactory explanation for the apparent absence of these contributions to perturbative evolution at small has not yet been put forward.
3.3 Other Logarithms
The cancellation of the double logarithms in the singlet component of , and does not occur for either nonsinglet components of or indeed for nonsinglet or singlet contributions to the polarized structure function . When the double logarithms are naively incorporated into the evolution equations in the same way as the single logarithms were above, large effects at small can be generated dynamically from flat or valence-like inputs: for example grows so rapidly that its first moment apparently diverges. However it would be premature to take these predictions at face value. As yet there is no -factorization theorem when the double logarithms are uncancelled, and it is not even clear whether it might eventually be possible to prove one. A better understanding of double logarithms will probably require first a true understanding of single logarithms.
In this connection, it should also be noted that in many less inclusive quantities, and in particular observables related to jets, the double logarithms are also uncancelled.
All the logarithms discussed so far are ultraviolet logarithms, in the sense that they only become important at high energies. At lower energies infrared logarithms can be more important. This applies particularly to the evolution of structure functions at large , where it becomes necessary to consider terms of the form . Such terms might be important in the determination of from fixed target data, in the interpretation of high- inclusive jet rate as measured by CDF (through the comparison with evolved fixed target data), and in the evolution of the pomeron structure function (since the gluon distribution in the pomeron seems to be very strongly peaked at large ).
Consider the theoretical error quoted in the determinations (3) and (4) of . In both cases the dominant contribution to the theoretical errors comes from a crude estimate of NNLO corrections based on a variation of the renormalization and factorization scales in the range . The error in the small determination (3) also includes an error from the effect of the logarithms of (though we now know empirically that the effect of such logarithms is very small): the corresponding determination of the error in the large result (4) due to infrared logarithms has yet to be made.
There are several indications that the effects of infrared logarithms on the analysis of fixed target data at large may be much more greater than is usually supposed. Firstly, when the cut on the BCDMS data is raised from GeV2 to GeV2, the value of increases substantially. Secondly, for first moment sum rules such as the Gross–Llewellyn-Smith sum rule, which obtain their dominant contribution from the large region, the NNLO correction is known to be as large as of the NLO, while the NNNLO correction is as large as . All of these corrections have the same sign. Thirdly, higher twist corrections, which in the renormalon approach are considered to be directly related to the size of higher order corrections, are strongly peaked at large (see fig.13).
A calculation of the three loop splitting function would go some way towards settling this issue: partial results in the nonsinglet channel, which may prove useful for error estimation, have been presented recently.
4 Conclusions
There has been considerable progress in both the range and precision of structure function data over the last year: in particular the 1994 data on are now final, there are new data at low and , and new measurements of and . These data have reinforced the main conclusion of the Paris meeting, namely that conventional NLO perturbative QCD works remarkably well for GeV2, matching smoothly onto Regge expectations below this value. The gluon distribution is now determined with an uncertainty of around for down to .
However there is now definite, though admittedly inconclusive, evidence that collider structure function data prefer a higher value of the strong coupling than fixed target data, more in keeping with high energy determinations from machines. Moreover the tight constraints the new data place on both higher twists and, perhaps more surprisingly, on higher logarithms of at small suggest that perturbative evolution at high energies is still not yet completely understood. The new data are a continuing inspiration to theorists searching for a deeper understanding of perturbative QCD.
Acknowledgments
We would like to thank all the contributors to our working group for their presentations and participation in the lively and stimulating discussions, Robin Devenish for co-organizing this session, Stefano Forte for a careful reading of the final manuscript, and Giulio D’Agostini and his team for their excellent organization of the conference.
References
References
- [1] Proceedings of “DIS 95”, J. F.Laporte and Y.Sirois eds., (Ecole Polytechnique, 1995).
- [2] U. Bassler, these proceedings.
- [3] P. Kooijman, these proceedings.
- [4] H1 Collaboration, Nucl. Phys. B470, 3 (1996).
- [5] Zeus Collaboration, Zeit. Phys. C69, 607 (1996); preprint DESY 96-076, hep-ex/9607002.
- [6] NMC Collaboration, M. Arneodo et al., Phys. Lett. B364, 107 (1995).
- [7] BCDMS Collaboration, A.C. Benvenuti et al., Phys. Lett. B223, 485 (1989);CERN preprint CERN-EP/89-06.
-
[8]
E665 collaboration, M. R. Adams Phys. Rev. D54, 3006 (1996);
T. Carrol these proceedings. - [9] L. W. Withlow, PhD thesis, SLAC-357 (1990).
- [10] A. De Rújula et al., Phys. Rev. 10, 1649 (1974).
- [11] R.D. Ball and S. Forte, Phys. Lett. B335, 77 (1994); B336, 77 (1994).
- [12] R.D. Ball and S. Forte, Acta Phys. Pol. B26, 2097 (1995).
- [13] W. Buchmuller and D. Haidt, hep-ph/9605428, and in these proceedings.
- [14] Th. Naumann, these proceedings.
- [15] D. Williams , these proceedings.
- [16] F. Pieuchot, these proceedings
- [17] Y. Zhu, these proceedings.
- [18] A. Donnachie and P.V. Landshoff, Phys. Lett. B296, 227 (1992).
- [19] M. Glück, E. Reya and A. Vogt, Zeit. Phys. C67, 433 (1995).
- [20] E. Kabuss, these proceedings
- [21] A. Bodek, these proceedings.
- [22] A. Milzstajn, these proceedings.
- [23] M. Klein, these proceedings.
- [24] L. Bauerdick, these proceedings.
- [25] K. Daum, these proceedings
- [26] R. Graciani, these proceedings.
- [27] EMC collaboration, J.J. Aubert et al.,Nucl. Phys. B231, 31 (1983).
- [28] W-K. Tung et al, hep-ph/9606399, and hep-ph 9608293, in these proceedings.
- [29] R.G. Roberts et al, hep-ph/9606345, and in these proceedings.
- [30] S. Forte and R.D. Ball, hep-ph/9607291, in these proceedings.
- [31] M. Glück et al., Nucl. Phys. B (Proc. Suppl.) 18C, 49 (1991).
- [32] J. Chýla, these proceedings.
- [33] A. Vogt, in ref.1.
- [34] A.D. Martin and R.C.E. Devenish, these proceedings, and ref. therein.
- [35] F. Zomer, these proceedings.
- [36] V. Barone, these proceedings.
- [37] A. Vogt, these proceedings.
- [38] K. Rosenbauer, these proceedings.
- [39] J. Repond, these proceedings.
- [40] D. Graudenz, Phys. Rev. D49, 3291 (1994).
- [41] E. Mirkes, these proceedings.
- [42] S. Linn, these proceedings.
- [43] C. Pagliarone, these proceedings.
- [44] R.D. Ball and S. Forte, hep-ph/9505388, in the proceedings of the XXXth Rencontres de Moriond, Les Arcs, March 1995.
- [45] R.D. Ball and S. Forte, Phys. Lett. B358, 365 (1995).
- [46] R.D. Ball and S. Forte, hep-ph/9607289, in these proceedings.
- [47] A.D. Martin et al, Phys. Lett. B354, 155 (1995).
- [48] M. Virchaux and A. Milsztajn, Phys. Lett. B274, 221 (1992).
-
[49]
T. Ahmed et al, Phys. Lett. B346, 415 (1995);
M. Derrick et al, Phys. Lett. B363, 201 (1995) - [50] W.T. Giele et al, Phys. Rev. D53, 120 (1996).
- [51] A.D. Martin et al, Phys. Lett. B354, 155 (1995).
- [52] Proceedings of the 1992 HERA Workshop, ‘Physics at HERA’, W. Buchmüller and G. Ingelmann, eds. (Hamburg 1992).
- [53] A.V. Sidorov, hep-ph/9607275.
- [54] B.R. Webber, hep-ph/9607441, in these proceedings.
- [55] A. Levy, these proceedings, and ref. therein.
- [56] L.N. Lipatov, these proceedings, and ref. therein.
- [57] P.V. Landshoff, hep-ph/9605331, in these proceedings.
- [58] A.D. Martin, these proceedings, and ref. therein.
- [59] C. Royon, these proceedings.
- [60] T. Jaroszewicz, Phys. Lett. B116, 291 (1982).
-
[61]
S. Catani and F. Hautmann,
Phys. Lett. B315, 157 (1993);
Nucl. Phys. B427, 475 (1994); hep-ph/9406325. - [62] S. Catani, hep-ph/9608310, in these proceedings.
- [63] R.K. Ellis et al, Nucl. Phys. B420, 517 (1994).
- [64] R.D. Ball and S. Forte, Phys. Lett. B351, 313 (1995).
- [65] R.K. Ellis et al, Phys. Lett. B356, 79 (1995).
- [66] J. Blümlein et al, these proceedings.
- [67] M. Ciafaloni, Phys. Lett. B356, 74 (1995); hep-th 9510025.
- [68] S. Catani, Zeit. Phys. C70, 263 (1996).
- [69] R.D. Ball and S. Forte, Phys. Lett. B359, 362 (1995).
- [70] S. Forte and R.D. Ball, hep-ph/9507211, in ref.1.
- [71] J. Forshaw et al, Phys. Lett. B356, 79 (1995).
- [72] R.S. Thorne, these proceedings.
- [73] A. Kotikov, these proceedings.
- [74] R. Kirschner and L.N. Lipatov, Nucl. Phys. B213, 122 (1983).
- [75] B. Ermolaev et al, Zeit. Phys. C69, 259 (1996), C70, 273 (1996), and in these proceedings.
- [76] G. Marchesini, these proceedings, and ref. therein.
- [77] P.R. Newman, these proceedings.
- [78] S.A. Larin and J.A.M Vermaseren, Phys. Lett. B259, 345 (1991).
-
[79]
S.A. Larin et al, Nucl. Phys. B427, 41 (1994);
hep-ph/9605317;
A.L. Kataev et al, hep-ph/9605367.