BABAR status and prospects for asymmetry measurements:
S. Ganzhur
ganzhur@cea.frDSM/Dapnia, CEA/Saclay, F-91191 Gif-sur-Yvette, France
Abstract
The recent experimental results on violation related to the angles of the
Cabibbo-Kobayashi-Maskawa (CKM) unitarity triangle
are summarized in these proceedings. These results are obtained with approximately
million events collected with the BABAR detector at the PEP-II asymmetric-energy
-factory at SLAC. Using the measurements on time-dependent asymmetries in
and decays and theoretical assumptions,
one finds at confidence level.
The perspectives of measurement with
and decay
channels are also discussed.
Introductoin
A crucial part of the violation program in -factories is the measurement of the angle
of the unitary triangle related to the CKM matrix bib:KM .
Decays of mesons that allows one to constraint the
CKM angle , have either small asymmetry ()
or small branching fractions ().
This makes the violation effect hard to measure. Furthermore,
due to presence of two hadronic parameters in the observables ( and , the amplitude ratio and
the strong phase difference between two amplitudes) it is difficult to cleanly extract
the weak phase information, although approaches based on SU(3) symmetry exists.
I The BABAR detector and dataset
The data used in the presented analyzes were recorded with the BABAR detector at the PEP-II asymmetric-energy storage rings, and consist of 211 fb-1
collected on the resonance (on-resonance
sample), and 21 fb-1 collected at an center-of-mass (CM)
energy approximately 40 below the resonance peak
(off-resonance sample). This corresponds to approximately million recorded events.
The BABAR detector is described in detail in Ref. ref:babar .
II asymmetry in decays
The decay modes have been
proposed to measure
ref:sin2bg_th .
In the Standard Model the decays
and
proceed through the and
amplitudes and , respectively.
The relative weak phase between these two amplitudes
is . When combined with mixing, this yields a weak phase
difference of between the interfering amplitudes.
The decay rate distribution for
is
(1)
where is the lifetime averaged over the two mass eigenstates,
is the mixing frequency, and
is the difference between the time
of the ()
decay and the decay of the other
() in the event. The
upper (lower) sign in Eq. 1
indicates the flavor of the as a (),
while () and () for
the final state ().
The parameters and are given by
(2)
Here is the strong phase difference
between and and .
Since is doubly CKM-suppressed with respect
to , one expects to be small of order 2%.
Due to the small value of , large data samples
are required for a statistically significant measurement of .
Since the expected asymmetry in the selected
decays is small, this measurement is sensitive to the interference between the
and amplitudes in the decay of .
To account for this “tagside interference”, we use a parametrization
which is described in Ref. ref:abc . The coefficient are replaced with three
others
(3)
For each tagging category, independent of the decay mode ,
the tagside interference is parametrized in terms of the
effective parameters and . One notes, for the lepton tagging category.
Two different analysis techniques, full reconstruction ref:run1-2-breco
and partial reconstruction ref:run1-2-ihbd were used for
the measurement with .
The full reconstruction technique is used to measure the asymmetry in
and
decays ref:full-reco . From a time-dependent maximum likelihood fit
the following parameters related to the violation angle
are obtained:
(4)
where the first error is statistical and the second is systematic.
The systematic error for includes the maximum bias of
asymmetry parameters due to possible dependence of on the invariant mass.
For the measurement of parameter only the lepton-tagged events are used due to
a presence of tag-side violation effect ref:abc .
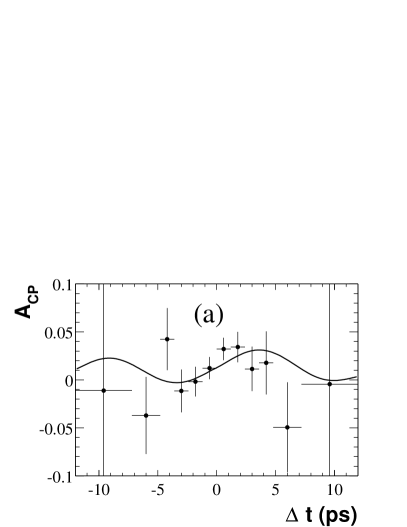
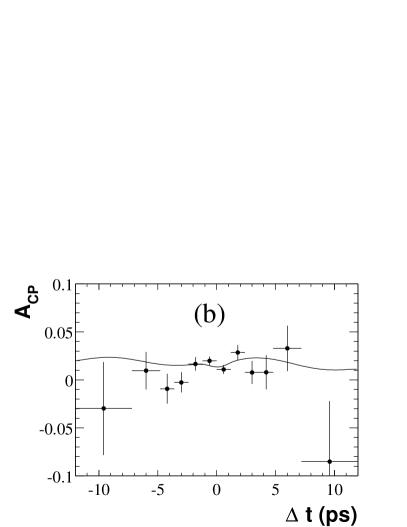
Figure 1: Raw asymmetry for (a) lepton-tagged and (b) kaon-tagged
events of decay mode using the method of the partial reconstruction.
The curves represent the projections of the PDF for the raw
asymmetry.
In the partial reconstruction of a candidate,
only the hard (high-momentum) pion track from the decay and the
soft (low-momentum) pion track from the decay
are used.
Applying kinematic constraints consistent with the signal decay mode,
the four-momentum of the non-reconstructed, “missing”
is calculated. Signal events are peaked
in the distribution at the nominal mass.
This method eliminates the efficiency loss associated with the
neutral meson reconstruction. The asymmetry independent
on the assumption on measured with this technique is ref:part-reco
(5)
where the first error is statistical and the second is systematic.
This measurement deviates from zero by 2.0 standard deviations.
Figure 1 shows the raw, time-dependent asymmetry
(6)
In the absence of background and with high statistics, perfect tagging, and
perfect measurement, would be a sinusoidal
oscillation with amplitude .
Two methods for interpreting these results in terms of
constraints on are used.
Both methods involve minimizing a
function that is symmetric under the exchange , and applying the method of Ref. ref:Feldman .
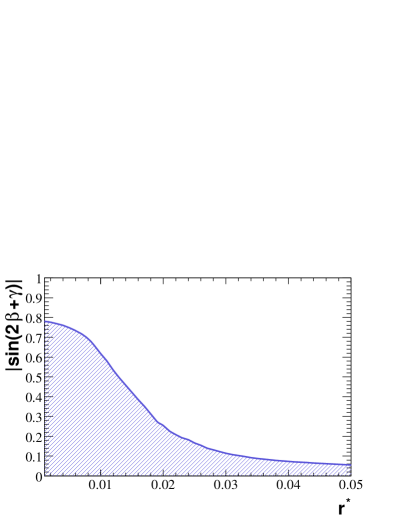
In the first interpretation method, no assumption regarding the value of is made.
The resulting 95% lower limit for the mode is shown as a function of in
Figure 2.
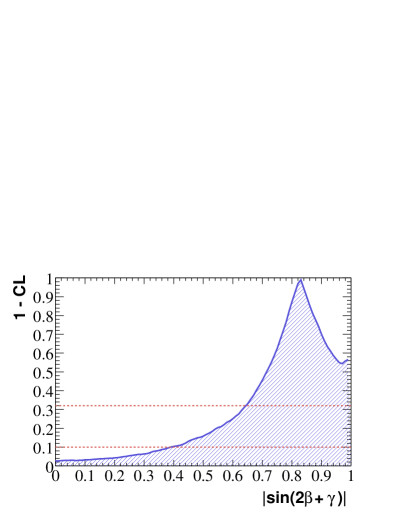
The second interpretation assumes that can be estimated from the
Cabibbo angle, the ratio of branching fractions , and the ratio of decay constants
.
The confidence level as a function of is shown in Figure 3.
This method yields the lower limits at C.L.
Figure 2: Lower limit on a
t 90% CL as a function of , for .
Figure 3: The shaded region denotes the allowed range of
for each confidence level. The horizontal lines show, from top
to bottom, the 68% and 90% CL.
III decays
The decay modes have been proposed for determination
of from measurement of time-dependent asymmetries ref:th-dst0k0 .
In the Standard Model the decays of and mesons into final state
proceed through the and amplitudes, respectively.
Due to relatively large asymmetry
()
these decay channels look very attractive for such a measurement. Since the parameter
can be measured with sufficient data sample by fitting the coefficient in time distributions,
the measured asymmetry can be interpreted in terms of without additional assumptions.
However, the branching fractions of such decays are relatively small ().
That is way the large data sample is still required.
From the measured signal yields ref:dst0kst0 , we find
(7)
where the uncertainties are statistical and systematic, respectively.
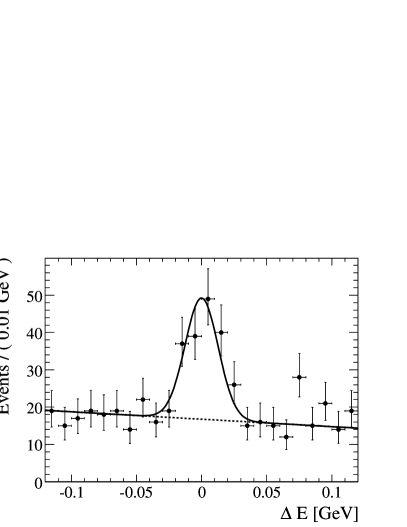
Figure 4 shows the distributions of
candidates with for the
sums of the reconstructed decay modes.
Figure 4:
Distribution of for a) , b)
, c) , and d)
candidates with . The
points are the data, the solid curve is the projection of the likelihood fit, and
the dashed curve represents the background component.
The decay dynamics can modify
the expectation for the ratio . The magnitude of this ratio can be probed by measuring
the rate for the decays and
using the self-tagging decay .
The and decays are distinguished by the
correlation between the charges of the kaons produced in the
decays of the neutral and the .
This charge correlation in the final state is diluted by the presence of the
doubly-Cabibbo-suppressed decays
, and .
The ratio is related to the experimental observable defined for the decay as
(8)
where
(9)
(10)
and and are strong phase differences between the two and
decay amplitudes, respectively.
From the measured branching fractions (Eq. 7), values of bib:PDG2004 and Eq. 8,
one obtains at the 90% C.L. To conclude, the present signal yields combined with this limit on suggest that
a substantially larger data sample is needed for a competitive
time-dependent measurement of in decays.
IV decays
Recently it was proposed to consider the decays
for measurement of ref:th-dsta0_a2 .
The decay amplitudes of mesons to light scalar or tensor mesons such as or ,
emitted from a weak current, are significantly suppressed due to the small decay constants .
Thus, the absolute value of the CKM-suppressed and favored amplitudes become comparable. As a result, the
asymmetry in such decays is expected to be large. However, the theoretical predictions of the branching
fractions for is expected of the order of
ref:br-dsta0_a2 . The main uncertainty in the branching fractions
of these decay modes is due to unknown transition form factors.
One way to verify the expectations and test a validity of the factorization approach is to measure the branching
fractions for the more abundant decay modes .
Using a sample of about 230 million no evidence for these decays were observed ref:dsa .
This allowed one to set upper limits at 90% C.L. on the branching fractions to be
(11)
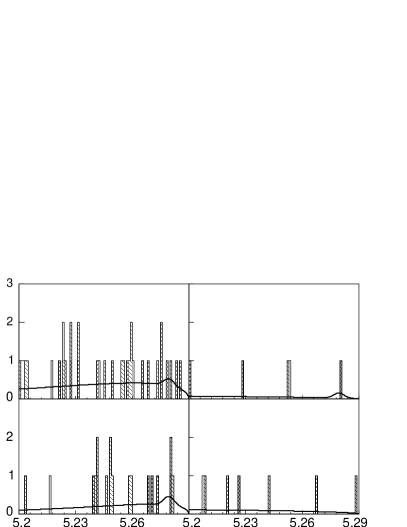
Figure 5 shows the distributions for the reconstructed candidates
, ,
and . For each decay mode, an
unbinned maximum-likelihood fit is performed
using the candidates from the three decay modes.
Figure 5:
Distributions of for a) ,
b) , c) ,
d) candidates
overlaid with the projection of the maximum likelihood
fit. Contributions from the three decay modes
are shown with different hatching styles: is cross hatched,
is hatched, and is white.
The upper limit value for
is lower than the theoretical expectation,
which might indicate the need to revisit the transition
form factor estimate. It might also imply the limited applicability
of the factorization approach for this decay mode.
The measured upper limits suggest that the branching ratios of
are too small for -asymmetry measurements given the present
statistics of the -factories.
The measurement of in
decays is an interesting program for the future experiments such as Super-factories.
Conclusion
The substantial constraint on the CKM angles comes from
the measurements of time-dependent asymmetry in the and decays.
The BABAR experiment has used two techniques such as full and partial reconstruction to increase the signal yields in the
channel. The combined BABARand BELLE results ref:belle-dstpi
for violation in the most precisely measured decay channel is
(12)
This measurement performed at the level of one per cent deviates from zero by 3.4 standard deviations.
Future updates are therefore of a great interest.
We interpret the BABAR result in terms of and find at C.L.
using a frequentist method.
The BABAR experiment has measured the branching fractions of
and set up the limit on decays.
The present signal yields and established limits suggest that
a substantially larger data sample is needed for a competitive
time-dependent measurement of with these decay channels.
References
(1)
M. Kobayashi and T. Maskawa, Prog. Theor. Phys. 49, 652 (1973).
(2)BABAR Collaboration, B. Aubert et al.,
Nucl. Instrum. Meth. A 479, 1 (2002).
(3)
R.G. Sachs, Enrico Fermi Institute Report,
EFI-85-22 (1985) (unpublished);
I. Dunietz and R.G. Sachs, Phys. Rev. D37, 3186 (1988)
[E: Phys. Rev. D39, 3515 (1989)];
I. Dunietz, Phys. Lett. B427, 179 (1998);
P.F. Harrison and H.R. Quinn, ed.,
“The BABAR Physics Book”, SLAC-R-504 (1998), Chap. 7.6.
(4) O. Long,
M. Baak, R.N. Cahn, and D. Kirkby,
Phys. Rev. D 68, 034010 (2003).
(5)BABAR Collaboration, B. Aubert et al.,
Phys. Rev. Lett. 92, 251801 (2004).
(6)BABARCollaboration, B. Aubert et al.,
Phys. Rev. Lett. 92, 251802 (2004).
(7)BABAR Collaboration, B. Aubert et al.,
Phys. Rev. D 73, 111101 (2006).
(8)BABARCollaboration, B. Aubert et al.,
Phys. Rev. D 71, 112003 (2005).
(9) G. Feldman and R. Cousins, Phys. Rev. D 57,
3873 (1998).
(10)
M. Gronau and D. London, Phys. Lett. B 253, 483 (1991); D. Atwood, I. Dunietz, and A. Soni, Phys. Rev. Lett. 78, 3257 (1997);
B. Kayser and D. London, Phys. Rev. D 61, 116013 (2000); A.I.Sandra, hep-ph/0108031.
(11)BABAR Collaboration, B. Aubert et al., Phys. Rev. D 74 031101 (2006)
(12)
Particle Data Group, S. Eidelman et al., Phys. Lett. B 592 1 2004 .
(13)
M. Diehl, G. Hiller, Phys. Lett. B 517, 125 (2001).
(14)
M. Diehl, G. Hiller, “New ways to explore factorization in decays”, hep-ph/0105194
(15)BABAR Collaboration, B. Aubert et al., Phys. Rev. D 73 071103 (2006)
(16)BELLE Collaboration, F.J. Ronga et al.,
Phys. Rev. D 73, 092003 (2006).