The impact of new neutrino DIS and Drell-Yan data
on large- parton distributions
Abstract
New data sets have recently become available for neutrino and antineutrino deep inelastic scattering on nuclear targets and for inclusive dimuon production in interactions. These data sets are sensitive to different combinations of parton distribution functions in the large- region and, therefore, provide different constraints when incorporated into global parton distribution function fits. We compare and contrast the effects of these new data on parton distribution fits, with special emphasis on the effects at large . The effects of the use of nuclear targets in the neutrino and antineutrino data sets are also investigated.
I Introduction
Global fits have long been used in the determination of parton distribution functions (PDFs). By considering a variety of observables, one is sensitive to different combinations of PDFs. In this way it has been possible to place constraints on many of the different types of PDFs in the nucleon. In particular, deep inelastic scattering with various leptonic beams on nucleon targets and dilepton production in hadron-hadron interactions have both played essential roles in the determination of nucleon PDFs.
New data sets from the NuTeV nutev and Chorus chorus Collaborations for neutrino and antineutrino interactions on iron and lead targets, respectively, have recently become available. In addition, the E866 Collaboration e866 has released new data sets for inclusive dimuon production in interactions. These lepton-hadron and hadron-hadron cross sections are sensitive to quite different combinations of PDFs and, therefore they will provide significantly different types of constraints when incorporated into a global fit.
It is the purpose of this paper to present the results of a series of global fits that examine the impact of the new data sets when they are included individually and in combination with a representative sample of data for a wide variety of hard-scattering processes.
The use of nuclear targets for the neutrino and antineutrino data sets complicates the extraction of nucleon PDFs. Model-dependent corrections must be used to deduce the nucleon PDFs in such cases. The effects of these nuclear corrections are examined in the course of performing the various globals fits.
The outline of the paper is as follows. In the next section the various theoretical tools used in the global fits are described along with the models used for the nuclear target corrections. The methodology used and the choices of data sets and kinematic cuts are also presented. In Sec. III the details of the individual fits are presented and the role of nuclear corrections is discussed in Sec. IV. A strategy to reduce the model dependence for the ratio is discussed in Sec. V and Sec. VI contains a summary of our conclusions.
II Theoretical and experimental input
The primary goal of this analysis is to assess the impact of new DIS neutrino and antineutrino data and new hadronic pair production data on the PDFs in the large- region. Accordingly, it will be useful to examine which combinations of PDFs these data sets are sensitive to.
When using an isoscalar target, both the neutrino and antineutrino charged current cross sections at large values of are proportional to the combination
| (1) |
whereas muon or electron neutral current structure functions on proton or deuteron targets are sensitive to the combinations
| (2) |
and
| (3) |
Thus, the heavy target charged current neutrino data and the deuterium muon neutral current data are both sensitive to the same combination of PDFs in the large- region.
This situation may be contrasted to that for dilepton production in hadron-hadron collisions. The difference is most easily illustrated by considering the kinematics for the production at a center-of-mass energy of a lepton pair of mass and longitudinal momentum fraction using the lowest order process, for which one has
| (4) |
For large values of the momentum fraction for the beam parton approaches while that for the target parton approaches . For the kinematics of fixed-target experiments, one sees that for large there is relatively little variation of and it is typically rather small. Conversely, varies over a significant range of values in the large- region. Therefore, one has approximately
| (5) |
whereas, due to the isoscalar nature of the deuteron target,
| (6) |
Thus, the large lepton pair data are sensitive to the same combination of large- PDFs as the proton target neutral current DIS cross section data. Furthermore, the large- charged current neutrino data and the large lepton pair production data are sensitive to different combinations of PDFs. This point will be important for understanding the results of the fits to be presented in the next section.
All of the fits described in this analysis were done using next-to-leading-order evolution in the scheme. The parametrization chosen for the different flavors is identical to that used in the CTEQ6M cteq6m and CTEQ6.1M cteq61m global fits. For data taken on deuteron targets, nuclear corrections were included using a model-dependent estimate for the ratio from gomez where are the structure functions for deuteron and isoscalar targets, respectively. A simple parametrization was fitted to the extracted values of this ratio as given in Table X in gomez and is included in the Appendix. For the heavy targets used in the neutrino and antineutrino data sets, the effects of nuclear corrections were included by using the Kulagin-Petti parametrizations from Ref. kp for iron and lead targets in the case of the NuTeV and Chorus data sets, respectively.
The basic impetus for this analysis originated with the observation that the NuTeV data were expected to pull the valence distributions upward in the region of large whereas the E-866 data indicated that the valence distributions at large values of were already too high in the CTEQ6 PDFs. The NuTeV data resulted from a follow-on experiment to that of the CCFR Collaboration ccfr . The results in the large- region are significantly higher than those for CCFR in the -bins at 0.55, 0.65, and 0.75. The origin of this discrepancy is now understood by both groups and the NuTeV data set is believed to be the more reliable of the two. Since the CCFR data were included in the global fits used to determine CTEQ6M and CTEQ6.1M PDFs, replacing the CCFR data by those from NuTeV may well have a significant impact on the PDF determination in the large- region. However, the situation is made more complex by the question of what nuclear corrections to use. The previous CTEQ fits which used the CCFR data included nuclear corrections that were based on measurements of in charged lepton neutral current processes. The results of Ref. kp suggest that the corrections for charged current neutrino interactions may differ from these. Indeed, the issue of how large the nuclear corrections are at large in neutrino interactions is model dependent at this time. Therefore, it was decided to make a new reference fit starting with the CTEQ6.1M PDFs and removing the CCFR data, while incorporating corrections for deuteron targets where appropriate. This latter correction has not been included in previous CTEQ fits. Furthermore, to better account for effects due to heavy quarks, the ACOT scheme acot has been implemented. This primarily affects the low- region for neutrino induced processes and so is somewhat secondary to the results to be presented below. In addition, target mass corrections have also been included in all the fits.
The NuTeV data nutev used in this analysis consist of measurements of the cross sections for neutrino inclusive DIS (1170 data points) and antineutrino inclusive DIS (966 data points). These data have been corrected for electromagnetic radiative corrections using factors supplied by the NuTeV collaboration. The data have seven sources of correlated systematic errors in addition to a statistical error. The NuTeV collaboration has published the correlated errors, which we use in our fitting procedure in the manner described previously for the CTEQ6 PDFs cteq6m . Similarly, the Chorus data chorus consists of the neutrino and antineutrino DIS cross sections (412 data points each) with 13 sources of experimental systematic error. These data have also been corrected for electromagnetic radiative effects.
The Kulagin-Petti nuclear corrections include an isoscalar correction which accounts for the neutron excess in the corresponding Fe or Pb targets. For fits performed using these nuclear corrections the data sets without isoscalar corrections were used. For comparison purposes in later sections some results will be discussed which were obtained either without any nuclear corrections or with corrections which did not include the isoscalar correction. In these cases, the isoscalar corrections have been applied to the data using tables supplied by the NuTeV and Chorus Collaborations.
In addition, we fit the QCD theory to the cross section data directly, unlike the previous CTEQ6 PDFs which were fit to structure functions that had been extracted from the data by the CCFR collaboration.
The E-866 data set consists of 184 (191) data points for the cross sections . Correlated systematic errors are not available for these data, so the statistical and systematic errors have been added in quadrature.
III Global fits
The reference fit was made to data from the BCDMS Collaboration bcdms for , from the NMC Collaboration nmc for , from H1 H1 and ZEUS ZEUS for , from CDF cdf and DØ d0 for inclusive jet production, from CDF cdf_w for the lepton asymmetry, from E-866 e866_ratio for the ratio of lepton pair cross sections for and interactions, and from E-605 e605 for dimuon production in interactions. Note that the E-605 data were taken on a copper target, but the nuclear corrections in the relevant kinematic region have been measured dimuon_nuc to be consistent with , so no nuclear corrections were included for these data.
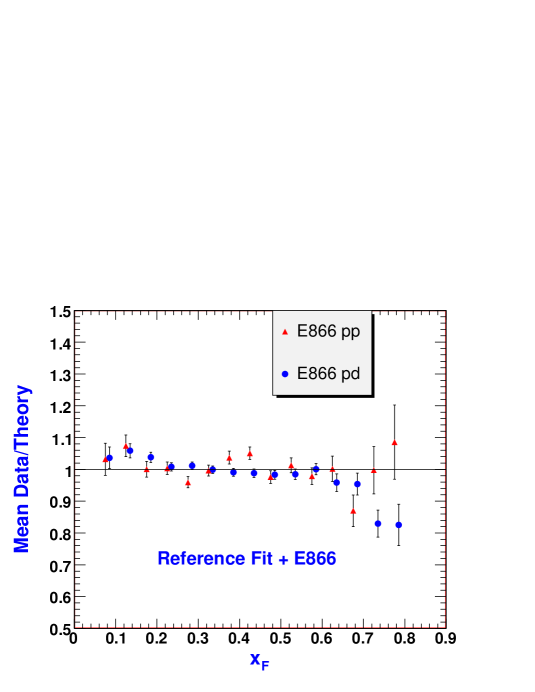
In order to provide a context for the discussion of the various global fits, Fig. 1 shows a comparison between the reference fit and the E-866 proton and deuterium data. The data are plotted versus and integrated over the dimuon mass. What is actually plotted in each bin is the weighted mean of data/theory for that particular bin in an effort to display the two dimensional data array in a simple fashion. Only the data normalization has been fitted here; otherwise the reference fit parameters are unchanged. The data, both proton and deuterium, are larger than theory at small , then fall below the theory at large . The largest deuterium data points appear to be lower than the proton data, perhaps suggesting a nuclear correction for the deuteron is needed. But large corresponds to large ( for the beam protons) and small ( for the target). Based on the model used in this analysis, the deuterium corrections at these values are expected to be less than a few per cent and, therefore, insufficient to account for the difference between the theory and the data.

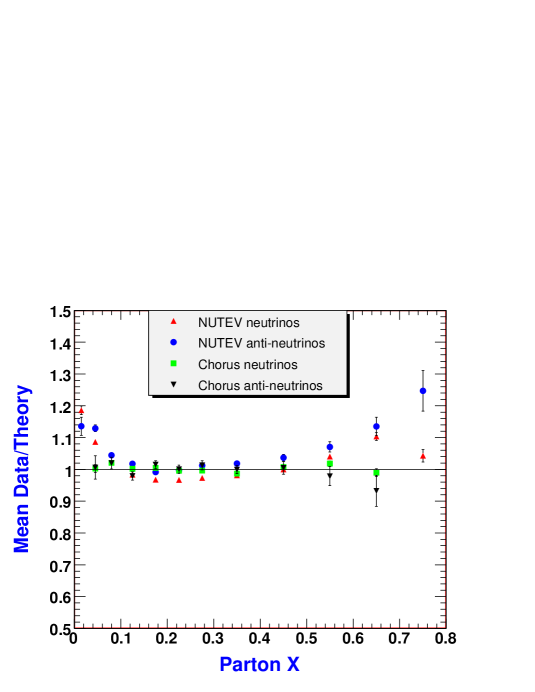
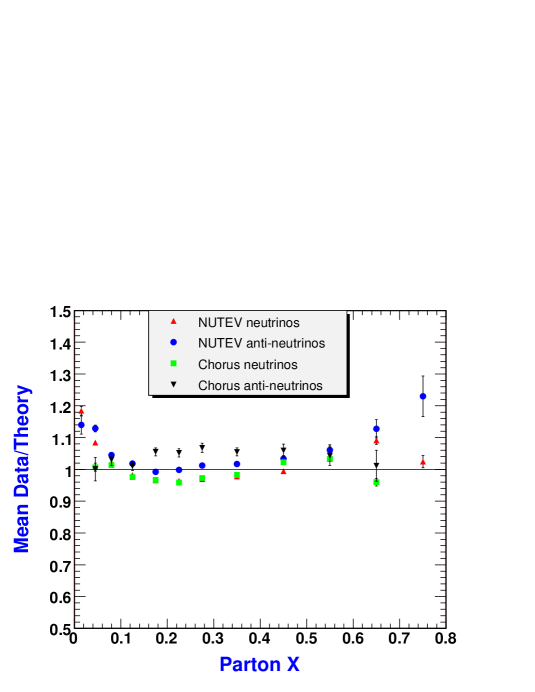
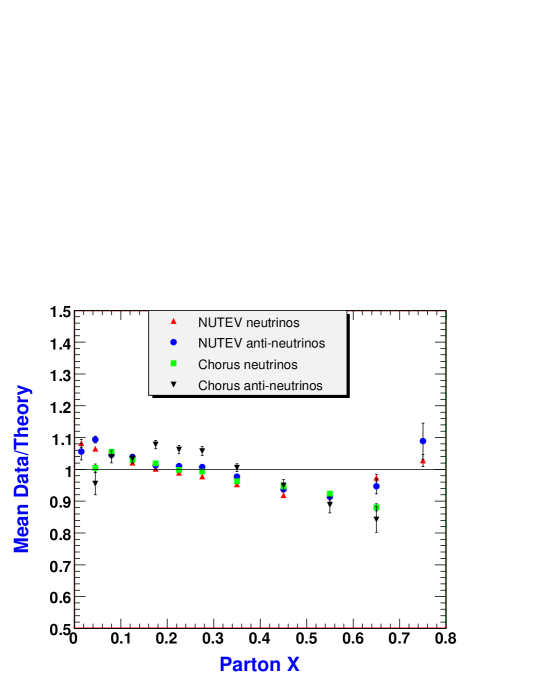
In a similar manner, Fig. 2 shows the NuTeV and Chorus data sets plotted versus and integrated over . Again, in each bin the weighted mean of data/theory is shown. In this case, as opposed to that in Fig. 1, the NuTeV data at large values of are systematically higher than the theory. It should be emphasized that these data have had nuclear corrections applied to them. In the large- region covered by the data in Fig. 2 the nuclear corrections have the effect of raising the data relative to the theory, which has therefore made the agreement worse: the non-corrected data do not show as significant an excess in this region. Another point to bear in mind is that the NuTeV and Chorus collaborations have published both uncorrelated and correlated errors. The correlated errors published by the experimental collaborations are taken into account by the method that was previously used for CTEQ6M cteq6m . (This method is also used by HERA analysis groups for electron and positron DIS.) For each source of systematic error, a fitting parameter is introduced for systematic variation of the data points within the published standard deviations. We obtain the optimal values for these systematic shifts to bring theory and data into closest agreement. The sizes of the shifts are not unreasonably large—typically less than one standard deviation. In Fig. 2, the shifted data points are plotted in comparison to the theory. The error bars then correspond only to the statistical errors.
The results shown in Figs. 1 and 2 illustrate how the two types of data pull the valence distributions in opposite directions, as discussed in the previous section.
For comparison purposes, the chi square values for the six data sets shown in Figs. 1 and 2 are shown in the lower part of Table I in the column for the reference fit. Again, it should be emphasized that these data sets were not included in the reference fit. The chi square values are shown only so that one can gauge the changes that occur as the various sets are added to the global fits.
As noted in Sec. II, the new data sets are primarily sensitive at large values of to the PDF linear combinations and . Accordingly, one might well expect the effects of adding one or more of the new data sets to the reference fits to show up in the ratio. Of course, there are data sets in the reference fit that are sensitive to these particular combinations already. Thus, if all the data sets are consistent one would expect no change in the ratio. On the other hand, should one or more data sets be inconsistent with the others then either the ratio might change or the chi squares for some or all of the data sets might increase, or both. Examples of each of those alternatives will be shown in the following discussion. These changes in the ratio will prove to be useful for characterizing the effects of adding or deleting data sets from the fits. It must be emphasized that these variations in the ratio results are not to be interpreted as “error bands.” Furthermore, the variations resulting from different choices for data sets used in a given fit may well be smaller than the overall error bands estimated from the CTEQ6.1M 40 eigenvector uncertainty sets, for example. We are simply using the ratio results as a pedagogical tool to help understand the manner in which different data sets pull the results.
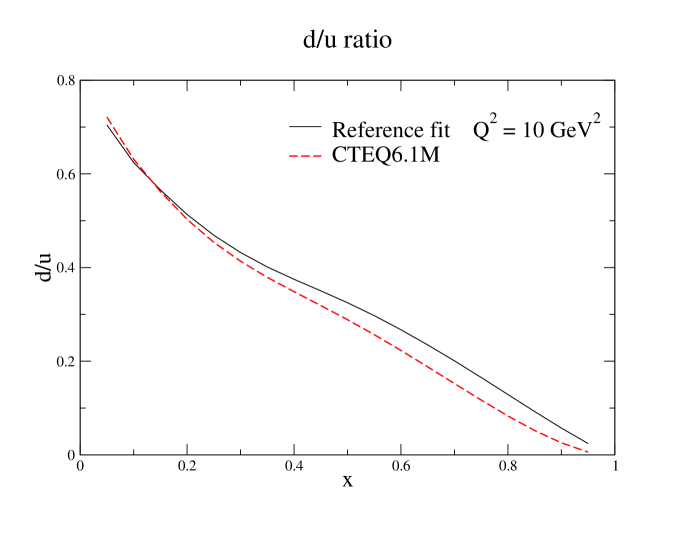
In Fig. 3 the ratios are shown for both the CTEQ6.1M fit and the reference fit described in the previous section. The inclusion of deuteron corrections in the reference fit moves the data for the ratio up in the region which is reflected in the slight increase of the reference fit over the previous CTEQ6.1M results. We also checked that the ratio in the reference fit was essentially unchanged from that in CTEQ6.1M if the deuteron corrections were not used, even though the CCFR data sets had been removed. An interesting footnote to this study is that equally good global fits can be obtained with or without the deuteron corrections. This point will be discussed further in Sec. V
In addition to the behavior of the ratio, the chi square/point values for each data set and each fit are required in order to understand the impact of adding each new data set. These values are shown in Table I.
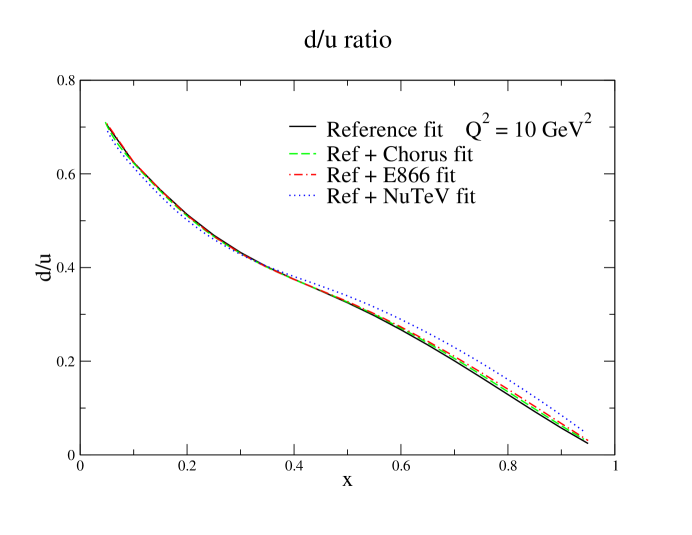
Next, the three data sets from Chorus, NuTeV, and E-866 are added to the reference fit one at a time. The results are shown in the fourth through sixth columns in Table I and also in Fig. 4. In each case, as one data set at a time is added, the results for the ratio remain essentially unchanged from the reference fit. However, examining the chi square values in Table I shows that the NuTeV data are forcing the chi square values higher for the BCDMS and NMC DIS data. This is largely due to the increased values for the cross section in the range above . Note that the relatively large number of data points in the NuTeV sample allows it to dominate over the other DIS data sets. Another possibility which will be discussed in detail later in this section is that the large- nuclear corrections are too large. In this kinematic region the ratio is less than one, so the nuclear corrections raise the data when referenced back to an isoscalar nucleon target. Reducing the nuclear corrections in this region would reduce the tension between the NuTeV data and those in the neutral current DIS sets.
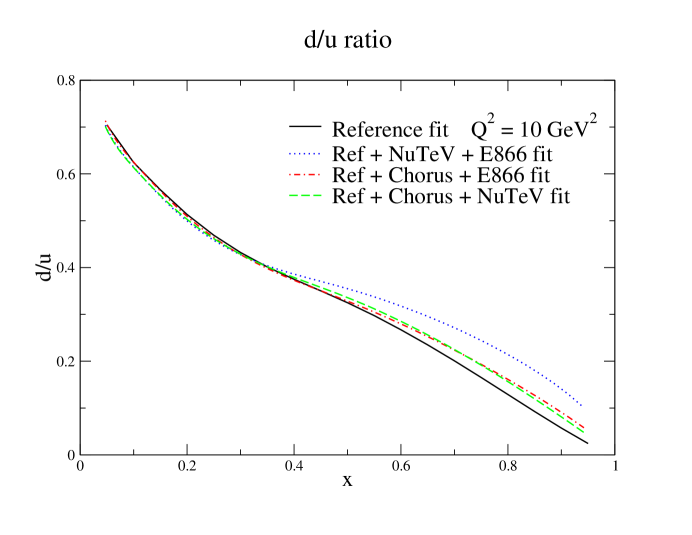
In the next step in the sequence of fits, the new data sets were included two at a time. The results are shown in Fig. 5 and in columns seven through nine in Table I. The results for the Chorus+E866 and Chorus+NuTeV fits are consistent with those obtained when the data sets were added one at a time. However, a new result appears when the NuTeV and E-866 data sets are added at the same time. Fig. 5 shows that the ratio at large values of has increased more than in the previous fits. Furthermore, careful examination of the chi square values in Table I shows that the E-866 chi square has increased as well as that for the NMC ratio data integrated over . This appears to be due to an interaction between the conflicting demands of the NuTeV and E-866 data sets. On the one hand, the NuTeV data require that the combination be increased at large values of . On the other hand, the best fits to the E-866 data require that the combination be reduced at large values of . When the fits are done with either data set alone added to the reference set it is possible to get relatively good fits, although, as noted previously, the NuTeV data do pull against the neutral current DIS data. When both the NuTeV and E-866 data sets are added at the same time the fitting program finds a new type of minimum with a significantly enhanced quark distribution in the region of large . In fact, the exponent of the factor decreases from a typical value of 4.2 down to about 3.2, thereby flattening out the quark distribution. This results in an increased ratio at large values of . This solution appears as a compromise — increasing the quark and slightly decreasing the quark allows an increase in along with a decrease in . The price that is paid is an increase in the NMC ratio data chi square. It should be emphasized that this solution is a compromise between conflicting requirements: the resulting chi square values are generally not satisfactory.
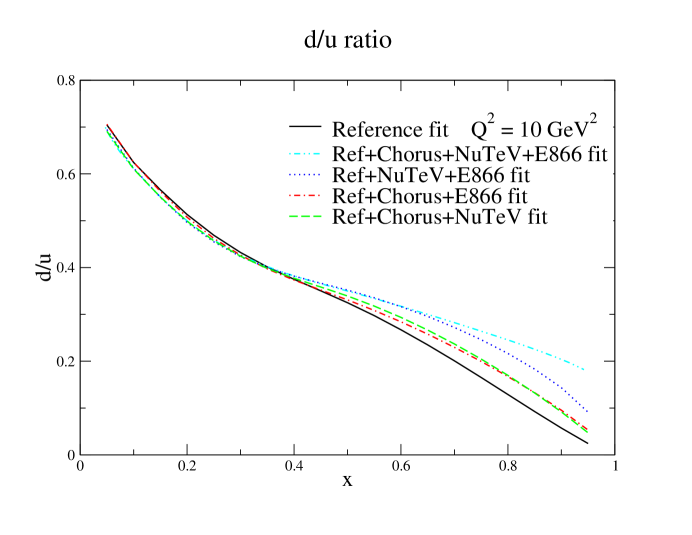
The final step in the analysis is to add all three of the new data sets to the reference set. The results are shown in Fig. 6 and in the column of Table I labelled “all.” The same behavior as was seen in the case when both the NuTeV and E-866 sets were added at the same time is seen here, as well. There are elevated chi square values for the E-866 data, the NMC ratio data, and for other neutral current DIS data sets. This again shows that the NuTeV and E-866 data sets are pulling against each other.
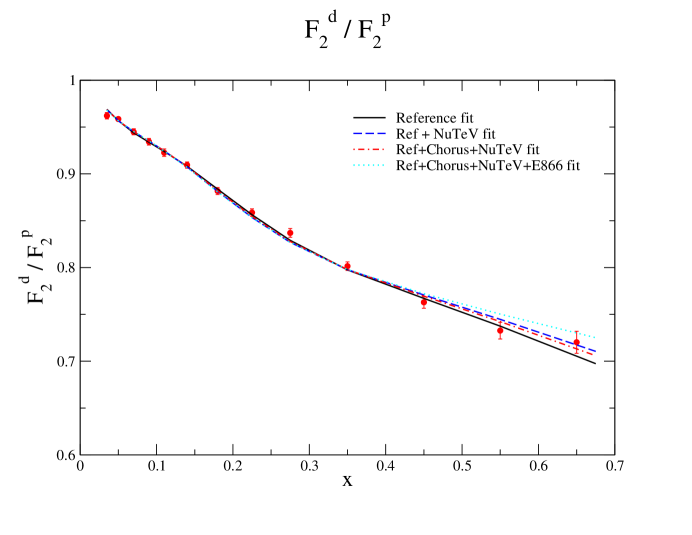
The data for integrated over nmc have proven to be instrumental in constraining the ratio in the fits discussed in the text. These data are shown in Figure 7 along with several curves described in the text. The variation in is less than that for the ratio since in the large- region if changes from 0 to 1, only changes from 0.625 to 1. Nevertheless, the same trend is apparent in curves as was shown previously for the ratio.
The trends noted for the fits described above are not unique. This is a result of the fact that the chi squares for some data sets increase when other data sets are added to the fit. This tension between different data sets can be explored by varying the weight for a given data set in the total chi square. The NuTeV data tend to dominate due to the large number of data points. Improved fits to the E-866 data or the NMC ratio data can be obtained by simply multiplying their chi square contribution by a weighting factor greater than one. If this is not done, then the smaller data sets play little or no role in the chi square. Utilizing such reweighting of individual chi squares results in families of fits rather than one unique best fit.
| Data set | # pts | Reference | Chorus | NuTeV | E-866 | Ch+866 | Nu+866 | Ch+Nu | All | mod nuc | CTEQ6DU |
| BCDMS | 339 | 1.10 | 1.11 | 1.29 | 1.13 | 1.13 | 1.23 | 1.26 | 1.20 | 1.23 | 1.24 |
| BCDMS | 251 | 1.10 | 1.11 | 1.36 | 1.15 | 1.17 | 1.36 | 1.32 | 1.30 | 1.31 | 1.29 |
| H1 | 79 | 0.93 | 0.94 | 1.20 | 0.94 | 0.93 | 1.11 | 1.22 | 1.12 | 1.03 | 1.03 |
| H1 | 126 | 0.99 | 1.00 | 0.95 | 1.00 | 0.98 | 0.93 | 0.93 | 0.93 | 0.94 | 1.00 |
| H1 | 130 | 0.77 | 0.78 | 0.76 | 0.76 | 0.76 | 0.74 | 0.75 | 0.73 | 0.73 | 0.76 |
| Zeus | 197 | 1.22 | 1.21 | 1.17 | 1.22 | 1.21 | 1.18 | 1.21 | 1.15 | 1.14 | 1.19 |
| NMC | 13 | 1.05 | 1.01 | 1.20 | 1.11 | 1.02 | 1.60 | 1.06 | 1.35 | 1.20 | 0.85 |
| NMC | 201 | 1.46 | 1.47 | 1.79 | 1.47 | 1.47 | 1.78 | 1.81 | 1.77 | 1.64 | 1.56 |
| NMC | 123 | 0.96 | 0.96 | 0.99 | 0.97 | 0.97 | 1.11 | 1.03 | 1.09 | 0.97 | 0.92 |
| E-605 | 119 | 0.79 | 0.82 | 0.89 | 0.70 | 0.80 | 0.91 | 0.92 | 0.93 | 0.85 | 0.87 |
| CDF asy | 11 | 1.15 | 1.08 | 1.08 | 1.26 | 1.15 | 1.23 | 1.14 | 1.25 | 1.02 | 1.28 |
| E866 | 15 | 0.43 | 0.45 | 0.44 | 0.50 | 0.47 | 0.52 | 0.43 | 0.46 | 0.41 | 0.34 |
| DØ jets | 90 | 0.94 | 0.84 | 0.66 | 0.98 | 0.97 | 0.65 | 0.69 | 0.74 | 0.93 | 0.97 |
| CDF jets | 33 | 1.62 | 1.65 | 1.63 | 1.63 | 1.65 | 1.64 | 1.61 | 1.63 | 1.63 | 1.68 |
| Total chi square | - | 1947 | |||||||||
| # points | - | 1727 | |||||||||
| E-866 | 184 | 1.23 | - | - | 1.16 | 1.15 | 1.22 | - | 1.21 | 1.15 | 1.16 |
| E-866 | 191 | 1.85 | - | - | 1.49 | 1.49 | 1.84 | - | 1.80 | 1.59 | 1.27 |
| NuTeV | 1170 | 2.19 | - | 1.65 | - | - | 1.68 | 1.67 | 1.71 | 1.64 | - |
| NuTeV | 966 | 1.51 | - | 1.27 | - | - | 1.29 | 1.27 | 1.28 | 1.21 | - |
| Chorus | 412 | 1.30 | 1.27 | - | - | 1.27 | - | 1.29 | 1.27 | 1.28 | - |
| Chorus | 412 | 1.08 | 1.09 | - | - | 1.08 | - | 1.16 | 1.15 | 1.18 | - |
| Total chi square | 7453 | 2838 | 5218 | 2393 | 3357 | 5836 | 6247 | 6827 | 6606 | 2443 | |
| # points | - | 5062 | 2551 | 3863 | 2102 | 2926 | 4238 | 4687 | 5062 | 5062 | 2102 |
IV Nuclear Corrections
A review of the chi square values in Table I shows that the Chorus data are reasonably well described by the reference fit and by all of the other fits as well. This situation is in contrast to that for the NuTeV data, where the chi squares are significantly higher. This is shown, for example, in Fig. 2. In this figure the Kulagin-Petti nuclear corrections for Fe and Pb have been applied to the NuTeV and Chorus experiments, respectively. In order to fully understand the significance of this figure, one must be aware that the data have been shifted by the optimal values of the correlated errors prior to making the plot. It turns out that the correlated errors allow larger shifts for the Chorus data than for the NuTeV data. Thus, there is more freedom for the Chorus data to shift and to thereby reduce the chi square. This is shown in more detail in Fig. 8 where now the unshifted data are plotted. The deviation of the mean data/theory values from one is now more pronounced in some regions of for the Chorus data than for the NuTeV data. Comparison with Fig. 2 shows that the NuTeV data have been shifted very little while the Chorus shifts are much larger. Hence, in the various fits discussed previously it is clear that much more weight is being given to the NuTeV data due to their smaller systematic errors. Thus, it is premature to conclude that there is any systematic disagreement between the two experiments simply because of the chi square values shown in Table I.
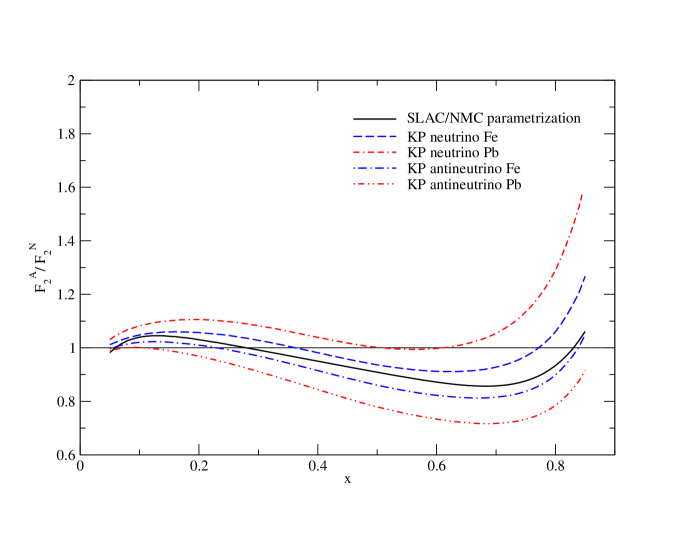
It is instructive to examine the typical magnitude of the nuclear corrections used in this analysis. These are shown in Fig. 9 for the structure function in the form of a ratio of the nuclear structure function to that of an isoscalar nucleon target. The SLAC/NMC curve is the result of an A-independent parametrization fit to calcium and iron charged-lepton DIS dataSLAC/NMC . The other four curves show the Kulagin-Petti results at . The results for are similar. Note, in particular, that the corrections for antineutrinos are larger than for charged leptons while those for neutrinos are generally smaller.
This issue may be investigated in a different fashion. Fig. 10 shows the results of removing the nuclear corrections used in Fig. 8 while still using unshifted data. Now there is rather good agreement between the different data sets in the sense that the mean data/theory values are consistent even though they are not equal to one. Moreover, the pattern of deviation from unity in the large- region does look very much like the usual pattern associated with nuclear corrections. Thus, these results suggest on a purely phenomenological level that the nuclear corrections may well be very similar for the and cross sections and that the overall magnitude of the corrections may well be smaller than in the model used in this analysis.
In order to test this idea, several fits were done using nuclear corrections determined experimentally in charged-lepton DIS experiments (The SLAC/NMC curve in Fig. 9) but with the magnitude reduced by a scale factor , i.e., the nuclear correction ratio was replaced by so that gives no correction and gives the full correction. The same corrections were used for both the and cross sections for both experiments. The chi squares for the NuTeV data were significantly reduced when the nuclear corrections were reduced by a factor on the order of . The results for are shown in Table I in the column labelled “mod nuc.” As expected, the chi squares for the Chorus data were essentially unchanged, since the data could simply shift to accommodate the nuclear correction model. While certainly not definitive, this observation strongly suggests that one must have a better understanding of the nuclear corrections in neutrino interactions before the NuTeV data can be understood in the context of a global fit. Regarding the results for the ratio, it may well be that the least model-dependent determination should be made using data not taken on heavy targets. In this sense then, fits such as the Reference fit together with the E-866 data should give a less model-dependent result. Such fits are the focus of the next Section.
One last point concerning the nuclear corrections should be emphasized. The Kulagin-Petti corrections include a correction for the neutron excess in the relevant nucleus. This is why the correction factors for Fe and Pb are so different in Fig. 9. Thus, when these nuclear corrections are used one must use data that have not been corrected for the neutron excess. On the other hand, when comparing the data to theory without the nuclear corrections one must be sure to include a correction for the neutron excess either in the theory or in the data.
V Determination of without heavy target data
In this section we focus on the E-866 data and the question of whether they can be well described in the context of a global fit without using data involving heavy targets.
As noted earlier, at large values of these data help determine the ratio. For , however, the CDF W lepton asymmetry data and the ratio data from NMC provide strong constraints that must be satisfied to be sure we have a consistent global picture.
Fig. 11 shows the starting point, the Reference fit + E-866 mentioned earlier. The /data point is 1.16 for the data and 1.49 for the data (which has better statistics). These values are much improved from the Reference fit without E-866 data but are still not acceptable. The differences between the and data at large were discussed earlier, along with the reasons we believe that this is not due to deuterium effects but is more likely a statistical fluctuation.
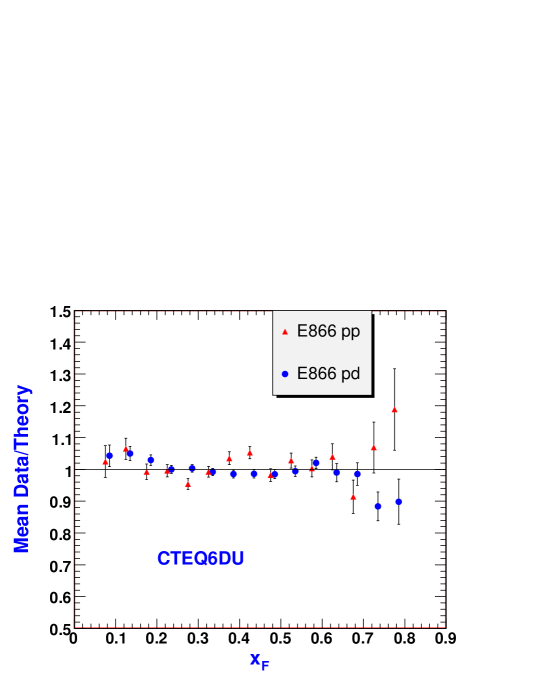
In an effort to improve the description of the E-866 data sets, a fit was performed in which additional weight was given to E-866 as well as the W asymmetry and data. This fit is referred to as CTEQ6DU and the corresponding chi square values are shown in the last column of Table I. The /data point is 1.16 for the data and 1.27 for the data, the latter value showing a significant improvement. In addition, it appears this fit provides a compromise solution between the and data points at large .
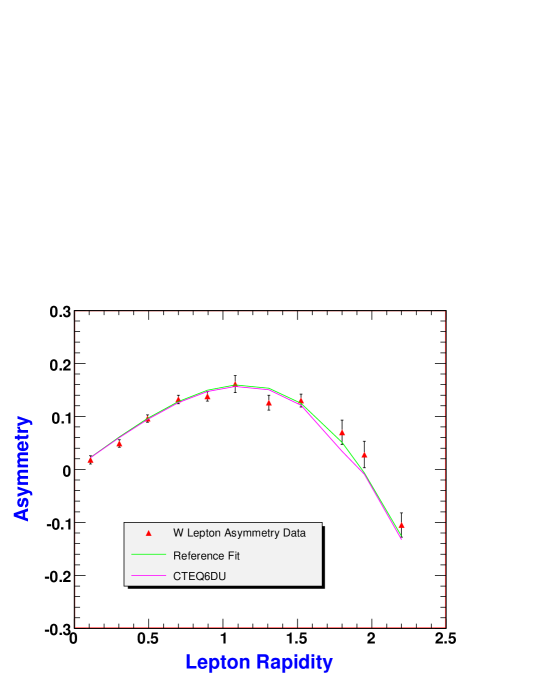
This fit provides a good overall description of the data. The total is 2443 for 2102 data points, which is slightly higher than the Reference fit + E-866 without the extra statistical weight (which had a total of 2393 as shown in column 6 of Table I). The CDF W lepton asymmetry data in this fit has a /point of 1.28, and is shown in fig. 13. This figure shows that the change in the theoretical prediction from the original reference fit is very small. The ratio data from NMC, shown earlier, has a /point of 0.85. Finally, the ratio resulting from this fit is essentially the same as that for the Reference fit shown earlier.
One final comment concerns the dependence of the global fits on the model dependent deuteron corrections. The CTEQ6DU fit (with the extra weighting discussed above) was repeated, but without the deuteron corrections for the DIS experiments with deuteron targets. The resulting chi square was essentially unchanged from the CTEQ6DU fit (2444 instead of 2443) and there were very minor changes amongst the various experiments. The resulting ratio was essentially the same as for CTEQ6.1M. Thus, equally good fits could be obtained with or without the deuteron corrections and the only visible result was the change in the ratio as shown in Fig. 3. So, on the basis of these fits alone, one could not determine the necessity of including the deuteron corrections. This point will be explored further in a future analysis.
VI Conclusions
The impact of the new data sets from the NuTeV nutev , Chorus chorus , and E-866 e866 Collaborations on the behavior of PDFs at large values of has been studied. The effects are most pronounced when one examines the ratio. Adding each new data set one at a time causes no significant alterations to the standard reference fit, which is based on the CTEQ6.1M cteq61m PDFs. Adding Chorus and E-866 or adding Chorus and NuTeV likewise causes little change. However, adding NuTeV and E-866 simultaneously causes the ratio to flatten out substantially, as the program is able to find a new minimum which represents a compromise between the conflicting demands of the two data sets at large . This effect is enhanced further when all three data sets are added to the reference set.
One conclusion is that the NuTeV data set together with the model used for the nuclear corrections pulls against several of the other data sets, notably the E-866 and the BCDMS and NMC sets. Reducing the nuclear corrections at large values of would lessen the severity of this pull and would result in improved chi square values.
Acknowledgement
The authors wish to thank Wu-Ki Tung for his interest in this topic and for discussions about the relative impact of the different data sets on global fits. This work was supported in part by the National Science Foundation and the U.S. Department of Energy.
VII Appendix
The deuteron correction factor which is used to convert deuteron target data to that corresponding to an isoscalar target was obtained by fitting the model-dependent results for in Table X of Ref. gomez . The parametrization used is
One can then divide the deuteron data by the above parametrization to obtain data corresponding to an isoscalar target. The parameter values are given in Table II.
| Parameter | Value |
|---|---|
| 1.0164 | |
| -0.0478 | |
| -0.1335 | |
| 0.3530 | |
| 0.2272 | |
| -1.2906 | |
| 5.6075 |
References
- (1) M. Tzanov et al., PRD 74, 012008 (2006)
- (2) G. Onengut et al., Phys. Lett. B 632, 65 (2006)
- (3) Jason Webb, Ph.D. Thesis, New Mexico State University, 2002, arxiv:hep-ex/0301031 and Paul Reimer, Private Communication.
- (4) J. Pumplin et. al., JHEP 0207, 012 (2002)
- (5) D. Stump, et al., JHEP 0310, 046 (2003)
- (6) J. Gomez et al., Phys. Rev. D 49, 4348 (1994).
- (7) S.A. Kulagin and R. Petti, Nucl. Phys. A 765, 126 (2006)
- (8) CCFR Collaboration: W. G. Seligman et al., Phys. Rev. Lett. 79 (1997) 1213 [hep-ex/970107]; CCFR Collaboration: U. K. Yang et al., Phys. Rev. Lett. 86 (2001) 2742 [hep-ex/0009041].
- (9) M. A. Aivazis, F. I. Olness and W. K. Tung, Phys. Rev. D 50 (1994) 3085 [hep-ph/9312318]; M. A. Aivazis, J. C. Collins, F. I. Olness and W. K. Tung, neutral current processes from fixed target to collider energies,” Phys. Rev. D 50 (1994) 3102 [hep-ph/9312319].
- (10) BCDMS Collaboration: A. C. Benvenuti et al., Phys. Lett. B 223 (1989) 485; BCDMS Collaboration: A. C. Benvenuti et al., Phys. Lett. B 236 (1989) 592.
- (11) New Muon Collaboration: M. Arneodo et al., Nucl. Phys. B 483 (1997) 3 [hep-ph/9610231]; and M. Arneodo et al., Nucl. Phys. B 487 (1997) 3 [hep-ex/9611022].
- (12) H1 Collaboration: C. Adloff et al., Eur. Phys. J. C 13 (2000) 609 [hep-ex/9908059]; Eur. Phys. J. C 19 (2001) 269 [hep-ex/0012052]; Eur. Phys. J. C 21 (2001) 33 [hep-ex/0012053].
- (13) ZEUS Collaboration: S. Chekanov et al., Eur. Phys. J. C 21 (2001) 443 [hep-ex/0105090]; A.M. Cooper-Sarkar, Proceedings of International Europhysics Conference on HEP 2001, Budapest [hep-ph/0110386].
- (14) CDF Collaboration: T. Affolder et al., Phys. Rev. D 64 (2001) 032001 [hep-ph/0102074].
- (15) DØ Collaboration: B. Abbott et al., Phys. Rev. Lett. 86 (2001) 1707 [hep-ex/0011036]; and Phys. Rev. D 64 (2001) 032003 [hep-ex/0012046].
- (16) CDF Collaboration: F. Abe et al., Phys. Rev. Lett. 81 (1998) 5754 [hep-ex/9809001].
- (17) E866 Collaboration: R. S. Towell et al., Phys. Rev. D 64 (2001) 052002 [hep-ex/0103030].
- (18) E605 Collaboration: G. Moreno et al., Phys. Rev. D 43 (1991) 2815.
- (19) A. Bruell, private communication.
- (20) D.M. Alde et al., Phys. Rev. Lett. 64, 2479 (1990).