Nucleon Decay Searches with large Liquid Argon TPC Detectors at Shallow Depths: atmospheric neutrinos and cosmogenic backgrounds
Abstract
Grand Unification of the strong, weak and electromagnetic interactions into a single unified gauge group is an extremely appealing idea which has been vigorously pursued theoretically and experimentally for many years. The detection of proton or bound-neutron decays would represent its most direct experimental evidence. In this context, we studied the physics potentialities of very large underground Liquid Argon Time Projection Chambers (LAr TPC). We carried out a detailed simulation of signal efficiency and background sources, including atmospheric neutrinos and cosmogenic backgrounds. We point out that a liquid Argon TPC, offering good granularity and energy resolution, low particle detection threshold, and excellent background discrimination, should yield very good signal over background ratios in many possible decay modes, allowing to reach partial lifetime sensitivities in the range of years with exposures up to 1000 ktonyear, often in quasi-background-free conditions optimal for discoveries at the few events level, corresponding to atmospheric neutrino background rejections of the order of . Multi-prong decay modes like e.g. or and channels involving kaons like e.g. , and are particularly suitable, since liquid Argon imaging provides typically an order of magnitude improvement in efficiencies for similar or better background conditions compared to Water Cerenkov detectors. Up to a factor 2 improvement in efficiency is expected for modes like and thanks to the clean photon identification and separation from . Channels like or , dominated by intrinsic nuclear effects, yield similar efficiencies and backgrounds as in Water Cerenkov detectors. Thanks to the self-shielding and 3D-imaging properties of the liquid Argon TPC, this result remains valid even at shallow depths where cosmogenic background sources are important. We consider the possibility of a very large area annular active muon veto shield in order to further suppress cosmogenic backgrounds at shallow depths. In conclusion, we find that this class of detectors does not necessarily require very deep underground laboratories, like those typically encountered in existing or planned sites, to perform very sensitive nucleon decay searches. In addition to a successful completion of the required R&D necessary to reach a relevant liquid Argon mass scale of 100 kton in a cost-effective way, we finally stress the importance of an experimental verification of the liquid Argon TPC physics potentialities to detect, reconstruct and classify events in the relevant GeV energy range. This experimental verification will require in addition to possible specific tests in charged particle beams, the collection of neutrino event samples with statistics in the range of 100’000 events or more, accessible e.g. with a medium-sized detector at near sites of long baseline artificial neutrino beams.
pacs:
13.30.-a, 14.20.Dh, 29.40.GxI Introduction
Grand Unification (GU) of the strong, weak and electromagnetic interactions into a single unified gauge gut ; Georgi:1974sy is an extremely appealing solution which has been vigorously pursued, theoretically and experimentally, for many years. An experimental hint in its favor is the apparent merging of the three coupling constants at a large energy scale ( GeV) when low energy measurements are extrapolated Amaldi:1991cn . On the other hand, the most convincing experimental evidence for GU would be the direct observation of baryon number violation Langacker:1980js . The experimental search for decays of protons or bound-neutrons is therefore one of the most important and unsolved problem of particle physics.
In the simplest Grand Unified Theories (GUT), nucleon decay proceeds via an exchange of a massive boson between two quarks in a proton or in a bound neutron. In this reaction, one quark transforms into a lepton and another into an anti-quark which binds with a spectator quark creating a meson. According to the experimental results from Super-Kamiokande Shiozawa:1998si ; Shiozawa:2003it constraining the partial decay to years (90%C.L.), the minimal SU(5) Georgi:1974sy , predicting a proton lifetime proportional to where is the unified coupling constant and the mass of the gauge boson , seems definitely ruled out.
Supersymmetry, motivated by the so-called “hierarchy problem”, postulates that for every SM particle, there is a corresponding “superpartner” with spin differing by 1/2 unit from the SM particle susy . In this case, the unification scale turns out higher, and pushes up the proton lifetime in the channel up to years, compatible with experimental results. At the same time, alternative decay channels open up via dimension-five operator interactions with the exchange of heavy supersymmetric particles. In these models, transitions from one quark family in the initial state to the same family in the final state are suppressed. Since the only second or third generation quark which is kinematically allowed is the strange quark, an anti-strange quark typically appears in the final state for these interactions. The anti-strange quark binds with a spectator quark to form a meson in the final state Pati . The searches for decays , , and modes were also performed in Super-Kamiokande Hayato:1999az ; Kobayashi:2005pe yielding counts compatible with background expectations, leading to limits on possible minimal SUSY SU(5) models Dimopoulos:1981zb ; Sakai:1982pk ; Hisano:1993jj . The theoretical predictions, however, vary widely, since there are many new unknown parameters introduced in these models.
Other alternative models have been discussed in the litterature Nath:1985ub ; Nath:1998kg ; Shafi:1999vm ; Lucas:1997bc ; Pati:2003qi ; Babu:1998js ; Babu:1998wi ; Pati:2000wu ; Ellis:2002vk ; Arkani-Hamed:2004yi ; Hebecker:2002rc ; Alciati:2005ur ; Klebanov:2003my (see Table 1). In addition to the above mentioned GUTs, other supersymmetric SUSY-GUT, SUGRA unified models, unification based on extra dimensions, and string-M-theory models are also possible (see Ref. Nath:2006ut for a recent review). All these models predict nucleon instability at some level. Finally, it is also worth noting that theories without low-energy super-symmetry Arkani-Hamed:2004yi ; Wiesenfeldt:2006ut predict nucleon decay lifetimes in the range years.
| Model | Ref. | Modes | (years) |
|---|---|---|---|
| Minimal | Georgi, Glashow Georgi:1974sy | ||
| Minimal SUSY | Dimopoulos, Georgi Dimopoulos:1981zb , Sakai Sakai:1982pk | ||
| Lifetime Calculations: Hisano, | |||
| Murayama, Yanagida Hisano:1993jj | |||
| SUGRA | Nath, Arnowitt Nath:1985ub ; Nath:1998kg | ||
| SUSY | Shafi, Tavartkiladze Shafi:1999vm | ||
| with anomalous | |||
| flavor | |||
| SUSY | Lucas, Raby Lucas:1997bc , Pati Pati:2003qi | ||
| MSSM (std. ) | |||
| SUSY | Pati Pati:2003qi | ||
| ESSM (std. ) | |||
| SUSY | Babu, Pati, Wilczek Babu:1998js ; Babu:1998wi ; Pati:2000wu , | ||
| MSSM or ESSM | Pati Pati:2003qi | ||
| (new ) | |||
| SUSY or | Pati Pati:2003qi | ||
| MSSM () | |||
| Flipped in CMSSM | Ellis, Nanopoulos and WlakerEllis:2002vk | ||
| Split SUSY | Arkani-Hamed, et. al. Arkani-Hamed:2004yi | ||
| in 5 dimensions | Hebecker, March-RussellHebecker:2002rc | ||
| in 5 dimensions | Alciati et.al.Alciati:2005ur | ||
| option II | |||
| GUT-like models from | Klebanov, WittenKlebanov:2003my | ||
| Type IIA string with D6-branes | |||
Some experimental aspects of nucleon decay detection were discussed in Ref. Rubbia:2004yq . Nucleon decay signals are characterized by (a) their topology and (b) their kinematics. The presence of a lepton (electron, muon or neutrino) in the final state is expected, and in general few other particles (two body decays are kinematically favored), and no other energetic nucleon. The total energy of the event should be close to the nucleon mass and the total momentum should be balanced, with the exception of the smearing introduced by Fermi motion and other nuclear effects (nuclear potential, re-scattering, absorption, etc.) for bound decaying nucleons.
The search for nucleon decay therefore requires (1) excellent tracking and calorimetric resolutions to constrain the final state kinematics and suppress atmospheric neutrino backgrounds, (2) particle identification (in particular kaon tagging) for branching mode identification (3) very massive detectors and (4) underground locations to shield against cosmic-ray induced backgrounds, although the exact required rock overburden depends on the chosen detection technology. Fine tracking in the low momentum range (100–1000 MeV/c) is fundamental for () measurement, particle identification and vertex reconstruction.
In order to significantly improve current experimental results, next generation massive underground detectors satisfying the above requirements have to be considered. Given the variety of predicted decay modes open by the new theories, the ideal detectors should be as versatile as possible, very good in background rejection, and at the same time have the largest possible mass. The relevant factor is in fact M, where M is the detector mass and the signal detection efficiency after cuts to suppress backgrounds, which depends on the considered decay channel. Hence large masses must be coupled to fine tracking and excellent calorimetry, to suppress atmospheric neutrino and cosmogenic backgrounds with a good signal selection efficiency. Furthermore, the detector should be sensitive to several different channels in order to better understand the nucleon decay mechanism. Since there are about nucleons per kton of mass, the proton lifetime limit (90% CL) in case of absence of signal and backgrounds is about M (kton) T years, where T is the exposure in years and B the assumed branching fraction for the searched mode. Therefore, the required effective mass M to reach years is in the range of 100 kton assuming T10 years.
Such massive underground detectors will be sort of observatories for rare physics phenomena like astrophysical neutrino detection and nucleon decay searches, with possible synergies with existing or new artificial neutrino beams for improved understanding of neutrino flavor oscillations, including the possible identification of direct CP-violation in the leptonic sector (see e.g. Ref. Meregaglia:2006du and references therein).
Among the various options and technologies currently thought of (see Ref. nufact06 and Refs. Nakamura:2000tp ; Suzuki:2001rb ; Jung:1999jq ; Diwan:2000yb ; deBellefon:2006vq ; MarrodanUndagoitia:2006rf ; MarrodanUndagoitia:2006qn ), the Liquid Argon Time Projection Chamber intro1 ; Aprile:1985xz ; 3tons ; Cennini:ha ; Arneodo:2006ug ; t600paper ; Amoruso:2004ti ; Amoruso:2004dy ; Badertscher:2004py ; Badertscher:2005te (LAr TPC) is a powerful detector for uniform and high accuracy imaging of massive active volumes. It is based on the fact that in highly pure Argon, ionization tracks can be drifted over distances of the order of meters. Imaging is provided by position-segmented electrodes at the end of the drift path, continuously recording the signals induced. is provided by the prompt scintillation light.
Early work on the detection of nucleon decays in liquid Argon can be found in Ref. Bueno:1999ye . The liquid Argon TPC is a very promising detector option which satisfies at best the above mentioned requisites in terms of granularity, energy resolution and imaging capabilities if it can be extrapolated to the relevant mass scale.
In this paper we study the performance of a very massive Liquid Argon TPC as a nucleon decay detector. In the present study, we address for the first time the effect of the charged cosmic rays background as a function of the depth (i.e. rock overburden) of the underground detectors. In particular, we address the possibility to perform proton decay searches in “shallow depth” configurations nufact06 . Since the new large underground detectors will require either a new site to be excavated or the extension of an existing infrastructure, it is important to understand if very-sensitive nucleon decay searches do necessarily require deep underground locations, like those typically encountered in existing or planned laboratories haxton_nufact06 .
The paper is organized as follows: some considerations about the conceptual design of the detector are outlined in section II. The discussion of the assumed detector configuration and the simulated physics process for signal and background events are described in section III. The description of the analysis cuts designed to suppress atmospheric neutrino and muon-induced backgrounds from proton and neutron decay channels are given in section IV. Finally, the results obtained in terms of lifetime sensitivities for the considered decay modes are given in section V.
II Detector concept
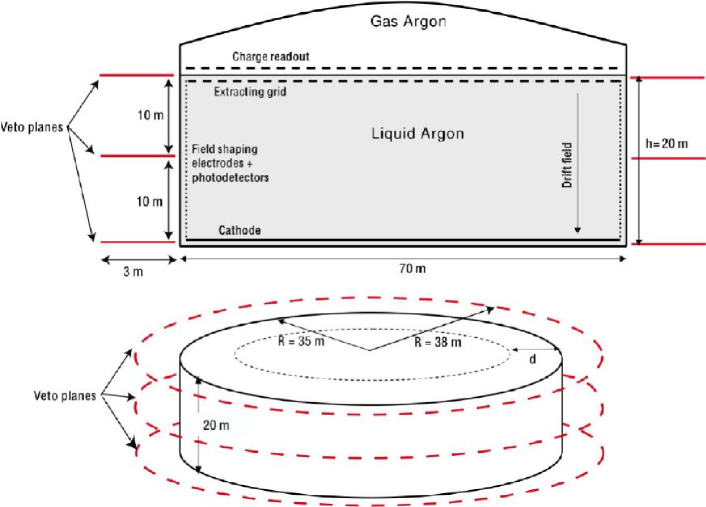
Our analysis assumes the scalable concept of a liquid Argon TPC, as proposed in Rubbia:2004tz (see Figure 1). Other designs have been presented in Ref. clinesergiamp . An LOI based on a more standard configuration and a surface detector has also been submitted to FNAL Bartoszek:2004si .
The design of Ref. Rubbia:2004tz relies on (a) industrial tankers developed by the petrochemical industry (no R&D required, readily available, safe) and their extrapolation to underground or shallow depth LAr storage, (b) novel readout methods with embedded charge chain for very long drift paths, based on e.g. LEM readout, (c) new solutions for very high drift voltage, (d) a modularity at the level of 100 kton and (e) the possibility to embed the LAr in a magnetic field Ereditato:2005yx . Such a scalable, single LAr tanker design is the most attractive solution from the point of view of physics, detector construction, operation and cryogenics, and finally cost.
An R&D program is underway with the aim of optimizing the design Ereditato:2005ru . Concerning the further consolidation of the technology, we point out that a test-beam dedicated to the reconstruction and separation of electrons from neutral pions has been discussed epilar . In addition, a ton liquid Argon TPC to complement the 1 kton Water Cerenkov detector at the potential 2 km site 2.5o off-axis from the T2K beam has also been considered t2kprop . If realized, this unique experimental setup will allow to compare the performance of the liquid Argon TPC to the Water Cerenkov ring imaging and to reconstruct neutrino events directly in the same beam with a statistics of more than 100’000 events per year, sufficient to extrapolate the atmospheric neutrino background in a potential 1000 ktonyear exposure. ICARUS T600 t600paper , to be commissioned in the coming years, will detect too few contained events to demonstrate the ultimate physics performance of the technology.
When operating TPCs with long drift paths and charge amplification at the anode as the one considered here, one must pay attention to possible drift field distortions caused by the space charge created by the positive ions slowly drifting towards the cathode. Indeed, it is well known that ion (and hole) mobility in liquid Argon is small compared to that of electrons (), and inconsistencies among experimental measurements were attributed to the influence of the motion of the liquid itself ionmobs .
The problem of ions accumulating in the TPC drift volume has been effectively overcome by introducing an additional grid (‘gate’) between the drift volume and the readout plane Nemethy:1982uw ; Amendolia:1985cq . The gate is normally closed and only opens for a short period of time when an external trigger signals an interesting event. This method is easily applicable to our design in the case of a pulsed artificial neutrino beam source, as the one considered in Ref. Meregaglia:2006du .
In the case of proton decay (or atmospheric neutrino background) where the detector must be continuously sensititive, the prompt scintillation light with an appropriate detection threshold (e.g. MeV) could be used to signal the (rare) occurrence of interesting events. Unfortunately, this is impracticable at shallow depths because, as it will be shown later, the fiducial volume occupancy is dominated by remaining cosmic ray events crossing the detector: at a rock overburden km w.e., the average number of cosmic ray muons crossing the detector within a drift time is (see Table 3). This situation worsens when the rock overburden is decreased.
Hence, either the rock-overbuden is km w.e. or the TPC must be continuously active and we must consider space charge effects from accumulating ions in the liquid Argon volume. It is possible to show that asymptotically the stationary density of ions in the drift volume of a double phase readout system with charge amplification is given by:
| (1) |
where is the average gain of the charge readout system, is the efficiency for ions to feed-back into the gas region below the charge amplification planes, is the efficiency for ions to be transmitted from the gaseous phase into the liquid phase, is the transparency of the extraction grid when traveling from the higher extraction field to the lower drift field, is the average stopping power of the cosmic ray muons, is the average path of the muons in the fiducial volume, the flux of cosmic muons at the detector upper surface per unit surface and per unit time, is the ion mobility, the electric drift field and the field-dependent average energy expended by a cosmic ray muon to create an ion-electron pair in the medium (field dependence arises from columnar ion-electron recombination Amoruso:2004dy ).
Assuming a stationary situation, ionization electrons will drift in a medium homogeneously filled with the above calculated density of ions. The resulting free electron lifetime can be estimated as where is the electron-ion recombination rate (which depends on the electric field).
We note that , because of electron diffusion in the amplification gap, as a result of which ions can follow field lines ending up on the electrodes of the amplification system rather than on the external field lines; this is particularly true for the devices with multiple stages that we operate Kaufmann:2006hp . In addition, since the extraction field is typ. 3 kV/cm and the drift field is typ. 1 kV/cm.
The efficiency for the transfer of positive ions from the vapour into the liquid Argon phase has, as far as we know, not being measured. When the distance between the ion and the liquid-vapor interface is greater than several Angstroms (the Argon bond length is ), the liquid may be treated as a continuum bruschi66 . Assuming a planar interface between the liquid and vapor, the situation is then comparable to a boundary-value problem with dielectrics and can be solved with the charge-image method in a single dimension: a point charge in the medium at the interface with a medium feels a charge image in the medium given by . For , and the force is attractive. For , and the force is repulsive. Given the difference in dielectric constants between the liquid Argon and its gas phase , a charge in the liquid will feel a repulsive force from the interface, while a charge in the gas will be attracted to the interface and will tend to “stick” at the surface. The potential energy of the charge placed at a distance from the planar liquid-vapor interface is bruschi66 ; rayfield71 ; bruschi75 ; borghesani90 :
| (2) | |||
| (3) |
where the index corresponds to the charge in the liquid () or in the vapor (). Classically, the potential barrier is infinite at the interface () and a quantum mechanical treatment is needed. In practice, one can also assume that in order to cross the boundary the charge must pass above a finite, classical potential, whose height is to be determined experimentally rayfield71 .
In the presence of an external difference of potential to create a drift field, the total potential energy is for (liquid phase) and for (vapor phase), where (resp. ) is the induced electric field in the liquid (resp. vapor) phase.
Experimental data has been collected on the extraction of quasi-free electrons from liquid into gaseous Argon borghesani90 . The potential felt by such electrons is illustrated in Figure 2. It is plotted in units of where K is the temperature of the liquid Argon at normal pressure. Photoelectric effect measurements indicate that the electrons in the liquid are shifted by an amount eV with respect to the energy in vacuum (or vapor) tauchert . The external drift field and the repulsive potential at the interface generate a minimum potential in the liquid phase at a distance from the interface with a value and similarly in the gas phase. The barrier height as seen from the minimum in the liquid at is therefore . The mean life time to traverse the interface (or trapping time) can be analyzed with the aid of the Smoluchowski equation rayfield71 , predicting . Experimental data however indicate that the above-calculated thermionic current is increased by a rate where is the momentum-transfer mean free path, as predicted by the Shottky model of electric field enhanced thermionic emission borghesani90 , giving , with a stronger influence of the drift field.
In the case of the ions, the potential for a positive charge is illustrated in Figure 3. The ion is attracted very near the interface and must tunnel through the repulsive potential existing on the liquid side of the interface in order to enter the liquid. A semi-classical approach is not justified. The transport of positive ions from xenon vapor to liquid was successfully reported with a efficiency in Ref. walters . There appears to be a difference in the behavior of positive ions between the liquid-to-gas and gas-to-liquid transition bruschi66 . While electrons could traverse the liquid-vapor interface the positive ions could not. This is consistent with the fact that the ion mobility in the liquid is too small to allow for the external field to enhance the thermionic emission. However, the transmission of negative ions through the liquid-vapor interface of neon has been observed with trapping time of the order of 10–100 s at fields of 0.1–1 kV/cm bruschi75 . This is explained by the type of clustering around the different species of particles. If a sort of bubble surrounds negative charges then the breaking of the bubble at the surface could let them escape. In conclusion, the phenomenon of transfer of the ions through the interface is expected to be rather complicated, not well understood and has not been measured. In the case relevant to this paper, it is likely that some fraction of the Argon ions will cross into the liquid, although possibly with long trapping times, and experimental studies are needed to assess how much. For safety, we will conservatively assume full transmission of Argon ions across the interface.
We note that competing with the process of transfer from the gas to liquid is the radial drifting of ions at the surface of the liquid-gas interface towards the edges of the volume, until they reach the field shaping electrodes. There they are neutralized by the external power supply.
We now compute the free electron lifetime due to the recombination with the accumulating ions. In the worst case considered in this paper corresponding to the “under the hill location” (see Table 3), we contemplate muons crossing the detector per second. We conservatively assume that each of these muons will vertically cross the entire drift region, hence m, that the average charge gain is (see Ref. Rubbia:2004tz ), very conservatively that , although we expect this to be a pessimistic assumption, and that the ion mobility in the range cm2/V/s ionmobs . These assumptions yield ions/cm3. Assuming a recombination rate cm3/s, consistent with measurements at the relevant electric drift fields shinsaka , implies that the electron lifetime due to ion accumulation in the medium is ms, to be compared with a maximum electron drift time ms. We stress that actual values of and are expected to increase these values even further. We conclude that in all configurations considered in this paper, charge attenuation due to recombination with ions in the medium is expected to be negligible compared to other charge attenuating effects, like e.g. attachment to electronegative impurities in the Argon Amoruso:2004ti .
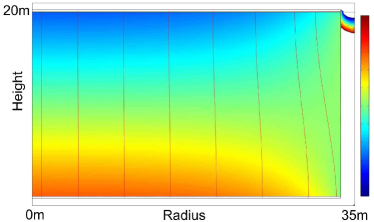
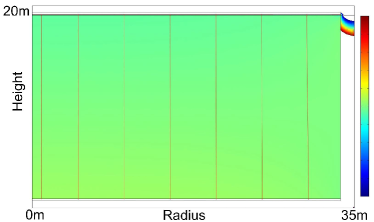
We now turn to the drift field map distortions. The results of numerical simulations for the electric field assuming a homogeneous positive charge density distribution in the liquid Argon fiducial volume of resp. ions/cm3 and ions/cm3 and the contributions of ions directly produced in the ionization process are shown in resp. Figures 4 and 5. The cathode is placed at MV and the volume is enclosed by field shaping electrodes. Dark blue corresponds to 0.5 kV/cm and red to 1.5 kV/cm. With an unrealistic ion charge density of ions/cm3= C/m3, the field is distorted by . As expected, for a more realistic charge density of ions/cm3, field variations are . The effect of ions directly produced in the ionization is negligible.
We point out in this context that the realization and successful operation on surface of a 5 m long detector column Ereditato:2005ru (ARGONTUBE) will allow to experimentally verify these hypotheses and to prove the feasibility of detectors with long drift paths, hence representing a very important milestone in the conceptual proof of the detector design.
III Simulation framework
As already pointed out in Section I, the nucleon decay searches aim at discoveries at the few event level in an atmospheric neutrino background sample of more than events. The understanding of this background will require the collection of a commensurate sample in a neutrino beam of the relevant energy.
In the meantime, a reliable MC description of all physical effects involved is important to correctly estimate nucleon decay sensitivities. Whenever possible, our results are based on full simulations. Several neutron and proton decay channels with proper treatment of nuclear effects have been simulated. Likewise, the two dominant background sources relevant to our search were simulated in details: the atmospheric neutrino background and the cosmic muon-induced background. The next sections describe this in more details.
III.1 Detector geometry and simulation
We considered as reference detector a homogeneous volume of liquid Argon in a single giant volume composed of a cylindrical volume of 20 m height and 70 m diameter for a total of 100 kton. This geometry was implemented in a full simulation based on the GEANT4 toolkit Allison:2006ve ; Agostinelli:2002hh .
For each event generated within the liquid Argon volume, final state particles are transported through the medium, with the possibility of secondary interactions. The detector effects have been included in the production and transport of the events by simulating the liquid Argon response. For ionizing particles, the deposited energies in microscopic sub- volumes of Argon are used to compute the amount of ionization Amoruso:2004dy and scintillation yields Cennini:1999ih . Ionization charge is collected in two perpendicularly segmented striped readout planes with 3 mm pitch. This information is digitized taking into account the response of a typical potential charge readout electronic preamplifier and is used to create the two perpendicular charge readout views. Scintillation light is propagated through the medium and collected on photodetectors located on the inner surface of the detector 111The scintillation light signal has not being used in the present analysis, but will in the case of the actual experiment yield the of the event, allowing to reconstruct the position of the event along the drift direction..
III.2 Nucleon decay signal simulation
Several neutron and proton decay channels have been studied (see Section IV). For each channel, 2000 signal events were generated and fully simulated inside the detector. Nucleon decay events are characterized by a definite value of the total energy and by the fact that the total momentum of the decay products must be zero. These features, which are true for the decay of a free nucleon, are only approximately verified for a nucleon bound in a nucleus.
The nuclear effects, the distortions of the energy and momentum distributions due to Fermi motion (since the recoil nucleus is not measured), and the reinteraction of decay particles with the nucleus have been treated with the FLUKA Ferrari:2005zk package. The treatment is similar to that used for nuclear effects in neutrino interactions, see e.g. Ref. Battistoni:2006da , and will be used also in the the context of simulation of atmospheric neutrino background (see Section III.3).
In a given signal event, energy and relative orientation of the decay products are selected according to conservation laws and phase space. The resulting configuration is inserted into the target nucleus and used as initial step for the PEANUT Ferrari:2005zk simulations. The position of the decaying nucleon in the nucleus is sampled from a probability distribution proportional to the density profile for the selected nucleon type. The Fermi motion of the original nucleon is then sampled according to the local Fermi distribution. The decay products are followed like any other secondary particle in PEANUT, thus exploiting all the details of its nuclear modeling, as described in the following paragraphs. See Ref. Ferrari:2005zk and references therein for full details.
Nuclear effects in nucleon decays can be roughly divided into those of the nuclear potential and those due to reinteractions of decay products. Bound nucleons in nuclei are subject to a nuclear potential. The Fermi energy (or momentum) must be calculated from the bottom of this nuclear potential well, and the removal of a nucleon from any stable nucleus is always an endothermic reaction. When a nucleon decays, some energy is spent to take it out of this well: the minimum energy is given by the nucleon separation energy (around 8 MeV), and corresponds to the decay of a nucleon at the Fermi surface. In this case, the daughter nucleus is left on its ground state. More deeply bound nucleons decay leaving a hole in the Fermi sea, that corresponds to an excitation energy of the daughter nucleus, and an additional loss of energy of the decay products. This energy is then spent in evaporation and/or gamma deexcitation. Thus, the invariant mass of bound nucleon decay products is expected to be always slightly smaller than the free nucleon mass, and spread over a range of about 40 MeV. Correspondingly, the Fermi momentum of the decaying nucleon is transferred to the decay products and compensated by the recoil of the daughter nucleus. Additional momentum distortions come from the curvature of particle trajectories in the nuclear potential.
Reinteractions in the nuclear medium also play an important role. Decay products can lose part of their energy in collisions, or even be absorbed in the same nucleus where they have been created. This is particularly true for pions, that have an important absorption cross section on nucleon pairs, while kaons have smaller interaction probability.
Nucleon-nucleon total cross sections, both elastic and inelastic, used in FLUKA are taken from available experimental data. Elastic scattering is explicitly performed according to the experimental differential cross sections. Pion induced reactions are more complex, mainly because of two- and three-nucleon absorption processes. Above the pion production threshold, the inelastic interactions are handled by the resonance model. Other pion-nucleon interactions proceed through the non-resonant channel and the p-wave channel with the formation of a resonance, with modified resonance parameters taking into account nuclear effects.
The conservation of strangeness leads to very different interactions of the K+, K0 and K-, with nucleons at low energies. K- have a large cross section for hyperon production, with the and channels always open. A detailed treatment of interactions has been developed in PEANUT, whereby the nucleon system is described by phase shift analysis. This treatment was used in the present analysis, where it was very relevant for the nucleon decays involving kaons. In particular, involved in proton decays are below 700 MeV/c, where the inelastic contributions are very small and elastic scattering does not affect strongly the efficiency. Charge exchange can lead to a loss of efficiency. In the simulations of decays, less than 4% of the kaons were lost due to nuclear processes (see Section IV). In comparison, in the simulated decays, the neutral pion is absorbed within the nucleus with a probability of %.
In the treatment of nuclear reinteractions, the cross-sections are modified to avoid too short mean free paths in nuclear matter by taking into account Pauli blocking, antisymmetrization of fermions, hard-core effects and formation zone or coherence length for non-fragmenting processes. The intra-nuclear cascade step goes on until all nucleons are below 50 MeV and is followed by a pre-equilibrium emission phase in which additional nucleons can be emitted.
Many benchmarks showing good agreement between PEANUT results and nuclear reaction data can be found in the main Ref. Ferrari:2005zk .
III.3 Atmospheric neutrino background
The atmospheric neutrino flux has been computed by several groups. We take results from the FLUKA group Battistoni:2002ew and the HKKM 2004 Honda:2004yz (Honda) models. The FLUKA model is estimated to have a 7% uncertainty for the primary spectrum, 15% for the interaction model, 1% for the atmosphere profile, 2% for the geomagnetic field and a total 17% uncertainty. The HKKM model has about 10% uncertainty when the neutrino energy is below 10 GeV, but the uncertainties are still large when the neutrino energy is above 10 GeV, due to the uncertainties of the primary cosmic ray flux and the interaction model above 100 GeV.
The neutrino-cross sections and the generation of neutrino interactions are based on the NUX NUX code. This code can be used in fixed target mode for incoming neutrino energies from MeV up to 10 TeV. NUX can generate neutral current (NC) and charged current (CC) processes, and includes all basic processes to properly describe neutrino interactions in different kinematical regimes. In particular, a distinction is made among the following processes: quasi-elastic process (QE), inelastic process (DIS) 222The DIS process includes single-pion production via baryon resonance excitation within a parton model formalism, inspired from the concept of duality. and charm production. These processes are appropriately matched to reproduce the total inclusive and existing exclusive experimental data to the best of current experimental knowledge. The mass of the outgoing lepton and of the target nucleon are taken into account in the kinematics and in the differential cross-section. In order to take into account nuclear effects, an interface with FLUKA was implemented, yielding the so-called NUX-FLUKA generator: a primary nucleon is chosen according to the density profile for the selected nucleon type and the Fermi motion of the original nucleon is sampled according to the local Fermi distribution, just as in the case of the nucleon decay simulation (see Section III.2). A neutrino interaction is generated and the final state intra-nuclear cascade is taken into account by propagating final state particles through the nucleus with PEANUT.
The NUX-FLUKA model was benchmarked with the data of the NOMAD NOMAD experiment at high neutrino energies ( GeV), and was compared at low neutrino energies ( GeV) with other available generators like NUANCE Casper:2002sd and was shown to give very similar particle multiplicities and distributions compnuance . The production of strange particle at high energy was studied in NOMAD Astier:2001vi and found to be properly described after tuning of the JETSET Sjostrand:1986hx fragmentation parameters. At low energy, the production of kaons primarily proceeds through the decay chain of baryon resonances. In this regime, the yield of kaon is very strongly suppressed compared to that of pions.
| Atmospheric | CC (evts/kt/year) | CC (evts/kt/year) | ||||
|---|---|---|---|---|---|---|
| Flux Model | DIS | QE | Tot | DIS | QE | Tot |
| FLUKA | 22.9 | 49.0 | 71.9 | 7.2 | 8.4 | 15.6 |
| ((GeV)) | (2.83) | (0.62) | (3.12) | (0.79) | ||
| HKKM | 22.7 | 45.6 | 68.3 | 7.2 | 7.8 | 15.0 |
| ((GeV)) | (3.01) | (0.64) | (3.42) | (0.85) | ||
| Atmospheric | CC (evts/kt/year) | CC (evts/kt/year) | ||||
| Flux Model | DIS | QE | Tot | DIS | QE | Tot |
| FLUKA | 42.0 | 80.1 | 122.1 | 15.3 | 18.5 | 33.8 |
| ((GeV)) | (4.53) | (0.72) | (4.89) | (0.90) | ||
| HKKM | 43.3 | 74.0 | 117.3 | 15.8 | 17.4 | 33.2 |
| ((GeV)) | (4.78) | (0.77) | (5.19) | (0.98) | ||
| Atmospheric | NC (inelastic) | NC (inelastic) | ||||
| Flux Model | (evts/kt/year) | (evts/kt/year) | ||||
| FLUKA | 23.2 | 9.0 | ||||
| ((GeV)) | (3.73) | (4.08) | ||||
| HKKM | 23.4 | 9.1 | ||||
| ((GeV)) | (3.97) | (4.40) | ||||
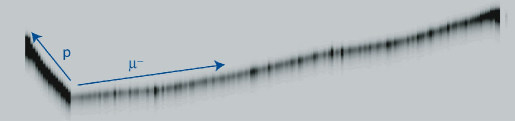
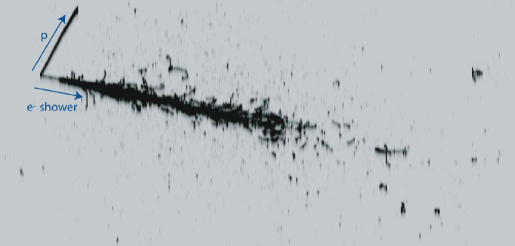
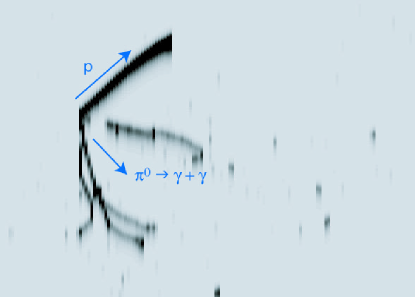
Table 2 reports the computed number of atmospheric neutrino events per neutrino flavor and per process type, normalized to an exposure of 1 ktonyear. In order to reach nucleon decay sensitivities in the range of years, exposures in the range of 1000 ktonyear will be considered. Therefore, the simulated data sets correspond to a total exposure of 1000 ktonyear or about 250’000 background events. Part of this atmospheric neutrino background sample was fully simulated and fully reconstructed. Typical atmospheric neutrino events in Argon viewed by two-dimensional charge readout planes with a pitch of 3 mm are shown in Figures 6 and 7. Full reconstruction of atmospheric neutrino events at low multiplicity is rather straight-forward. In particular, quasi-elastic events reconstruction is discussed in Ref. thesisge . Actual performance on real quasi-elastic events data can be found in Ref. Arneodo:2006ug . See also Ref. Battistoni:2006nz for a discussion of precision atmospheric neutrino measurements with a liquid Argon TPC.
In order to have the largest sample of events to estimate the backgrounds after selection cuts, a fast reconstruction program was developed which used Monte-Carlo tracks as input for pattern recognition. Energy and angular resolution of the detector were properly taken into account by means of the full simulation. On the other hand, particle reconstruction efficiency was introduced as momentum thresholds which depended on the particle type. These latter were approximately 5 MeV/c for electrons, 10 MeV/c for photons, 20 MeV/c for muons and pions, 30 MeV/c for kaons, and 300 MeV/c for protons. Checks were performed to ensure that the fast simulation reproduced the general features of the background events on the subsample of fully reconstructed events.
III.4 Cosmic muon-induced background
A second relevant source of background comes from particles produced by cosmic muons crossing and interacting in the liquid Argon volume, or muons avoiding the active liquid Argon but interacting in the vicinity of the detector. The main physical parameter determining the rate of this background is the rock overburden.
The cosmic muon intensity as a function of underground depth is obtained from Crouch’s Crouch fit to the world data and further updated by the Particle Data Group Yao:2006px . This parameterization agrees to better than 6% with the most recent MACRO measurements Ambrosio:1995cx at Gran Sasso. However, it cannot be applied to the case of a shallow depth detector. For this purpose, we generated cosmic ’s and ’s according to double differential distributions found in Ref. Yao:2006px on a large hemisphere at the surface of the Earth and transported them through rock. In the simulation, all physical processes were taken in account, including multiple scattering and energy losses.
We aimed at giving here the general trend and the magnitude of the background, while the precise determination of the muon induced background will depend on many site-specific features: (a) rock chemical composition, (b) exact distribution of rock overburden (c) detector configuration, cryostat, distance to rock, …
Many relevant processes depend on rock chemical composition. For example, the neutron production per unit of rock mass depends on the average atomic number. The expected dependence according to Ref. Boulbyflux is , i.e., that means a difference of about 25% in neutron production going from standard rock () to the salt rock (). Particle propagation through rock of secondary particles produced in muon interactions is also influenced by chemical composition, in first approximation with the same behaviour as the nuclear interaction length.
The angular distribution of muons underground depends on the actual distribution of rock overburden. If the Earth surface above the site is approximately flat, the muon intensity at an angle is given by the vertical intensity calculated at a depth multiplied by a factor from the production probability in the atmosphere Crouch . If, however, the detector is located in a mountain or under a hill, the muon intensity is determined by the actual rock overburden along any given direction. The most important effect is a different total muon intensity with respect to the flat surface case, and a secondary effect is the difference in veto efficiency (see Section III.5) due to the different muon directionality. Indeed, the deeper the rock overburden, the more vertical the surviving muons.
Since, as we will show in the following paragraphs, secondary particles that enter the detector are produced in the first one or two meters of material around it, the actual material distribution/composition of the LAr container may affect the background and the veto conditions. This effect has been neglected at this stage and we have assumed rock composition around the fiducial liquid Argon volume.
We have considered different underground depths and two different geometries (see Tables 3 and 4) in order to explore possibilities at shallow depths: (a) under flat ground cover (e.g. a green-field site 333If the rock is well known and of very good quality in a given site, a new hole in virgin ground can be considered. See nufact06 and references therein. or a mine with vertical access) at resp. approximately 3, 2, 1, 0.5, 0.13 km water equivalent, corresponding to resp. 1130 m, 755 m, 377 m, 188 m and 50 m of standard rock; and (b) detector under a hill configuration at shallow depth (see Figure 8). A green-field site, or a shallow-depth site under the hill were considered in the context of a synergy with an upgraded CNGS accelerator neutrino physics program Meregaglia:2006du .
| Depth | Code | All muons | Effective mass | ||||
| Water equiv. | Standard rock | Particles/s | Particles/10 ms | Particles/s | Particles/10 ms | ||
| Surface detector | FLUKA | 1300000 | 13000 | – | |||
| km w.e. | FLUKA | 11000 | 110 | 10000 | 100 | 50 kton | |
| km w.e. | FLUKA | 3.3 | 3.2 | 98 kton | |||
| GEANT4 | – | – | 4.2 | 98 kton | |||
| km w.e. | FLUKA | 0.66 | 0.65 | 100 kton | |||
| km w.e. | FLUKA | 6.2 | 0.062 | 100 kton | |||
| km w.e. | FLUKA | 0.01 | 0.01 | 100 kton | |||
| Under the hill (see Figure 8) | GEANT4 | – | – | 960 | 96 kton | ||
The simulations of muon-induced background were performed using FLUKA and GEANT4 toolkit and the results were compared. They were carried out in three steps: (1) in the first step we estimated the number of remaining cosmic muons crossing the detector or its vicinity per given unit time as a function of the detector’s depth or its geographical configuration; (2) then we obtained particle fluxes at the detector surface from interactions of those cosmic ray muons in the surrounding rock as a function of the detector’s depth; (3) the resulting neutron, kaon and lambda differential flux spectra, rescaled to the rate expected at a given depth, have then been used to simulate particle interactions inside the detector.
As far as FLUKA simulations are concerned, the cross section of the photo-nuclear interaction of high-energy muons is taken from Ref. Bezrukov and validation of the FLUKA models for muon transport and muon photo-nuclear interactions can be found in Refs. Boulbyflux ; FlukaWang .
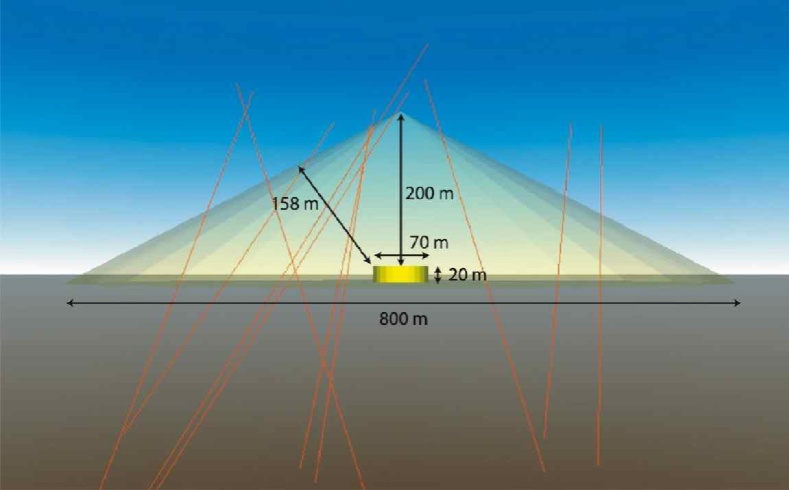
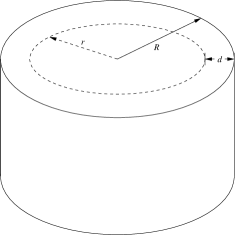
In the case of the detector under the hill, the topology of an existing location was studied 444The geography of the chosen location was estimated with the Google Earth tool. See http://earth.google.com. and a simple but conservative description of the rock profile was implemented in a GEANT4 simulation. The parameters of the geometry in a 3D image from the GEANT4 simulation are shown in Figure 8. The assumed rock overburden at the vertical of the detector is 200 m and the shortest overburden is 158 m. Cosmic ray muons were simulated on a circular area with a radius of 400 m at a height of 200 m above the detector which corresponds to the top of the hill.
The first concern is the average number of muons entering the detector within a time interval of 10 ms, which corresponds to the assumed time for a full drift over 20 m at a field of 1kV/cm Rubbia:2004tz . The results are summarized in Table 3.
The results from FLUKA and GEANT4 were compared considering a flat Earth surface profile and a detector at m underground: muon rates agreed within a factor of . At depths deeper than about 1 km w.e. the rate of crossing muons is less than 1 per 10 ms. Shallower depths e.g. at rock overburdens less than 200 m are disfavored because of detector occupancy (at 50 m rock overburden the average rate of muons with more than 1 GeV crossing in 10 ms is 100). If we assumed that a slice of size 10 cm in a 2D readout view of the detector around each crossing muon cannot be used for physics, then the rate at resp. 50 m, 188 m would correspond to an available Argon mass of resp. 50 kton, 98 kton. We do not at this stage consider surface operation, as proposed in Ref. Bartoszek:2004si . For the under the hill configuration, more than a million muons, corresponding to 156 drifts of 10 ms, were simulated and it was found that on average 9.6 muons enter the Argon volume in 10 ms. This is a factor higher than at an equivalent depth under flat surface, which is still very tolerable.
| Configuration/ | Average number ’s | Neutrons | Neutral kaons | Lambdas | |||
|---|---|---|---|---|---|---|---|
| Depth | Simulation | entering LAr | per year | per in LAr | per year | per in LAr | |
| per 10 ms | per 10 ms | per 10 ms | |||||
| km w.e. | FLUKA | 3.3 | 1.9 | 1.8 | 4500 | 4.3 | |
| (188 m rock) | |||||||
| km w.e. | FLUKA | 0.66 | 5.5 | 2.6 | 1300 | 6.2 | |
| (377 m rock) | |||||||
| km w.e. | FLUKA | 0.01 | 1.1 | 3.6 | 25 | 8.2 | |
| (1.13 km rock) | |||||||
| Under the hill | GEANT4 | 9.6 | 9.7 | 3.2 | 1.2 | 4.0 | – |
| (see Figure 8) | FLUKA rescaled | 1.2 | 4.0 | ||||
We now focus on the second step where the rate and energy spectrum of remaining cosmic ray muons at the underground locations is used to study the number of particles entering the detector. We assume that events in which the parent muon enters (before or after the photo-nuclear interaction) the active LAr volume can be discarded thanks a veto based on the liquid Argon imaging. This leads us to restrict the background sources to neutral hadrons and, in particular, to neutrons, neutral kaons and lambdas, produced either directly in muon photo-nuclear interactions or as secondary products in hadronic showers in the materials (e.g. rock) surrounding the detector. We have so far conservatively neglected correlations between neutral hadrons penetrating inside the LAr in conjunction with (visible) charged hadrons.
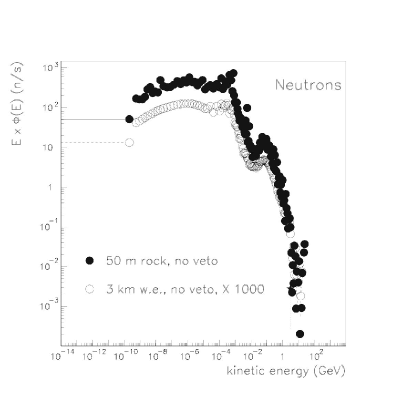
Neutral hadronic particles have been scored when entering the detector. The energy-integrated number of particles entering the detector per year of exposure at some depths are reported in Table 4. Neutron, neutral kaon and lambda energy spectra on the detector surface are plotted in Figures 9, 10 and 11. Their shapes are practically independent of the depth of rock overburden. Since low energy neutrons are not a background source for nucleon decay searches, we will consider only neutrons with kinetic energy above 20 MeV.


As expected, the particle yields per muons entering the detector, increase with depth, since the average muon energy increases as well. The neutrons yields in the FLUKA and GEANT4 simulations are consistent within a factor of 2. As far as neutral kaons are concerned, there is a difference of a factor of 10. In the case of lambda’s, they were not found in the GEANT4 simulation while in FLUKA they are expected at the level of 0.04–0.05 times the rate of neutral kaons. In the following, we will use the yields from FLUKA to estimate backgrounds.
In the third phase, neutrons, neutral kaons and lambda’s were generated with their expected energy spectrum and were transported in LAr until they underwent an inelastic interaction or decayed. These fully simulated interactions were subjected to the selection cuts and were used to estimate cosmogenic backgrounds (see Section IV.3).
III.5 An active very large area cosmic muons veto
The spatial distribution of photo-nuclear interactions in a 3 km w.e. depth from which at least one neutron enters the detector is plotted in Figure 12. Most interactions occur along the detector vertical wall, at an average distance of one meter from it. The possibility to veto cosmic muon passing in the vicinity of the detector has therefore been investigated.
We considered annular planes of active muon detectors with an inner radius of 35 m and an outer radius of 38 m, to detect muons that pass within 3 m from the LAr active volume (also here we have neglected the details of the liquid Argon tank). Two configurations have been taken into account: (a) two planes at the top and at the bottom of the LAr detector; (b) three planes as shown in Figure 1. In the simulations no assumptions are made regarding their composition, they have a thickness of 1 cm and 100% efficiency for muon crossing the counters. In practice, they could be realized with Resistive Plate Chambers (RPC) Santonico:1981sc ; Bellazzini:1985tk or Glass RPCs (GSC) Gustavino:1992fc . The total area needed is about 3800 m2 per plane. In the MONOLITH proposal monolith the total active area was envisaged to be m2. Therefore GSC had to be designed in order to allow large-scale production. For techniques on the industrial large area production of glass RPC’s see e.g. Ref. Trinchero:2003be .
From the simulation in the under the hill configuration, we obtained that about 60 of the muons enter the veto region (i.e. a volume 20 m high and 3 m wide outside the LAr detector) from the top. This value was used as a normalisation to calculate the fraction of muons detected with the two veto configurations, and the results are stated in Table 5. Even with the two veto planes configuration, more than 80 of the muons could be detected. In conclusion, an active very large area veto composed of 2 or 3 planes could suppress cosmogenic background by an order of magnitude. In the flat Earth surface geometry or at larger depths, we expect the suppression to be even stronger since muons are more vertically distributed than in the hill configuration. These results will be used in the next section to compute sensitivities to nucleon decays.
| Muons (1.6 simulated per configuration) | |||
| Configuration | in 1st veto plane | in veto volume | detected |
| Full volume | 228 | 377 | 100 |
| 3 veto planes | 231 | 361 | 94 |
| 2 veto planes | 243 | 343 | 85 |
IV Nucleon Decay Analysis
The list of studied decay channels in summarized in Table 6.
| This paper (LAr TPC) | Super-Kamiokande results Shiozawa:1998si ; Kobayashi:2005pe | ||||
| Decay | Efficiency | Atmospheric | Efficiency | Atmospheric | Published |
| mode | (%) | background | (%) | background | limit |
| 100 ktonyear | 92 ktonyear | 90% C.L. | |||
| (p1) | 45.3 | 0.1 | 40 | 0.2 | 1.6 |
| (p2) | 41.9 | 78.2 | |||
| (p3) | 96.8 | 0.1 | 8.6 (prompt-) | 0.7 | 2.3 |
| 6.0 () | 0.6 | ||||
| (p4) | 44.8 | 0.8 | 32 | 0.2 | |
| (p5) | 46.7 | 5.4 () | 0.4 | ||
| 7.0 ( method 1) | 3.2 | 1.3 | |||
| 2.8 ( method 2) | 0.3 | ||||
| (p6) | 47.0 | 9.2 () | 1.1 | 1.0 | |
| 7.9 ( method 1) | 3.6 | ||||
| 1.3 ( method 2) | 0.04 | ||||
| (p7) | 98.0 | 73 | 0.1 | ||
| (p8) | 98.0 | 51 | 0.2 | ||
| (p9) | 97.6 | 0.1 | |||
| (p10) | 18.6 | 2.5 | |||
| (n1) | 45.1 | 47.4 | |||
| (n2) | 96.0 | ||||
| (n3) | 44.4 | 0.8 | |||
| (n4) | 44.8 | 2.6 | |||
The approach to discriminate between signal and background is based on a set of sequential selection cuts. Final state topology and event kinematics provide the selection criteria. At first, we ignore the cosmic muon-induced background, and apply cuts until the atmospheric neutrino background can be considered as irreducible.
An efficient background reduction demands a good particle identification. Results based on a dedicated analysis show that the tagging efficiency of pions, kaons and protons is above 99% with contamination below 1%. In addition, the muon–pion misidentification is around 40%. The analysis, based on fully-simulated Monte-Carlo events with single particles, combines several variables in a Multi-layer perceptron Neural Network architecture: the fit to the particle hypothesis on the vs kinetic energy plane, the fitted particle mass and the energy released after the particle decay. Figure 13 shows how, thanks to the fine detector granularity, particles of different species get clearly separated. Electron and photon identification is based on an algorithm that distinguishes single m.i.p. signals versus double m.i.p. signals by using the first hits of each identified electromagnetic track.
The list of selection cuts to reduce the atmospheric neutrino contamination, final efficiencies and background estimations are described in sections IV.1 and IV.2.
We then evaluate the backgrounds due to cosmogenic events. Our strategy is to reduce the contribution from this background at the level of the irreducible atmospheric neutrino background. The amount of cosmogenic background is strongly correlated with the travel path inside the detector. Thus we will cut on the detector fiducial volume, while keeping the same topology and kinematics criteria used for the neutrino-induced background (in this way, signal selection efficiencies are unaltered). The details on the cosmic muon-induced background estimation are given in Section IV.3.
IV.1 Proton decay channels
The sequential cuts applied for each channel are briefly described in the following paragraphs. The detailed list of cuts for the considered proton decay channels are listed in Table 7. Survival fraction of signal (first column) and background events from the different atmospheric neutrino interactions after selection cuts are applied in succession are also listed. Backgrounds are normalized to an exposure of 1 Mtonyear. The final efficiencies and expected background events after cuts are reported in Table 6. The published efficiencies, backgrounds and results obtained by Super-Kamiokande are shown for comparison.
-
•
channel: A simulated decay event is shown in Figure 14. The two photons (from the decay) and the positron flying in the opposite direction are clearly visible. In the chosen readout view, the event spreads over about 120100 cm2. Figure 15 shows the distributions of the following reconstructed kinematical quantities: the electron momentum, the total momentum imbalance, the invariant mass and the total energy. The distributions are split into the case where the pion leaves the nucleus (full histograms) and the case where it is absorbed (empty histograms). The electron momentum histrogram has an arrow placed at 460 MeV/c, the expected value without Fermi motion and detector effects. It seems clear that two different set of cuts could be implemented to optimize the signal over background ratio in both cases. However, an attempt to look for “inclusive” decays without condition on the , yields order of magnitudes worse background conditions, and was not considered further.
Figure 14: Simulated event. The displayed area covers cm2. Figure 15: channel: Distributions of some kinematic variables for the exclusive (full histograms) and the inclusive (empty histograms) scenarios. The arrow in the first plot indicates the value that would have the positron momentum if no Fermi motion and no detector effects were present. The list of cuts is presented in Table 7. The idea is to have a balanced event, with all particles identified as such, and with a total visible energy close to the proton mass (see Figure 16). Only one background event for 1 Mtonyear exposure survives the cuts, for a signal efficiency of about 45%.
Figure 16: Kinematic cut in the channel: in the plane defined by the invariant mass and the total momentum, crosses represent background and spots signal events. The band indicates the cut region (0.86 GeV Total Energy 0.95 GeV), i.e. all events inside the band are accepted. Efficiency (%) Atmospheric neutrino sources Cuts (p1) CC CC CC CC NC NC One 54.0% 6604 2135 15259 5794 8095 3103 One e-shower + no other charged tracks 50.9% 1188 656 1 0 0 0 p 0.4 GeV 46.7% 454 127 0 0 0 0 0.86 GeV Evis 0.95 GeV 45.3% 1 0 0 0 0 0 Cuts (p2) CC CC CC CC NC NC No e-shower, no muons, no 92.6% 0 0 34 0 56515 26482 One charged pion 55.7% 0 0 8 0 5632 2027 No protons 50.0% 0 0 4 0 2930 1136 0.35 GeV Total E 0.65 GeV 41.9% 0 0 2 0 605 175 Cuts (p3) CC CC CC CC NC NC One kaon 96.8% 308 36 871 146 282 77 No other charged tracks, no 96.8% 0 0 0 0 57 9 Evis 0.8 GeV 96.8% 0 0 0 0 1 0 Cuts (p4) CC CC CC CC NC NC One muon, one 52.8% 0 0 11334 4452 0 0 No protons, no charged pions 50.0% 0 0 1754 1369 0 0 0.86 GeV Total E 0.93 GeV 45.3% 0 0 64 41 0 0 Total Momentum GeV 44.8% 0 0 5 3 0 0 Cuts (p5) CC CC CC CC NC NC One muon + 2 charged or 2 neutral pions 100% 8178 2771 106861 27274 7099 2540 0.4 Invariant mass of pions 0.6 GeV 97% 0 0 5 8 6 2 0.6 GeV 93.4% 0 0 0 0 0 0 Cuts (p6) CC CC CC CC NC NC One e-shower + 2 charged or 2 neutral pions 100% 59759 11673 31 0 2 1 0.4 Invariant mass of pions 0.6 GeV 97.0% 2 2 0 0 0 0 0.6 GeV 94.0% 0 0 0 0 0 0 Cuts (p7) CC CC CC CC NC NC One e-shower + no other charged track 100% 32434 6837 0 0 0 0 Only one photon 99.0% 110 11 0 0 0 0 pγ 0.2 GeV 98.0% 0 0 0 0 0 0 Cuts (p8) CC CC CC CC NC NC One muon + no other charged track 100% 5302 1878 54889 15872 4680 1764 Only one photon 99.0% 7 4 164 13 9 7 pγ 0.2 GeV 98.0% 0 0 0 0 0 0 Cuts (p9) CC CC CC CC NC NC One Kaon 98.8% 308 36 871 146 282 77 One muon 98.2% 1 0 867 146 0 0 No e-showers 98.2% 0 0 844 145 0 0 0.6 GeV Total E 1 GeV 97.6% 0 0 1 0 0 0 Cuts (p10) CC CC CC CC NC NC One e-shower, no muons 100% 59755 11673 0 0 0 0 Two charged pions, no protons 19.4% 714 302 0 0 0 0 0.65 GeV Total E 1 GeV 19.0% 33 8 0 0 0 0 Total Momentum 0.57 GeV 18.6% 21 4 0 0 0 0 Table 7: Detailed list of cuts for the considered proton decay channels. Survival fraction of signal (first column) and background events through event selections applied in succession. Backgrounds are normalized to an exposure of 1 Mtonyear. -
•
channel: Almost 45% of the events that belong to this channel can not be detected since the gets absorbed by the nucleus. The cuts are based on the requirement of absence of charged leptons, protons, neutral pions, the presence of one charged pion and a total energy between 350 and 650 MeV. The result is that, for a 42% efficiency, the expected background at 1 ktonyear exposure is 0.8 events.
-
•
channel: this is a quite clean channel due to the presence of a strange meson and no other particle in the final state (see Figure 17). The kaon particle identification is performed and applying the cuts listed in Table 7 yields an efficiency 97% for a negligible background. The correlation of the reconstructed invariant mass and total momentum is shown in Figure 18.
Figure 17: Simulated event. The displayed area covers cm2. Figure 18: Kinematic cut in the channel: in the plane defined by the invariant mass and the total momentum, crosses represent background and spots signal events. The band indicates the cut region (Total Energy 0.8 GeV), i.e. all events in the band are accepted. -
•
channel: Almost 53% of the times the is detected. In this case, cuts are similar to the channel. The efficiency remains high (45%), while the background is events for 1 Mtonyear.
-
•
and channels: We concentrate on final states having a K, since a large fraction of the K will leave the detector without decaying or will suffer hadronic interactions. In Figure 19 simulated events of and decays are shown, where the K decays into charged pions. A decay where K0 decays into neutral pions is shown in Figure 20. A sophisticated treatment to recover K events has been neglected at this stage. K’s mainly decay to two pions (either charged or neutral). Simple requirements (an identified lepton in the final state accompanied by two charged (neutral) pions, invariant mass of the pion system consistent with the K0 mass and total momentum below 0.6 GeV) result in a negligible background contamination for signal selection efficiencies above 90 (see Table 7). The overall efficiency for the channel is therefore ().
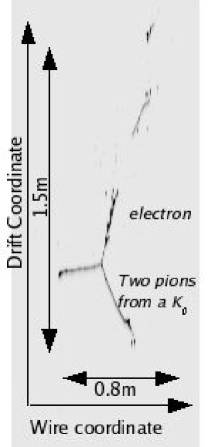
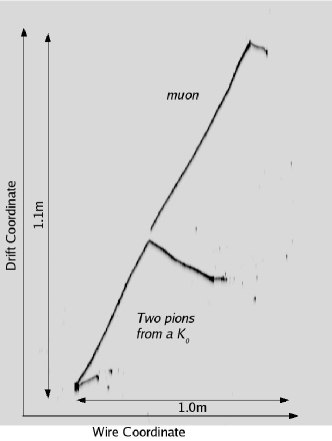
Figure 19: Simulated (left) and (right) decays. The neutral kaons decay into two charged pions. 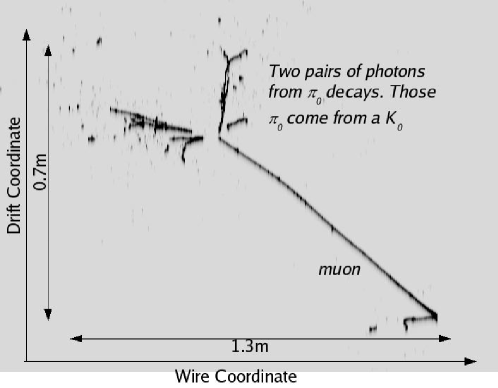
Figure 20: Simulated decay. The neutral kaon decays into two neutral pions. -
•
and channels: These channels provide a very clean signal thanks to efficient electron and photon separation (see e.g. Ref. Meregaglia:2006du for a discussion in the context of separation). The simple final event topology (a single charged lepton accompanied by an energetic photon) allows to reduce the expected background to a negligible level while keeping a signal selection efficiency close to 100 (see Table 7). Simulated events of decay and are shown in Figure 21.
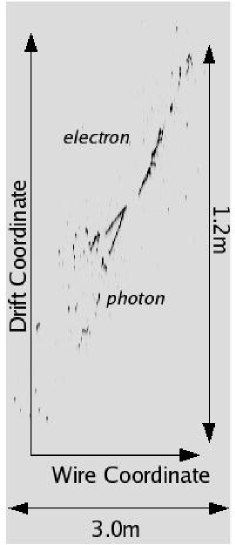
Figure 21: Simulated and decays. -
•
channel: by tagging the presence of a and a , the background is reduced at the level of 1 event for 1 Mtonyear exposure. A final cut on the total visible energy removes any background for a signal of 97%.
-
•
channel: The most favorable scenario occurs when the three particles are detected. A tight cut on the total visible energy (0.651 GeV) complemented with a cut on the total momentum (570 MeV/c) are sufficient to reduce the contamination of 25 events for a 1 Mton year exposure. On the other hand, the cuts remove less than 1% of the signal events.
IV.2 Neutron decay channels
The sequential cuts applied for each channel are briefly described in the following paragraphs. The detailed list of cuts for the considered neutron decay channels are listed in Table 8. Survival fraction of signal (first column) and background events from the different atmospheric neutrino interactions after selection cuts are applied in succession are also listed. Backgrounds are normalized to an exposure of 1 Mtonyear. The final efficiencies and expected background events after cuts are reported in Table 6.
-
•
channel: About 45% of the signal events are “invisible” because the is absorbed in the nucleus. The rest can be disentangled from the background by cutting on the total visible energy and on the total momentum (0.35 GeV). The final efficiency is 45% for 0.5 background events at 1 ktonyear exposure.
-
•
channel: We profit here from the presence of one kaon, one electron and the absence of muons and pions in the final state. These requirements, together with a loose cut on the visible energy (0.750.95 GeV), eliminates the background for an almost untouched efficiency.
-
•
channel: This channel is similar to the previously reported. When the is detected, a good efficiency can be reached for a negligible background by applying two simple cuts to bound the total energy (0.751 GeV) and the positron momentum (0.350.6 GeV).
-
•
channel: This channel is treated in a similar way to the . The distribution of the total momentum for signal and background events is shown in Figure 22 and the cuts in Table 8. We require the presence of a pion on the final state and a cut on the total energy. The plot shows the position of the last cut on total momentum. The final efficiency is 45% for the exclusive channel and almost no background events expected.
| Efficiency (%) | Atmospheric neutrino sources | ||||||
| Cuts | (n1) | CC | CC | CC | CC | NC | NC |
| One | 56.2% | 6604 | 2135 | 15259 | 5794 | 8095 | 3103 |
| No muons, no electrons, no charged pions | 56.1% | 0 | 0 | 2 | 0 | 4722 | 1840 |
| No protons | 52.6% | 0 | 0 | 0 | 0 | 2964 | 1184 |
| 0.35 GeV Total E 0.55 GeV | 45.4% | 0 | 0 | 0 | 0 | 469 | 181 |
| Total Momentum 0.35 GeV | 45.1% | 0 | 0 | 0 | 0 | 362 | 112 |
| Cuts | (n2) | CC | CC | CC | CC | NC | NC |
| One e-shower, one kaon | 97.0% | 299 | 36 | 11 | 0 | 0 | 0 |
| No , no muons | 97.0% | 138 | 14 | 0 | 0 | 0 | 0 |
| No charged pions | 97.0% | 80 | 5 | 0 | 0 | 0 | 0 |
| 0.75 GeV Total E 0.95 GeV | 96.0% | 0 | 0 | 0 | 0 | 0 | 0 |
| Cuts | (n3) | CC | CC | CC | CC | NC | NC |
| One e-shower, one charged pion | 59.6% | 8137 | 2755 | 6 | 0 | 0 | 0 |
| No , no muons, no protons | 57.4% | 3855 | 1282 | 0 | 0 | 0 | 0 |
| 0.75 GeV Total E 1 GeV | 52.4% | 499 | 187 | 0 | 0 | 0 | 0 |
| 0.35 GeV 0.6 GeV | 51.3% | 216 | 73 | 0 | 0 | 0 | 0 |
| Total Momentum 0.35 GeV | 44.4% | 7 | 1 | 0 | 0 | 0 | 0 |
| Cuts | (n4) | CC | CC | CC | CC | NC | NC |
| One muon, one charged pion | 59.4% | 1559 | 454 | 15931 | 6569 | 2291 | 1055 |
| No , no e-shower, No protons | 53.6% | 0 | 0 | 7830 | 2924 | 824 | 444 |
| 0.8 GeV E 1.05 GeV | 49.8% | 0 | 0 | 1064 | 408 | 137 | 56 |
| 0.35 GeV | 44.8% | 0 | 0 | 18 | 2 | 5 | 1 |
IV.3 Cosmic muon-induced background estimation
As described in Section III.4, the cosmogenic background has been computed in three steps. In the third step, neutrons, neutral kaons and lambda’s entering the detector were generated according to their expected energy spectrum. We simulated 2 events for each particle species and used values in Table 4 for normalization. The neutral particles are propagated inside the liquid Argon volume until they interact inelastically or decay. The secondary particles produced in those processes were used in the nucleon decay analysis.
As concrete examples, we discuss in detail the two proton decay channels, and , and one neutron decay channel . Other decay channels with a lepton in the final state or more constrained kinematics and topologies, will be less affected by cosmogenic backgrounds. For instance, the probability to misidentify charged pions as muons is at these momenta typically less than .
In the analysis, we started by applying loose kinematical cuts that rejected cosmogenic events clearly incompatible with nucleon decay signals thesisdai . For instance, for the channel , the expected pion energy in an ideal detector would be 0.48 GeV. We accepted charged pions with energy in the range 0.35–0.65 GeV, since the measured energy is smeared by Fermi motion and detector effects. In the case of strange mesons, we also required an identified kaon in the final state and a total energy below 0.8 GeV. In a second step, same cuts as those defined in Tables 7 and 8 were applied to estimate final background contaminations.
Table 9 summarizes for each considered channel the remaining muon-induced background level after this selection. The contamination coming from neutrons, kaons and lambdas interactions at different detector depths are shown. We found that the and backgrounds are predominantly produced by neutrons, and the background is dominated by the entering into the detector. For some channels we obtain zero events after the final cut, hence an upper limit for these events occurring in the detector is given. The induced background events appeared to be negligible in comparison to the other sources.
| Background source | Cosmogenic background reduction | ||||||
| Depth | Channel | (particles/year) | Distance cut | Fiducial mass | Background | ||
| Neutron | K0 | d (m) | (kton) | (events/year) | |||
| 0.5 km w.e. | 570 | – | – | 1.5 | 92 | 76 | |
| (188 m rock) | 450 | – | 8 | 1.7 | 91 | 46 | |
| FLUKA | – | 135 | – | 6.6 | 66 | 0.1 | |
| 1 km w.e. | 200 | – | – | 0.7 | 96 | 77 | |
| (377 m rock) | 130 | – | 2.3 | 0.75 | 96 | 47 | |
| FLUKA | – | 39 | – | 5.45 | 71 | 0.1 | |
| 3 km w.e. | 4.0 | – | – | 0 | 100 | 4.0 | |
| (1.13 km rock) | 2.6 | – | – | 0 | 100 | 2.6 | |
| FLUKA | – | 0.74 | – | 1.8 | 90 | 0.1 | |
| Under the hill | 2900 | – | – | 2.7 | 85 | 76 | |
| (see Figure 8) | 2300 | – | – | 2.9 | 84 | 46 | |
| GEANT4 | – | 36–360 | – | 5.4–7.5 | 72–62 | 0.1 | |
| Under the hill | 430 | – | – | 1.3 | 93 | 76 | |
| + two veto planes | 340 | – | – | 1.5 | 92 | 46 | |
| GEANT4 | – | 5–54 | – | 3.65–5.75 | 80–70 | 0.1 | |
| Under the hill | 170 | – | – | 0.6 | 97 | 77 | |
| + three veto planes | 140 | – | – | 0.8 | 95 | 46 | |
| GEANT4 | – | 2–20 | – | 2.8–5 | 85–74 | 0.1 | |
The photo-nuclear interactions, from which at least one neutral particle enters the detector, occur mostly at an average distance of one meter from the detector walls (see Figure 12). Moreover, the number of background events reduces itself essentially exponentially along their path inside the detector due to the self shielding properties of Argon. Therefore, an obvious action to reduce background consists on cutting on the sides of the detector, excluding events produced at a distance smaller than from the wall (see Figure 23). The fiducial volume is reduced accordingly. The value for the cut distance for each detector depth can be chosen in such a way that the remaining muon-induced background is of the same order than the irreducible atmospheric neutrino background.
In order to compute the effect of the distance cut on the background events, we consider here the most conservative situation, i.e. the incident neutral background source particles ( and ) move horizontally from the top/bottom side wall into the detector (the shortest possible way). After reaching the cut distance , the particles move along the diagonal of the inner detector cylinder (the longest possible way). We obtain then a simplified expression for the normalised background events:
| (4) |
where and are the numbers of events before and after the cut on the fiducial volume, and is an effective interaction length found to be cm for neutrons and cm for kaons from the MC simulations. With the given number of neutrino produced background events as , the cut distance can be calculated from the following equation:
| (5) |
where the is the Lambert W-function (or Omega function, inverse of ).
Table 9 summarizes, for each considered channel, the distance cuts applied together with the remaining fiducial mass. For each detector depth, the radial cut distance and the final fiducial volume to reduce cosmogenic background to the level of the irreducible atmospheric background (resp. 78.2 for , 47.4 for and 0.1 for for an exposure of 100 ktonyear) is listed. The range for kaon background is reflecting uncertainty on kaon yields due to differences between FLUKA and GEANT4 results.
We observe that the background due to charged and neutral pions can be reduced to the same level of expected neutrino-induced backgrounds without a big loss of the detector fiducial mass, even at shallow depth (1 km w.e. or equivalently 380 m of ordinary rock). The rejection of strange mesons requires harder cuts. For a 1 km w.e. depth, a reduction of 30 of the mass is expected. However the prospects for a shallow depth experiment are promising and good sensitivities for most of the analyzed channels are expected for an underground location of 1 km w.e. (see Table 10). Similar conclusions hold when a 0.5 km w.e. depth (about 200 m of ordinary rock) is considered. Clearly the situation worsens very much if we consider a position close to surface. For a 50 m rock overburden, the reduction of the pion background requires a reduction by more than of the usable Argon. The reduction of the kaon background implies that half of the available Argon should be used as shield.
Note that using an annular veto system to detect muons as explained in Section III.5, the induced background can be reduced by a factor between and (according to the number of planes used), therefore a looser cut on the distance would be needed and it would be possible to have a bigger fiducial volume. For example, the under the hill configuration with three veto planes consents to reduce the distance cut from m to m (see Table 9).
V Sensitivity to nucleon decay and comparison to Super-Kamiokande results
We summarize here the the results from the previous sections for all channels (see Table 6) and compute partial lifetime sensitivities.
In case no signal is observed, limits to proton and neutron partial lifetimes will be obtained using :
| (6) |
| (7) |
T is the exposure in kilotons year, the signal selection efficiency, and the constrained 90% CL upper limit on the number of observed signal events, taking into account the fact that there are about 2.7 protons and 3.3 neutrons in 1 kton of Argon. is found by solving the equation Yao:2006px :
| (8) |
is the Poisson function, the estimated background, for a 90% CL, and, is equal to the closest integer number to when computing the “detector sensitivity”.
| Channel | Cut | Total background | /B limit (years) | /B limit (years) |
|---|---|---|---|---|
| efficiency (%) | per year in fiducial volume | 1 year exposure | 10 years exposure | |
| (p1) | 45.3 | 0.1 | 0.5 | 0.4 |
| (p2) | 41.9 | 82 (3 km w.e.) | 0.7 | 0.3 |
| 151 (1 km w.e.) | 0.5 | 0.2 | ||
| 148 (0.5 km w.e.) | 0.5 | 0.2 | ||
| 143 (Under the hill) | 0.4 | 0.2 | ||
| 149 (Under the hill+2 veto planes) | 0.5 | 0.2 | ||
| 152 (Under the hill+3 veto planes) | 0.5 | 0.2 | ||
| (p3) | 96.8 | 0.2 (3 km w.e.) | 1.0 | 0.6 |
| 0.2 (1 km w.e.) | 0.8 | 0.6 | ||
| 0.2 (0.5 km w.e.) | 0.8 | 0.4 | ||
| 0.2 (Under the hill) | (0.8–0.7) | (0.5–0.4) | ||
| 0.2 (Under the hill+ 2 veto planes) | (0.9–0.8) | (0.5–0.5) | ||
| 0.2 (Under the hill+ 3 veto planes) | (1.0–0.8) | (0.6–0.5) | ||
| (p4) | 44.8 | 0.8 | 0.4 | 0.2 |
| (p5) | 46.7 | 0.5 | 0.5 | |
| (p6) | 47.0 | 0.5 | 0.5 | |
| (p7) | 98.0 | 1.1 | 1.1 | |
| (p8) | 98.0 | 1.1 | 1.1 | |
| (p9) | 97.6 | 0.1 | 1.1 | 0.8 |
| (p10) | 18.6 | 2.5 | 0.1 | 0.5 |
| (n1) | 45.1 | 50 (3 km w.e.) | 0.1 | 0.5 |
| 92 (1 km w.e.) | 0.1 | 0.4 | ||
| 89 (0.5 km w.e.) | 0.1 | 0.4 | ||
| 86 (Under the hill) | 0.1 | 0.3 | ||
| 90 (Under the hill+ 2 veto planes) | 0.1 | 0.4 | ||
| 91 (Under the hill+ 3 veto planes) | 0.1 | 0.4 | ||
| (n2) | 96.0 | 1.4 | 1.4 | |
| (n3) | 44.4 | 0.8 | 0.4 | 0.2 |
| (n4) | 44.8 | 2.6 | 0.4 | 0.2 |
For each nucleon decay channel we have computed the limits as a function of the exposure. This is done by rescaling the number of expected background events at each exposure, and computing the corresponding upper limit (). The result, together with the detection signal efficiency (), the total expected background and the final detector mass (after fiducial cuts) are reported in Table 10. In the channels , , and , the results at different detector depths are given separately.
The sensitivity of for protons and neutrons as a function of the exposure is illustrated in Figure 24 considering only atmospheric neutrino background (left) and including the cosmogenic background (right). In the latter case the plot is shown as a function of exposure in years since there is a reduction in fiducial mass taken into account to reduce the background according to Table 9, while the sensitivity curves without cosmogenic background are plotted as a function of the exposure in kton year.
The liquid Argon TPC, offering good granularity and energy resolution, low particle detection threshold, and excellent background discrimination, can yield good signal over background ratios in many possible decay modes, allowing to reach partial lifetime sensitivities in the range of years often in background free conditions up to exposures of 1000 ktonyear. This situation is optimal for discoveries at the few-events level. In particular:
-
•
Multi-prong decay modes like e.g. or and channels involving kaons like e.g. , and are particularly suitable, since liquid Argon imaging provides typically an order of magnitude improvement in efficiencies for similar or better background conditions compared to Super-Kamiokande results.
-
•
Up to a factor 2 improvement in efficiency is expected for modes like and thanks to the clean photon identification and separation from .
-
•
Channels like or , dominated by intrinsic nuclear effects, yield similar efficiencies and backgrounds as in Super-Kamiokande.
Thanks to the self-shielding and 3D-imaging properties of the liquid Argon TPC, these results remains valid even at shallow depths where cosmogenic background sources are important. A very large area annular active muon veto shield could be used in order to further suppress cosmogenic backgrounds at shallow depths. For example, our results show that a three plane active veto at a shallow depth of about 200 m rock overburden in the under the hill configuration yields similar sensitivity for as a 3 km w.e. deep detector.
VI Conclusions
The most direct sign for Grand Unification is the experimental detection of proton or bound-neutron decays. In order to reach partial lifetime in the relevant range, new generation massive underground detectors with fine tracking and excellent calorimetry are needed to suppress backgrounds with a good signal selection efficiency. Furthermore, the detector should be sensitive to several different channels in order to better understand the nucleon decay mechanism.
In this paper we have estimated the discovery potential of liquid Argon TPC detectors and compared it to the existing results of Super-Kamiokande. We have analyzed many possible neutron and proton decay channels and for the first time the two sources of background contamination: atmospheric neutrinos and cosmogenic backgrounds.
Our results indicate that a liquid Argon TPC, if scaled at the relevant mass scale of the order of 100 kton, offering good granularity and energy resolution, low particle detection threshold, and excellent background discrimination, can yield good signal over background ratios in many possible decay modes, allowing to reach partial lifetime sensitivities in the range of years with exposures up to 1000 ktonyear, often in quasi-background-free conditions optimal for discoveries at the few events level, corresponding to atmospheric neutrino background rejections of the order of .
Multi-prong decay modes like e.g. or and channels involving kaons like e.g. , and are particularly suitable, since liquid Argon imaging provides typically an order of magnitude improvement in efficiencies for similar or better background conditions compared to Super-Kamiokande.
Up to a factor 2 improvement in efficiency is expected for modes like and thanks to the clean photon identification and separation from .
Channels like or , dominated by intrinsic nuclear effects, yield similar efficiencies and backgrounds as in Super-Kamiokande.
Thanks to the self-shielding and 3-D imaging properties of the liquid Argon TPC, this result remains valid even at shallow depths where cosmogenic background sources are important. We consider the possibility of a very large area annular active muon veto shield in order to further suppress cosmogenic backgrounds at shallow depths.
In conclusion, we find that this class of detectors does not necessarily require very deep underground laboratories, like those typically encountered in existing or planned sites, to perform very sensitive nucleon decay searches. As a concrete example, we considered a three-plane annular active veto surrounding a detector at a shallow depth of about 200 m rock overburden in an under the hill configuration and found that it yields similar sensitivities, in particular for , as for a 3 km w.e. deep detector.
In addition to a successful completion of the required technological R&D necessary to reach the relevant mass scale of 100 kton in a cost-effective way, we point out the importance of an experimental verification of the liquid Argon TPC physics potentialities to detect, reconstruct and classify events in the relevant energy range. This experimental verification will require in addition to possible specific tests in charged particle beams, the collection and study of neutrino events in GeV range with statistics of the order of 100’000 events or more.
VII Acknowledgments
This work was in part supported by ETH and the Swiss National Foundation. AB, AJM and SN have been supported by CICYT Grants FPA-2002-01835 and FPA-2005-07605-C02-01. SN acknowledges support from the Ramon y Cajal Programme. We thank P. Sala for help with FLUKA while she was an ETH employee. We thank A. Marchionni for a careful reading of the manuscript.
References
- (1) J. Pati and A. Salam, Phys. Rev. D8, 1240 (1973).
- (2) H. Georgi and S. L. Glashow, Phys. Rev. Lett. 32, 438 (1974).
- (3) U. Amaldi, W. de Boer and H. Furstenau, Phys. Lett. B 260, 447 (1991).
- (4) P. Langacker, Phys. Rept. 72, 185 (1981).
- (5) M. Shiozawa et al. [Super-Kamiokande Collaboration], Phys. Rev. Lett. 81, 3319 (1998) [arXiv:hep-ex/9806014].
- (6) M. Shiozawa [Super-Kamiokande Collaboration], Prepared for 28th International Cosmic Ray Conferences (ICRC 2003), Tsukuba, Japan, 31 Jul - 7 Aug 2003
- (7) J.Wess and B.Zumino, Nucl. Phys. B70, 39 (1974).
- (8) K.S. Babu, J.C. Pati and F. Wilczek, Nucl. Phys. B566, 33 (2000).
- (9) Y. Hayato et al. [Super-Kamiokande Collaboration], Phys. Rev. Lett. 83, 1529 (1999) [arXiv:hep-ex/9904020].
- (10) K. Kobayashi et al. [Super-Kamiokande Collaboration], Phys. Rev. D 72, 052007 (2005) [arXiv:hep-ex/0502026].
- (11) S. Dimopoulos and H. Georgi, Nucl. Phys. B 193, 150 (1981).
- (12) N. Sakai and T. Yanagida, Nucl. Phys. B197, 533 (1982).
- (13) J. Hisano, H. Murayama, and T. Yanagida, Nucl. Phys. B402, 46 (1993), hep-ph/9207279.
- (14) P. Nath, A. H. Chamseddine, and R. Arnowitt, Phys. Rev. D32, 2348 (1985).
- (15) P. Nath and R. Arnowitt, (1998), hep-ph/9808465.
- (16) Q. Shafi and Z. Tavartkiladze, Phys. Lett. B473, 272 (2000), hep-ph/9911264.
- (17) V. Lucas and S. Raby, Phys. Rev. D55, 6986 (1997), hep-ph/9610293.
- (18) J. C. Pati, Int. J. Mod. Phys. A18, 4135 (2003), hep-ph/0305221.
- (19) K. S. Babu, J. C. Pati, and F. Wilczek, Phys. Lett. B423, 337 (1998), hep-ph/9712307.
- (20) K. S. Babu, J. C. Pati, and F. Wilczek, Nucl. Phys. B566, 33 (2000), hep-ph/9812538.
- (21) J. C. Pati, (2000), hep-ph/0005095.
- (22) J. R. Ellis, D. V. Nanopoulos, and J. Walker, Phys. Lett. B550, 99 (2002), hep-ph/0205336.
- (23) N. Arkani-Hamed, S. Dimopoulos, G. F. Giudice and A. Romanino, Nucl. Phys. B 709, 3 (2005) [arXiv:hep-ph/0409232].
- (24) A. Hebecker and J. March-Russell, Phys. Lett. B539, 119 (2002), hep-ph/0204037.
- (25) M. L. Alciati, F. Feruglio, Y. Lin, and A. Varagnolo, JHEP 03, 054 (2005), hep-ph/0501086.
- (26) I. R. Klebanov and E. Witten, Nucl. Phys. B664, 3 (2003), hep-th/0304079.
- (27) P. Nath and P. F. Perez, arXiv:hep-ph/0601023.
- (28) S. Wiesenfeldt, arXiv:hep-ph/0610273.
- (29) A. Rubbia, arXiv:hep-ph/0407297.
- (30) A. Meregaglia and A. Rubbia, JHEP 0611, 032 (2006) [arXiv:hep-ph/0609106].
- (31) A. Rubbia, “LAGUNA - Large Apparatus for Grand Unified and Neutrino Astrophysics”, Invited talk at the international workshop on Neutrino Factories, Superbeams and Betabeams NUFACT06, August 2006, Irvine (USA).
- (32) K. Nakamura, Front. Phys. 35, 359 (2000).
- (33) Y. Suzuki et al. [TITAND Working Group], arXiv:hep-ex/0110005.
- (34) C. K. Jung, AIP Conf. Proc. 533, 29 (2000) [arXiv:hep-ex/0005046].
- (35) M. V. Diwan and C. K. Jung, Prepared for International Workshop on Next Generation Nucleon Decay and Neutrino Detector (NNN 99), Stony Brook, New York, 23-25 Sep 1999
- (36) A. de Bellefon et al., arXiv:hep-ex/0607026.
- (37) T. Marrodan Undagoitia, F. von Feilitzsch, M. Goger-Neff, K. A. Hochmuth, L. Oberauer, W. Potzel and M. Wurm, Prog. Part. Nucl. Phys. 57, 290 (2006).
- (38) T. Marrodan Undagoitia et al., J. Phys. Conf. Ser. 39, 269 (2006).
- (39) C. Rubbia, CERN-EP/77-08 (1977).
- (40) E. Aprile, K. L. Giboni and C. Rubbia, Nucl. Instrum. Meth. A 241, 62 (1985).
- (41) P. Benetti et al., Nucl. Instrum. Meth. A 332 (1993) 395.
- (42) P. Cennini et al., Nucl. Instrum. Meth. A 345 (1994) 230.
- (43) F. Arneodo et al. [ICARUS-Milano Collaboration], Phys. Rev. D 74, 112001 (2006) [arXiv:physics/0609205].
- (44) S. Amerio et al., Nucl. Instrum. Meth. A 527 (2004) 329 and references therein.
- (45) S. Amoruso et al., Nucl. Instrum. Meth. A 516 (2004) 68.
- (46) S. Amoruso et al. [ICARUS Collaboration], Nucl. Instrum. Meth. A 523, 275 (2004).
- (47) A. Badertscher, M. Laffranchi, A. Meregaglia and A. Rubbia, New J. Phys. 7, 63 (2005) [arXiv:physics/0412080].
- (48) A. Badertscher, M. Laffranchi, A. Meregaglia, A. Muller and A. Rubbia, Nucl. Instrum. Meth. A 555, 294 (2005) [arXiv:physics/0505151].
- (49) A. Bueno, M. Campanelli, A. Ferrari and A. Rubbia, AIP Conf. Proc. 533 (2000) 12.
- (50) W. Haxton, “Underground laboratories”, Invited talk at the international workshop on Neutrino Factories, Superbeams and Betabeams NUFACT06, August 2006, Irvine (USA).
- (51) A. Rubbia, arXiv:hep-ph/0402110.
- (52) D. B. Cline, F. Raffaelli and F. Sergiampietri, JINST 1 (2006) T09001 [arXiv:astro-ph/0604548]. D. B. Cline, F. Sergiampietri, J. G. Learned and K. McDonald, Nucl. Instrum. Meth. A 503, 136 (2003) [arXiv:astro-ph/0105442].
- (53) L. Bartoszek et al., arXiv:hep-ex/0408121.
- (54) A. Ereditato and A. Rubbia, Nucl. Phys. Proc. Suppl. 155, 233 (2006) [arXiv:hep-ph/0510131].
- (55) A. Ereditato and A. Rubbia, Nucl. Phys. Proc. Suppl. 154, 163 (2006) [arXiv:hep-ph/0509022].
- (56) A. Rubbia, Talk given at the ISS meeting held on July 3rd, 2006.
- (57) E. Kearns et al., “A Proposal for a Detector 2 km Away From the T2K Neutrino Source”, document submitted to DOE NuSAG, May 2005.
- (58) T H Dey and T J Lewis, Brit. J. Appl. Phys., Ser 2, 1 (8), 1968, 1019 1029.
- (59) P. Nemethy, P. J. Oddone, N. Toge and A. Ishibashi, Nucl. Instrum. Meth. 212, 273 (1983).
- (60) S. R. Amendolia et al., Nucl. Instrum. Meth. A 239 (1985) 192.
- (61) L. Kaufmann and A. Rubbia, arXiv:hep-ph/0611288.
- (62) L. Bruschi, B. Maraviglia, and F.E. Moss, Phys. Rev. Lett. 17 (1966), 682.
- (63) G.W. Rayfield and W. Schoepe, Phys. Lett. A34 (1971) 133.
- (64) L. Bruschi, G. Mazzi, M. Santini, and G. Torzo, J. Phys. C: Solid State Phys., Vol. 8 (1975), 1412 .
- (65) A.F. Borghesani, G. Carugno, M. Cavenago, and E. Conti, Phys. Lett. A149 (1990), 481 .
- (66) W. Tauchert, H. Jungblut, W.F. Schmidt, Can. J. Chem., v.55, n.11 (1977) 1860.
- (67) A J Walters, J. Phys. D: Appl. Phys. 36 2743-2749.
- (68) K. Shinsaka, M. Codama, T. Srithanratana, M. Yamamoto, Y. Hatano, J. Chem. Phys., vol.88, pp. 7529–7536, 1988.
- (69) J. Allison et al., IEEE Trans. Nucl. Sci. 53 (2006) 270.
- (70) S. Agostinelli et al. [GEANT4 Collaboration], Nucl. Instrum. Meth. A 506, 250 (2003).
- (71) P. Cennini et al., Nucl. Instrum. Meth. A 432, 240 (1999).
- (72) A. Ferrari, P. R. Sala, A. Fasso and J. Ranft, CERN-2005-10 (2005), INFN/TC-05/11, SLAC-R-773 and references therein.
- (73) G. Battistoni, P. R. Sala and A. Ferrari, Acta Phys. Polon. B 37, 2361 (2006).
- (74) G. Battistoni, A. Ferrari, T. Montaruli and P. R. Sala, Astropart. Phys. 19, 269 (2003) [Erratum-ibid. 19, 291 (2003)] [arXiv:hep-ph/0207035].
- (75) M. Honda, T. Kajita, K. Kasahara and S. Midorikawa, Phys. Rev. D 70, 043008 (2004) [arXiv:astro-ph/0404457].
- (76) A. Rubbia, talk at the First International Workshop on Neutrino-Nucleus Interactions in the Few GeV Region (Nuint 01), December 2001, KEK, Tsukuba, Japan.
- (77) J. Altegoer et al. [NOMAD Coll.], Nucl. Instrum. Meth. A404, 96 (1998).
- (78) D. Casper, Nucl. Phys. Proc. Suppl. 112, 161 (2002) [arXiv:hep-ph/0208030].
- (79) D. Kielcewska and P. Przewlocki, private communication.
- (80) P. Astier et al. [NOMAD Collaboration], Nucl. Phys. B 621, 3 (2002) [arXiv:hep-ex/0111057].
- (81) T. Sjostrand and M. Bengtsson, Comput. Phys. Commun. 43, 367 (1987).
- (82) Y. Ge, PhD Thesis, No. 16894, ETH Zürich, Switzerland (2006) [unpublished]. Available at http://neutrino.ethz.ch.
- (83) G. Battistoni, A. Ferrari, C. Rubbia, P. R. Sala and F. Vissani, arXiv:hep-ph/0604182.
- (84) M. Crouch, in Proc. of the 20th International Cosmic Ray Conference (ICRC), Vol.6, p.165 (1987).
- (85) W. M. Yao et al. [Particle Data Group], J. Phys. G 33, 1 (2006).
- (86) M. Ambrosio et al. [MACRO Collaboration.], Phys. Rev. D 52, 3793 (1995).
- (87) V.A. Kudryavtsev et al., Nucl. Instr. Meth. A505, 688 (2003).
- (88) L.B. Bezrukov and E.V. Bugaev, Yad. Fiz. 33, 1195 (1981).
- (89) Y.F. Wang al., Phys. Rev. D 64, 013012 (2001).
- (90) R. Santonico and R. Cardarelli, Nucl. Instrum. Meth. 187, 377 (1981).
- (91) R. Bellazzini, C. Betti, A. Brez, E. Carboni, M. M. Massai and M. R. Torquati, Nucl. Instrum. Meth. A 247, 445 (1986).
- (92) C. Gustavino et al., Nucl. Instrum. Meth. A 315 (1992) 507.
- (93) MONOLITH Collaboration, “A Massive Magnetized Iron Detector for Neutrino Oscillation Studies , Experiment Proposal, LNGS P26/2000,CERN/SPSC 2000-031,SPSC/M657, August 15th, 2000.
- (94) G. C. Trinchero, A. Giuliano and P. Picchi, Nucl. Instrum. Meth. A 508, 102 (2003).
- (95) Z. Dai, PhD Thesis, No. 16133, ETH Zürich, Switzerland (2005) [unpublished]. Available at http://neutrino.ethz.ch.