Impact of CLAS and COMPASS data on Polarized Parton Densities and Higher Twist
Abstract
We have re-analyzed the world data on inclusive polarized DIS including the very precise CLAS proton and deuteron data, as well as the latest COMPASS data on the asymmetry , and have studied the impact of these data on polarized parton densities and higher twist effects. We demonstrate that the low CLAS data improve essentially our knowledge of higher twist corrections to the spin structure function , while the large COMPASS data influence mainly the strange quark density. In our new analysis we find that a negative polarized gluon density, or one that changes sign as a function of , cannot be ruled out on the basis of the present DIS data.
pacs:
13.60.Hb, 12.38.-t, 14.20.DhI Introduction
The European Muon Collaboration (EMC) experiment EMC at CERN found that a surprisingly small fraction of the proton spin is carried by the spin of the quarks. This observation was a big challenge to our understanding of the partonic spin structure of the nucleon, i.e., how the nucleon spin is built up out from the intrinsic spin and orbital angular momentum of its constituents, quarks and gluons. Since that time substantial efforts, both experimental and theoretical, have been made to answer this question. Our present knowledge about the spin structure of the nucleon comes mainly from polarized inclusive and semi-inclusive DIS experiments at SLAC, CERN, DESY and JLab, polarized proton-proton collisions at RHIC and polarized photoproduction experiments. One of the important and best studied aspects of this knowledge is the determination of the longitudinal polarized parton densities in QCD and their first moments groups ; LSS05 , which correspond to the spins carried by the quarks and gluons in the nucleon.
One of the features of polarized DIS is that a lot of the present data are in the preasymptotic region (). This is especially the case for the experiments performed at the Jefferson Laboratory. As was shown in LSS_HT , to confront correctly the QCD predictions to the experimental data including the preasymptotic region, the non-perturbative higher twist (powers in ) corrections to the nucleon spin structure functions have to be taken into account too.
In this paper we study the impact of the recent very precise CLAS CLAS06 and COMPASS COMPASS06 inclusive polarized DIS data on the determination of both the longitudinal polarized parton densities (PPD) in the nucleon and the higher twist (HT) effects. These experiments give important information about the nucleon structure in quite different kinematic regions. While the CLAS data entirely belong to the preasymptotic region and as one can expect they should mainly influence the higher twist effects, the COMPASS data on the spin asymmetry are large data and they should affect mainly the polarized parton densities. In addition, due to COMPASS measurements we have for the first time accurate data at small , where the behaviour of the spin structure function should be more sensitive to the sign of the gluon polarization.
II Next to leading QCD analysis of the data
In QCD the spin structure function has the following form ():
| (1) |
where ”LT” denotes the leading twist () contribution to , while ”HT” denotes the contribution to arising from QCD operators of higher twist, namely . In Eq. (1) (the nucleon target label N is dropped)
| (2) | |||||
where is the well known (logarithmic in ) NLO pQCD contribution
| (3) | |||||
and are the calculable kinematic target mass corrections TMC , which effectively belong to the LT term. In Eq. (3), and are quark, anti-quark and gluon polarized densities in the proton, which evolve in according to the spin-dependent NLO DGLAP equations. are the NLO spin-dependent Wilson coefficient functions and the symbol denotes the usual convolution in Bjorken space. is the number of active flavors ( in our analysis). In addition to the LT contribution, the dynamical higher twist effects
| (4) |
must be taken into account at low . The latter are non-perturbative effects and cannot be calculated in a model independent way. That is why we prefer to extract them directly from the experimental data. The method used to extract simultaneously the polarized parton densities and higher twist corrections to is described in LSS_HT . According to this method, the and data have been fitted using the experimental data for the unpolarized structure function
| (5) |
As usual, is replaced by its expression in terms of the usually extracted from unpolarized DIS experiments and and phenomenological parametrizations of the experimental data for NMC and the ratio of the longitudinal to transverse cross-sections R1998 are used. Note that such a procedure is equivalent to a fit to , but it is more precise than the fit to the data themselves actually presented by the experimental groups because here the data are extracted in the same way for all of the data sets. Note also, that in our analysis the logarithmic dependence of in Eq. (5), which is not known in QCD, is neglected. Compared to the principal dependence it is expected to be small and the accuracy of the present data does not allow its determination. Therefore, the extracted from the data values of correspond to the mean for each -bean (see Table II and the discussion below).
As in our previous analyses, for the input NLO polarized parton densities at we have adopted a simple parametrization
| (6) |
where on the RHS of (6) we have used the MRST99 (central gluon) MRST99 parametrizations for the NLO() unpolarized densities. The normalization factors in (6) are fixed such that are the first moments of the polarized densities. The first moments of the valence quark densities and are constrained by the baryon decay constants (F+D) and (3F-D) LSS05 assuming symmetry. Bearing in mind that the light quark sea densities and cannot, in principle, be determined from the present inclusive data (in the absence of polararized charged current neutrino experiments) we have adopted the convention of a flavor symmetric sea
| (7) |
Note that this convention only affects the results for the valence parton densities, but not the results for the strange sea quark and gluon densities.
In polarized DIS the range and the accuracy of the data are much smaller than that in the unpolarized case. That is why, in all calculations we have used a fixed value of the QCD parameter , which corresponds to , as obtained by the MRST NLO QCD analysis MRST98 of the world unpolarized data. This is in excellent agreement with the current world average alsaver .
III Results of analysis
In this section we will discuss how inclusion of the CLAS proton and deuteron data CLAS06 and the new COMPASS data on COMPASS06 influence our previous results LSS05 on polarized PD and higher twist obtained from the NLO QCD fit to the world data EMC ; world ; COMPASS05 , before the CLAS and the latest COMPASS data were available.
III.1 Impact of CLAS data
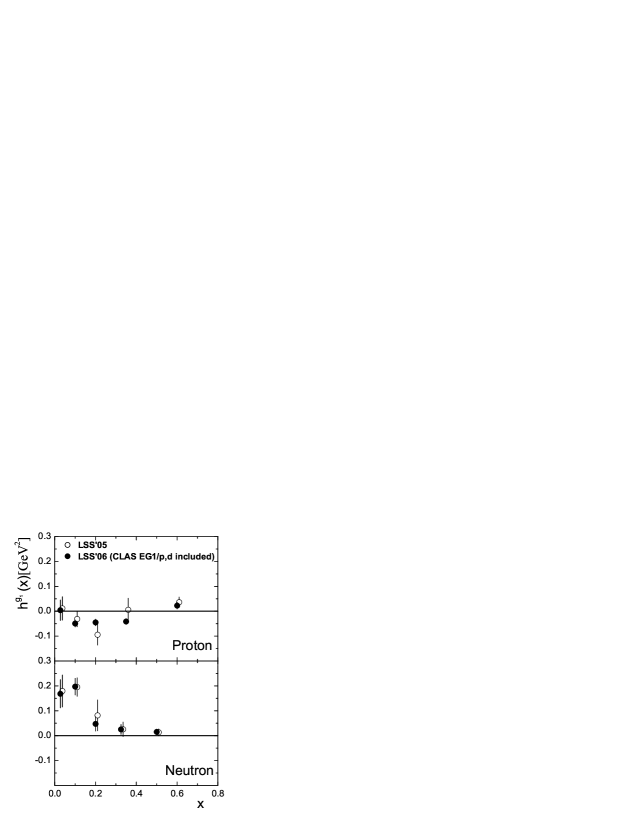
The CLAS data (633 experimental points) we have used in our analysis are high-precision data in the following kinematic region: . As the CLAS data are mainly low data where the role of HT becomes important, they should help to fix better the higher twist effects. Indeed, due to the CLAS data, the determination of HT corrections to the proton and neutron spin structure functions, and , is significantly improved in the CLAS region, compared to the values of HT obtained from our LSS’05 analysis LSS05 in which a NLO() QCD approximation for was used (see Table I). This effect is illustrated in Fig. 1. One can conclude now that the HT corrections for the proton target are definitely different from zero and negative in the region: 0.1-0.4. Also, including the CLAS data in the analysis, the HT corrections for the neutron target are better determined in the region: 0.2-0.4. Note that at was already fixed very precisely from the JLab Hall A data on the ratio .
The values obtained for the parameters of the input polarized PD are presented in Table I and compared with those of LSS’05. Note that the extracted polarized PD correspond to the Set 2 of NLO() LSS’05 PPD. As expected, the central values of the polarized PD are practically not affected by the CLAS data (see Table I). This is a consequence of the fact that at low the deviation from logarithmic in pQCD behaviour of is accounted for by the higher twist term (4) in . Indeed, if one calculates the -probability for the combined world+CLAS data set using the LSS’05 polarized PD and corresponding HT values, the result for is 938.9 for 823 experimental points, which significantly decreases to 718.0 after the fit. As seen from Table I, the best fit to the combined data is achieved mainly through the changes in the HT values. This supports the theoretical framework in which the leading twist QCD contribution is supplemented by higher twist terms of . One can see also from Table I, that the accuracy of the determination of polarized PD is essentially improved. This improvement (illustrated in Fig. 2) is a consequence of the much better determination of higher twist contributions to the spin structure function , as discussed above.
| Fit | LSS’05 (Set 2) | LSS’06 |
|---|---|---|
| 190 - 16 | 823 - 16 | |
| 154.5 | 718.0 | |
| 0.888 | 0.890 | |
| 0.926∗ | 0.926∗ | |
| 0.252 0.037 | 0.252 0.025 | |
| - 0.341∗ | ||
| 0.166 0.124 | 0.166 0.092 | |
| - 0.070 0.008 | - 0.070 0.007 | |
| 0.656 0.069 | 0.679 0.046 | |
| 0.179 0.267 | 0.296 0.197 | |
| 2.218 1.650 | 2.465 0.878 | |
| 0.028 | 0.018 0.047 | 0.004 0.040 |
| 0.100 | - 0.031 0.032 | - 0.049 0.013 |
| 0.200 | - 0.100 0.040 | - 0.045 0.012 |
| 0.350 | 0.004 0.046 | - 0.041 0.011 |
| 0.600 | 0.036 0.020 | 0.023 0.013 |
| 0.028 | 0.182 0.065 | 0.168 0.056 |
| 0.100 | 0.196 0.038 | 0.197 0.033 |
| 0.200 | 0.081 0.061 | 0.047 0.029 |
| 0.325 | 0.025 0.029 | 0.025 0.020 |
| 0.500 | 0.014 0.013 | 0.015 0.011 |
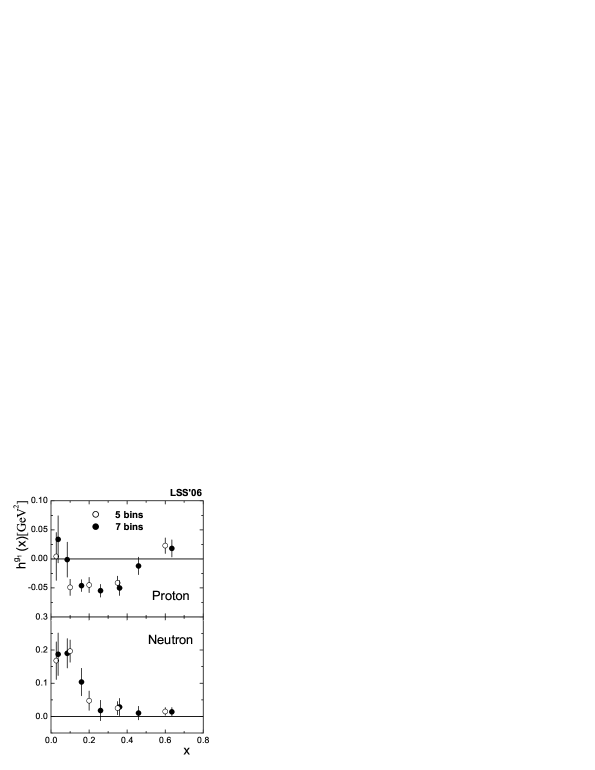
Due to the good accuracy of the CLAS data, one can split the measured region of the world+CLAS data set into 7 bins instead of 5, as used up to now, and therefore, can determine more precisely the -dependence of the HT corrections to . The numerical results of the best fit to the data using 7 -bins are listed in Table II (first column). In Fig. 3 the HT values corresponding to 5 and 7 -bins are compared. As seen in Fig. 3, the more detailed -space behaviour of the HT contribution, obtained when using 7 -bins, suggests a smoother function dependence in and will help us to calculate more precisely their first moments in the experimental region and to compare them with the predictions given by different models. This point will be discussed below.


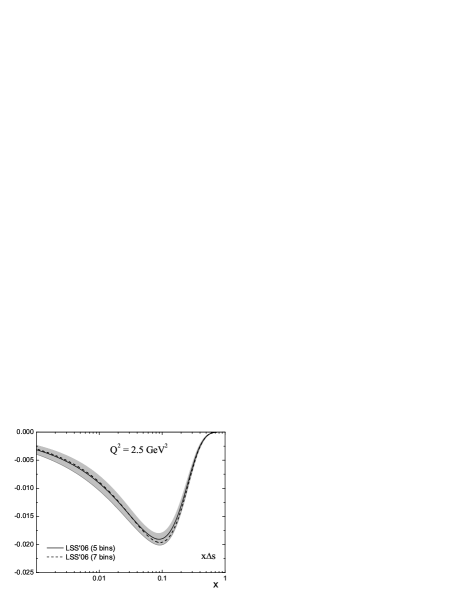
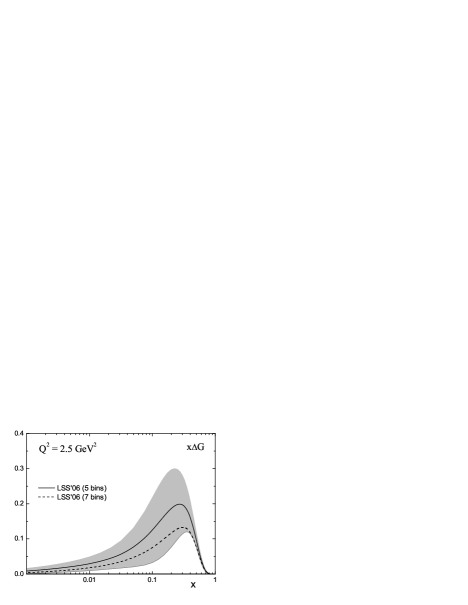
Comparing the fitted PPD parameters corresponding to 5 and 7 -bins for HT (Table I, 2nd column and Table II, 1st column, respectively), we observe that the input valence and , as well as the strange quark sea densities are practically identical. The only exception is the gluon density, but as seen in Fig. 4, the curve of the gluon density corresponding to 7 -bins lies within the error band of (5 bins). The curves corresponding to and densities cannot be distinguished in the experimental region and for that reason they are not shown in Fig. 4. Note that the curves corresponding to input at also cannot be distinguished. They became slightly different at (see Fig. 4) because of the mixture between the gluons and sea quarks due to their evolution. We consider that the small correlation between the polarized gluon density and the HT corrections we have found reflects the fact that the gluons are not well constrained from the present inclusive DIS data.
III.2 Impact of new COMPASS data
When this analysis was finished, the COMPASS Collaboration at CERN reported new data on the longitudinal asymmetry COMPASS06 . The new data are based on a 2.5 times larger statistics than those of Ref. COMPASS05 used in our analysis. In contrast to the CLAS data, the COMPASS data are at large and are the only precise data covering the low region: , where the behaviour of the spin structure function should be more sensitive to the sign of the gluon polarization. Note also, that due to the larger statistics the latest COMPASS data give more precise and detailed information about and in the above experimental region (see Fig. 5).
In view of this, we have re-analyzed the data superseding the old set of COMPASS data with the latest one in order to study the impact of the new COMPASS data on the results reported above. 7 -bins for extracting the HT values were used in the fits. The numerical results are listed in Table II. As mentioned in Section II, the logarithmic dependence of higher twist is neglected in our analysis. So, the numerical values presented in Table II correspond to the mean value of for any -bin. Keeping in mind that the higher twist values are mainly determined from the preasymptotic region (), the mean values in Table II correspond to the experimental points for each -bin with .
| Fit | LSS’06 (old COMPASS) | LSS’06 (new COMPASS) | ||
| 823 - 20 | 826 - 20 | 826 - 20 | ||
| 716.2 | 721.7 | 722.9 | ||
| 0.892 | 0.895 | 0.897 | ||
| 0.926∗ | 0.926∗ | 0.926∗ | ||
| 0.264 0.027 | 0.273 0.028 | 0.273 0.028 | ||
| - 0.341∗ | ||||
| 0.172 0.118 | 0.202 0.118 | 0.160 0.108 | ||
| - 0.070 0.006 | - 0.063 0.005 | - 0.057 0.010 | ||
| 0.674 0.053 | 0.715 0.052 | 0.746 0.088 | ||
| 0.173 0.184 | 0.129 0.166 | - 0.200 0.414 | ||
| 2.969 1.437 | 3.265 1.668 | 0.698 0.806 | ||
| 0.028 | 2.0 | 0.034 0.040 | 0.010 0.039 | 0.017 0.041 |
| 0.075 | 2.4 | - 0.001 0.030 | - 0.016 0.030 | - 0.019 0.037 |
| 0.150 | 1.7 | - 0.046 0.010 | - 0.050 0.009 | - 0.056 0.018 |
| 0.250 | 1.8 | - 0.055 0.011 | - 0.059 0.010 | - 0.067 0.013 |
| 0.350 | 2.4 | - 0.050 0.013 | - 0.054 0.012 | - 0.060 0.013 |
| 0.450 | 3.2 | - 0.012 0.015 | - 0.016 0.015 | - 0.020 0.015 |
| 0.625 | 4.1 | 0.018 0.015 | 0.016 0.015 | 0.014 0.015 |
| 0.028 | 1.8 | 0.187 0.064 | 0.165 0.064 | 0.180 0.065 |
| 0.075 | 2.4 | 0.190 0.044 | 0.173 0.044 | 0.174 0.049 |
| 0.150 | 1.4 | 0.104 0.041 | 0.107 0.039 | 0.092 0.040 |
| 0.250 | 1.5 | 0.018 0.030 | 0.019 0.030 | 0.006 0.029 |
| 0.350 | 2.2 | 0.028 0.026 | 0.031 0.025 | 0.019 0.023 |
| 0.450 | 3.0 | 0.010 0.020 | 0.013 0.020 | 0.005 0.019 |
| 0.625 | 3.9 | 0.014 0.013 | 0.016 0.013 | 0.012 0.012 |
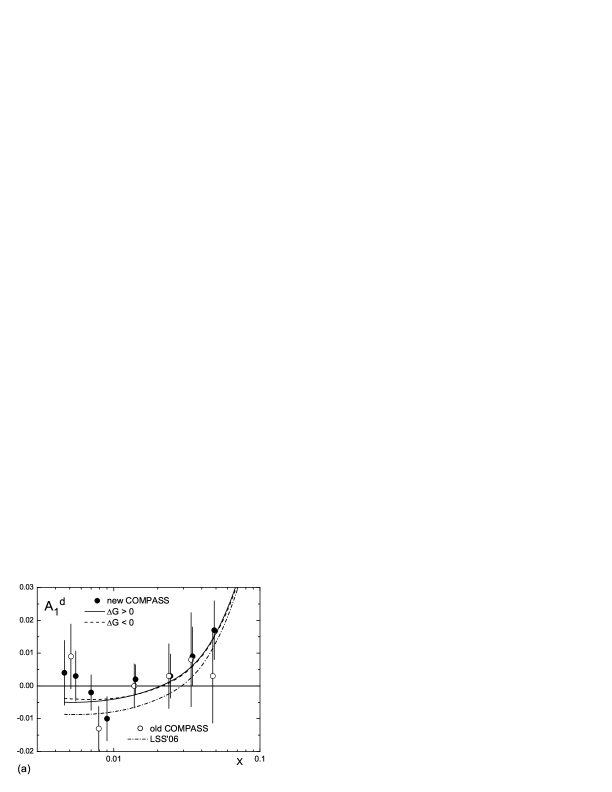


The QCD theoretical curves for corresponding to the best fits to the data with positive and negative gluon polarization are shown in Fig. 5(a). The old COMPASS data and calculated using the LSS’06 polarized PD and HT corrections (discussed in the previous Section), are also presented. Note that for the theoretical curves corresponding to the fits using the new or old set of the COMPASS data cannot be distinguished and for that reason this region is not shown in Fig. 5(a). The best fit to the new data is illustrated in Fig. 5(b).
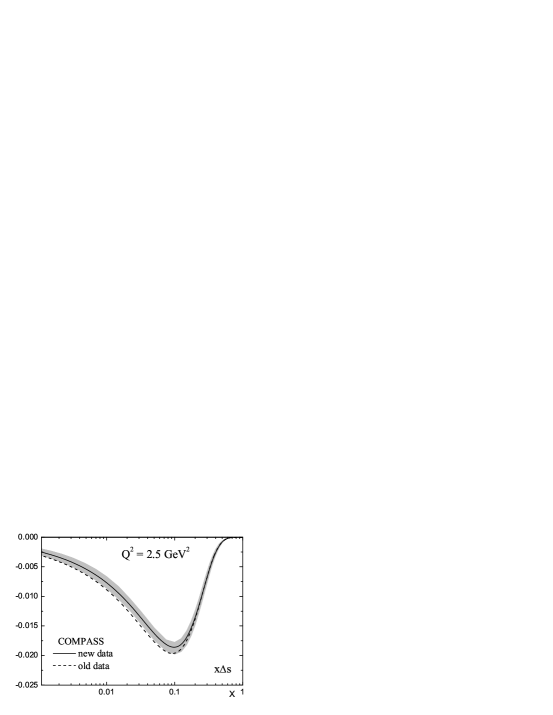
The effect of the new data on the polarized parton densities and the higher twist corrections is illustrated in Fig. 6 and Fig. 7, respectively. While and parton densities do not change in the experimental region (for that reason they are not shown in Fig. 6), the magnitudes of both the polarized gluon and strange quark sea densities and their first moments slightly decrease (see Fig. 6 and Table II). As a consequence, increases from (0.165 0.044) to (0.207 0.040) for and (0.243 0.065) for (see below the discussion about ).
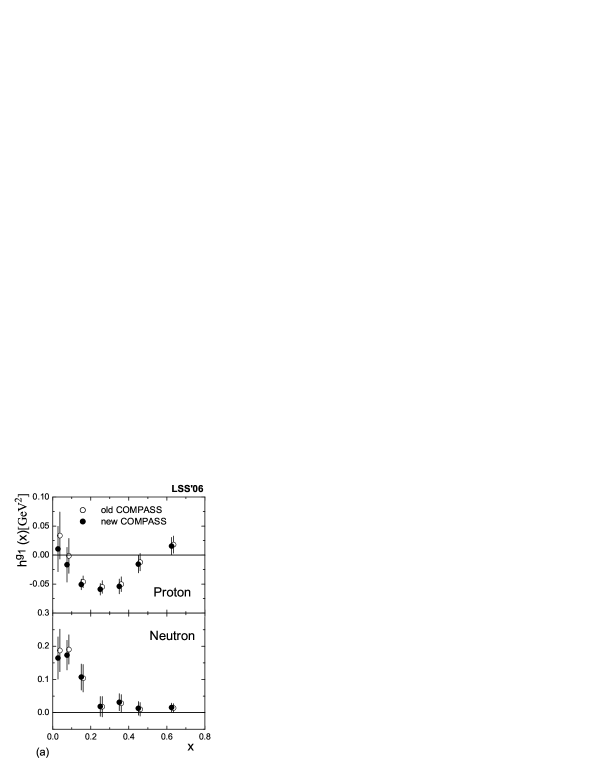
As the COMPASS data are mainly at large , the impact of the new data on the values of higher twist corrections is negligible, and as expected, they do not improve the uncertainties of HT. The new central values practically coincide with the old ones (see Fig. 7(a)). The only exception are the central values of HT at small for both the proton and the neutron targets which are slightly lower than the old ones. Note that this is the only region where the COMPASS DIS events are at small : 1-4 . As a result, in the small region two opposite tendencies occur. In order to make consistent with zero for , the HT contribution , which is positive, decreases slightly, while , which is negative, grows slightly due to the smaller negative contribution of and the smaller contribution of , convoluted with its Wilson coefficient function , which is negative in this range (see Eq. (3)).
We have also checked the stability of our results with respect to a change in , which in our analysis coincides with its current world average, as mentioned in Section II. When is varied by one standard deviation , the change of the values of the free parameters is within their errors. In particular, the change of and , the first moments of the polarized quark sea and gluon densities, is smaller than 10% of their standard deviations.
III.3 The sign of the gluon polarization
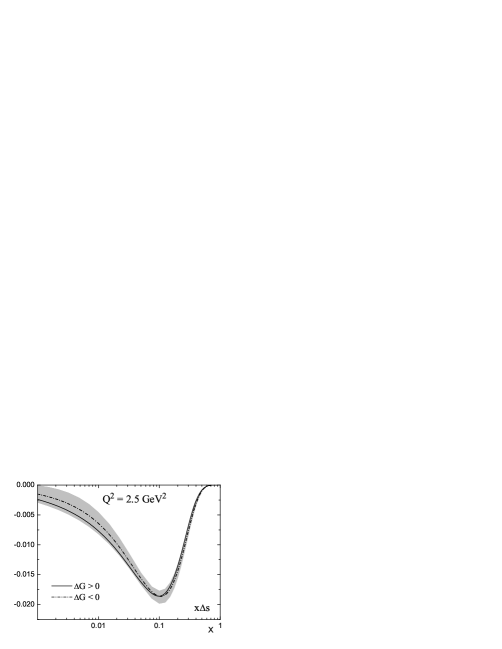
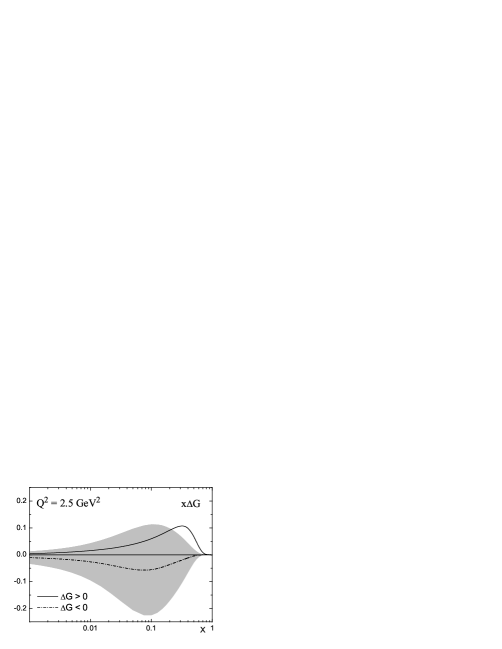
We have also studied the possibility of a negative polarized gluon density. Starting with a negative value for (the first moment for the input gluon polarized density ), we have found a minimum in corresponding to a negative solution for , and to negative and . The values of corresponding to the fits with and are practically the same (see Table II) and the data cannot distinguish between these two solutions for (see Fig. 5(a)). Note that in our previous analyses we also found solutions with negative , but they were not presented because the corresponding were significantly larger than those corresponding to the solutions with positive .
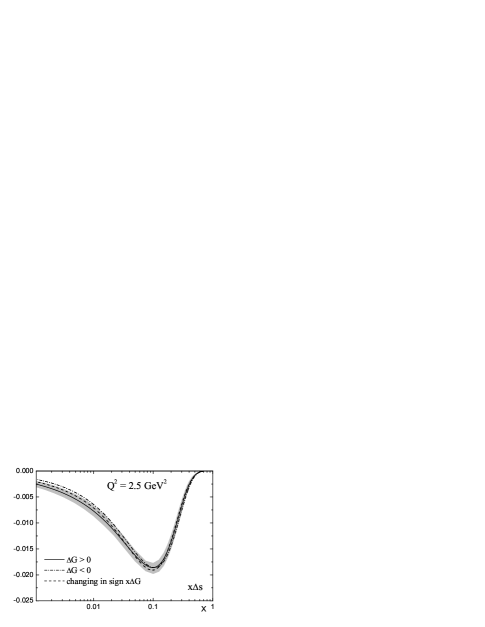
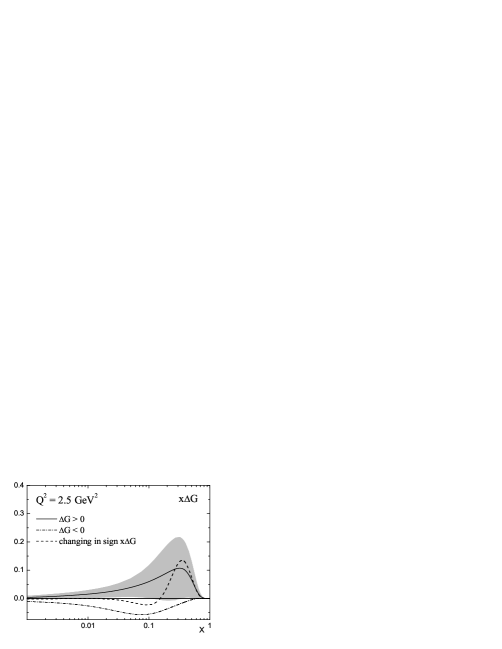
In Fig. 8 the negative polarized gluon density is compared with the positive one. As seen, the shape of the negative gluon density differs from that of positive one, but in both cases the magnitude of is small. Consequently the parton densities obtained in the fits with and are almost identical. For the strange quarks this is illustrated in Fig. 8. Thus the theoretical curves for the two types of gluon polarization are practically identical, even in the region (see Fig. 5(b)).
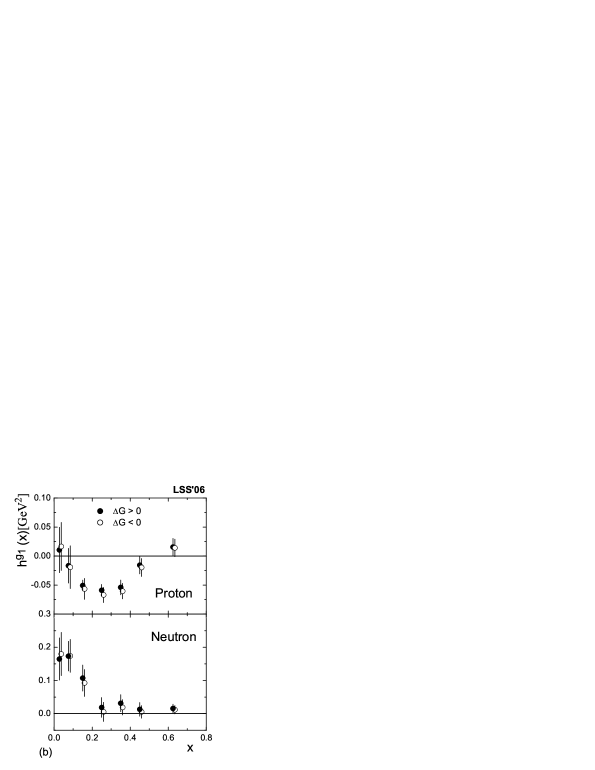
Furthermore, as seen in Fig. 7(b), the extracted HT values corresponding to the fits with and , are effectively identical. Thus also the total theoretical expression is essentially the same for and , even at very small .
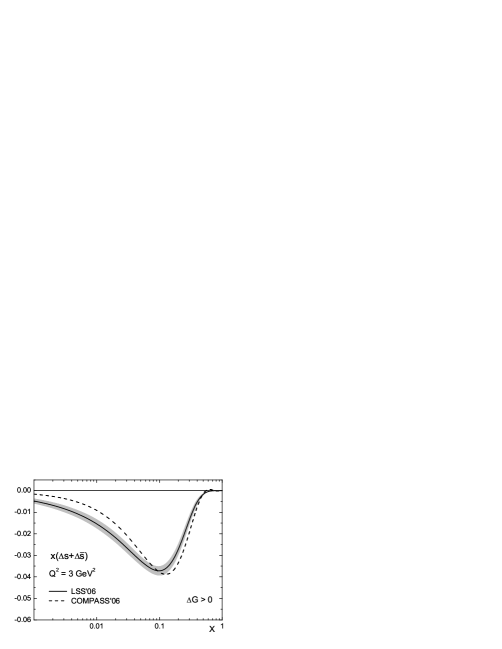
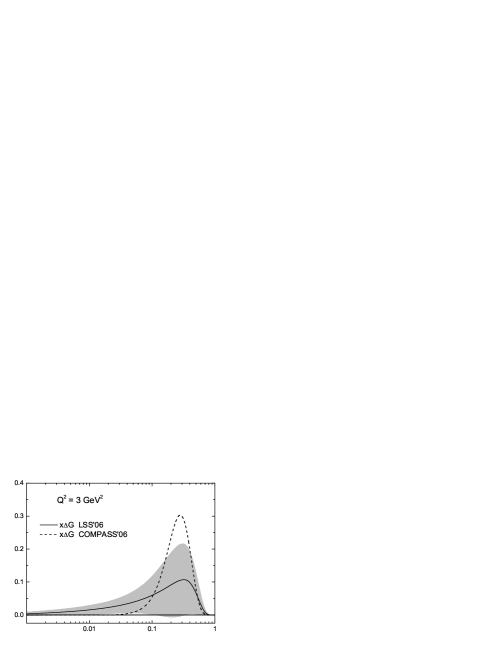
These results are in contrast to those obtained in the COMPASS analysis COMPASS06 where there is a significant difference between the theoretical curves corresponding to the cases and at very small , i.e. in the region . The reason for this lies in the question of HT contributions, which are not taken into account by COMPASS. In the above region, is small () and we have found that the HT contribution to , , is positive and large, up to 40% of the magnitude of (see Fig. 5(b)). Thus what is fitted by is significantly different from what is fitted by our at small , i.e. . As a result: i) The strange quark sea densities obtained in the two analyses are different, especially in the case of (see Fig. 9 and Fig. 10). ii) The gluon densities obtained by COMPASS in both fits ( and ) are more peaked than ours.
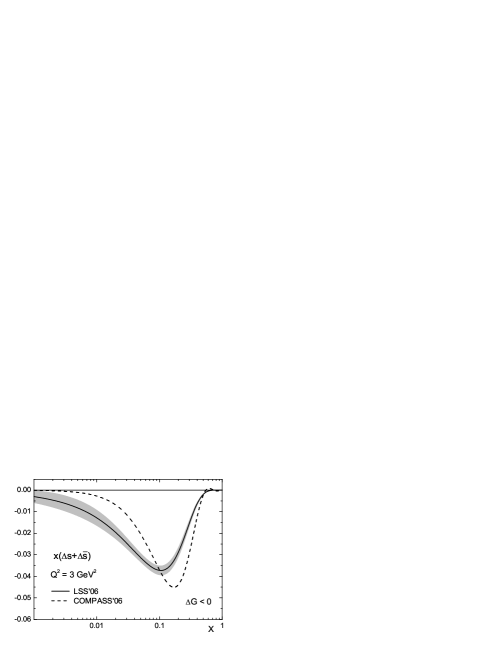
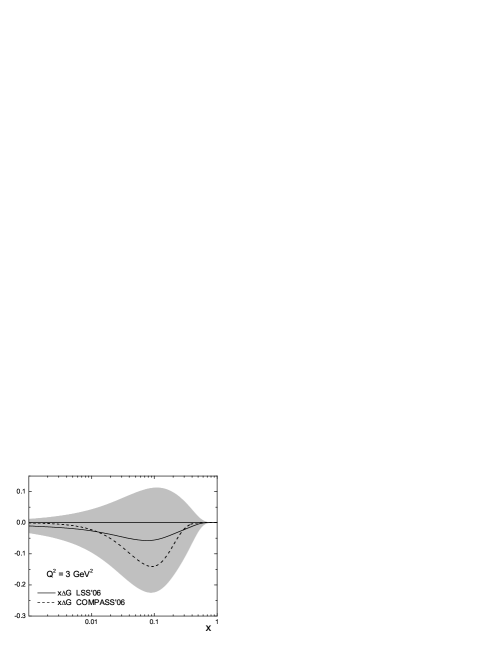
Finally, concerning the possible solution with negative we would like to point out the much larger uncertainties in the determination of the strange quark sea and gluon densities, and , and respectively, their first moments (see Fig. 11 and Table II). As seen from Fig. 11, the positive gluon density lies in the error band of the negative gluons except for larger than 0.2. corresponding to the positive solution lies entirely in the error band of .
Bearing in mind the high precision of the CLAS and new COMPASS data over a large range in we have studied the possibility to obtain from the fit to the world inclusive DIS data a gluon density which changes sign as a function of . Such a density was discussed in ch_sign_delG in order to describe the double longitudinal spin asymmetry of inclusive production in polarized p+p collisions measured by the PHENIX PHENIX and STAR STAR Collaborations at RHIC. To that end we introduced a factor in the input gluon density in (6) with two new free parameters, and , to be determined from the fit to the data. In Fig. 8, the determined strange quark and gluon densities at are compared with those corresponding to the positive and negative solutions. As seen from Fig. 8, the oscillating in sign gluon density lies between those of positive and negative . The value of per degree of freedom is 0.895, which coincides with the values obtained with purely positive or negative .
Thus, we are forced to conclude that the accuracy and range of the present DIS data is not good enough to discriminate between these three possibilities. At , the shape of the oscillating in sign polarized gluon density is consistent with that obtained by the AAC Collaboration from a combined analysis of DIS (CLAS and new COMPASS not included) and asymmetry data DISpi0 . Note, however, that compared to the central value of the first moment at , presented in DISpi0 , the central value of our is positive, 0.006, and much smaller in magnitude. Under evolution in neither , nor our changes sign, and their magnitudes increase with increasing of . As a result, the shape of the corresponding gluon densities for will follow different tendencies: becomes negative for larger with increasing of , while our gluon density for is positive for any in the experimental region (see Fig. 12).

In Fig. 13 the ratio calculated for the different obtained in our analysis and using taken from MRST02 , is compared to the existing direct measurements of dG_G_exp . (Note that the MRST’02 unpolarized parton densities were used also in the positivity constraints imposed on the polarized parton densities obtained in our analysis.) The theoretical curves are given for . The most precise value for , the COMPASS one, is well consistent with any of the polarized gluon densities determined in our analysis.

Finally, let us briefly discuss the values of the first moments of the higher twist corrections to the proton and neutron structure function . Using the values for corresponding to (second column in Table II) we obtain for their first moments in the experimental region:
| (8) |
for the proton and for the neutron target. As a result, for the non-singlet and the singlet we obtain and , respectively. The errors are total (statistical and systematic). The systematic errors are added qudratically. Note that in our notation , where and are the well known quantities, connected with the matrix elements of twist 3 and twist 4 operators, respectively d2f2 .
Our values for the first moments for the proton, neutron and are consistent within the errors with those extracted directly from the analysis of the first moments of and given in Rfs. hp , hn and hp-hn , respectively. Note that our value for the non-singlet is in agreement with the QCD sum rule estimates Balitsky:1990jb as well as with the instanton model predictions Balla:1997hf ; SidWeiss . The values obtained for the non-singlet and singlet quantities are in qualitative agreement with the relation derived in the large limit in QCD Balla:1997hf .
IV Summary
We have studied the impact of the CLAS and latest COMPASS data on the polarized parton densities and higher twist contributions. It was demonstrated that the inclusion of the low CLAS data in the NLO QCD analysis of the world DIS data improves essentially our knowledge of higher twist corrections to the spin structure function . As a consequence, the uncertainties in the longitudinal polarized parton densities become smaller. The central values of the densities, however, are not affected and they practically coincide with those of LSS’05 polarized parton densities determined from our previous analysis. In contrast to the CLAS data, the new more precise COMPASS data influence the strange quark density, but practically do not change the HT corrections. Given that the COMPASS data is mainly at large , this behaviour supports the QCD framework, in which the leading twist pQCD contribution is supplemented by higher twist terms of .
We have observed that the fit to the world data involving the CLAS and new COMPASS data yields three possible solutions for the polarized gluon density, and an changing-in-sign , which equally well describe the present DIS data. Also, all of them are in a good agreement with the directly measured quantity reported by COMPASS, although their shapes are very different. We have found that the magnitude of the gluon polarization is small, at . We have also found that the higher twist contribution to in the range is positive and large, up to 40% of the magnitude of at and therefore, is not too sensitive to the sign of the gluon polarization in the above region, when the higher twist corrections are taken into account.
Acknowledgements.
This research was supported by a UK Royal Society Joint International Project Grant, the JINR-Bulgaria Collaborative Grant, and by the RFBR (No 05-01-00992, 05-02-17748, 06-02-16215).References
- (1) J. Ashman et al. (EMC Collaboration), Phys. Lett. B 206, 364 (1988); Nucl. Phys. B328, 1 (1989).
- (2) M. Glück, E. Reya, M. Stratmann, and W. Vogelsang, Phys. Rev. D 63, 094005 (2001); J. Blumlein and H. Bottcher, Nucl. Phys. B636, 225 (2002); M. Hirai, S. Kumano, and N. Saito (AAC), Phys. Rev. D 74, 014015 (2006); D. de Florian, G.A. Navarro, and R. Sassot, Phys. Rev. D 71 094018, 2005.
- (3) E. Leader, A.V. Sidorov, and D.B. Stamenov, Phys. Rev. D 73, 034023 (2006).
- (4) E. Leader, A.V. Sidorov, and D.B. Stamenov, Phys. Rev. D 67 074017 (2003).
- (5) K.V. Dharmwardane et al. (CLAS Collaboration), Phys. Lett. B 641, 11 (2006).
- (6) V.Yu. Alexakhin et al. (COMPASS Collaboration), hep-ex/0609038.
- (7) A. Piccione and G. Ridolfi, Nucl. Phys. B513, 301 (1998); J. Blumlein and A. Tkabladze, Nucl. Phys. B553, 427 (1999); W. Detmold, Phys. Lett. B 632, 261 (2006).
- (8) M. Arneodo et al. (NMC Collaboration), Phys. Lett. B 364, 107 (1995).
- (9) K. Abe et al. (SLAC E143 Collaboration), Phys. Lett. B 452, 194 (1999).
- (10) A.D. Martin, R.G. Roberts, W.J. Stirling, and R.S. Thorne, Eur. Phys. J. C 14, 133 (2000).
- (11) A. D. Martin, R. G. Roberts, W. J. Stirling and R. S. Thorne, Eur. Phys. J. C 4, 463 (1998).
- (12) A.B. Balantekin et al. (Partical Data Group), J. Phys. G: Nucl. Part. Phys. 33, 110 (2006).
- (13) P.L. Anthony et al. (SLAC E142 Collaboration), Phys. Rev. D 54, 6620 (1996); K. Abe et al. (SLAC/E154 Collaboration), Phys. Rev. Lett. 79, 26 (1997); B. Adeva et al. (SMC Collaboration) Phys. Rev. D 58, 112001 (1998); K. Abe et al. (SLAC E143 Collaboration), Phys. Rev. D 58, 112003 (1998); P.L. Anthony et al. (SLAC E155 Collaboration), Phys. Lett. B 463, 339 (1999); 493, 19 (2000); X. Zheng et al. (JLab/Hall A Collaboration), Phys. Rev. Lett. 92, 012004 (2004); A. Airapetian et al. (HERMES Collaboration), Phys. Rev. D 71, 012003 (2005).
- (14) E.S. Ageev et al. (COMPASS Collaboration), Phys. Lett. B 612, 154 (2005).
- (15) B. Jager, M. Stratmann, S. Kretzer, and W. Vogelsang, Phys. Rev. Lett. 92, 121803 (2004); M. Hirai and K. Shodoh, Phys. Rev. D 71, 014022 (2005).
- (16) S.S. Adler et al. (PHRENIX Collaboration), Phys. Rev. Lett. 93, 202002 (2004).
- (17) F. Simon (for the STAR Collaboration), arXiv:hep-ex/0612004.
- (18) M. Hirai, S. Kumano, and N. Saito, arXiv:hep-ph/0612037.
- (19) A.D. Martin, R.G. Roberts, W.J. Stirling, and R.S. Thorne, Eur. Phys. J. C 28, 455 (2003).
- (20) B. Adeva et al. (SMC Collaboration), Phys. Rev. D 70, 012002 (2004); A. Airapetiann et al. (HERMES Collaboration), Phys. Rev. Lett. 84, 2584 (2000); E.S. Ageev et al. (COMPASS Collaboration), Phys. Lett. B 633, 25 (2006).
- (21) E.V. Shuryak and A.I. Vainshtein, Nucl. Phys. B201, 141 (1982); X.D. Ji and P. Unrau, Phys. Lett. B 333, 228 (1994).
- (22) A. Deur, arXiv:nucl-ex/0508022.
- (23) Z.-E. Meziani et al., Phys. Lett. B 613, 148 (2005).
- (24) A. Deur et al., Phys. Rev. Lett. 93, 212001 (2004).
- (25) I.I. Balitsky, V.M. Braun, and A.V. Kolesnichenko, Phys. Lett. B 242, 245 (1990), Erratum ibid B 318, 648 (1993); E. Stein et al., Phys. Lett. B 353, 107 (1995).
- (26) J. Balla, M.V. Polyakov, and C. Weiss, Nucl. Phys. B510, 327 (1998).
- (27) A.V. Sidorov and C. Weiss, Phys. Rev. D 73, 074016 (2006).