The Anatomy of the Knee and Gamma-Families
Abstract
It is shown that the fine stucture of the cosmic ray energy spectrum in the knee region, if explained by the Single Source Model ( SSM ), can, in principle, be clearly revealed and magnified in the size spectrum of extensive air showers ( EAS ) associated with gamma families. Existing experimental data on EAS at mountain level give support to this hypothesis.
1 Introduction
The combination of the original EAS technique with photosensitive materials for the study of the microstructure of EAS cores was proposed long ago [1, 2, 3]. Since then, in spite of both methods being well developed and widely used in cosmic ray ( CR ) studies they have remained basically independent of each other. However, there have been several attempts to combine them [4, 5, 6, 7, 8, 9, 10, 11] and these combinations have brought interesting results. Inspired by these results a few new projects have been proposed to use large stacks of X-ray films within EAS arrays at mountain altitudes, where the intensity and the energy content of both EAS and gamma-hadron families is much higher than at sea level [12, 13, 14]. In this paper we draw an attention to a promising opportunity offered by this technique.
2 The Single Source Model of the Knee
The Single Source Model was proposed by us to explain the fine structure of EAS size spectra in the knee region [15, 16]. Besides the sharp knee at EAS sizes corresponding to a primary energy of about 3-4 PeV, a second sharp ’peak’ ( in vs coordinates ) has been found at corresponding to an energy in the range 12-16 PeV. We attribute these structures: the knee and the second ’peak’, to a sharp cutoff of the rigidity spectrum for primary CR nuclei accelerated by a single, nearby and recent supernova. Initially, we associated the knee with the cutoff of oxygen nuclei and the second ’peak’ - with iron nuclei, although we cannot exclude now that they are caused by the energy cutoffs of helium and oxygen [16, 17, 18]. Due to the flat spectrum of the Single Source ( ) and the sharp cutoffs the peaks in fact look like lines in the EAS size spectra. However, the ’intensities’ of these lines are low and they are hardly seen above the background. We look for the possibility of increasing the ’signal to noise ratio’ in the ground-based observations using EAS associated with gamma families.
3 Gamma families initiated by primary nuclei
The standard attitude is that if one selects EAS above a threshold size or
a gamma family with a threshold total energy of gamma quanta then
they are induced preferentially by primary protons. It is true, but cannot be
extended to shower sizes much higher than the threshold . In Figure 1
we show the probability for primary protons and iron nuclei of different energies
creating EAS within a zenith angle interval containing gamma quanta
and gamma families at the Tien-Shan altitude ( 3340 m a.s.l. ). Calculations have been
made using the CORSIKA 6.014 package with the QGSGET interaction model [19].
The multiplicity of gamma-quanta in the family has been taken as
and ; the minimum energy of gamma-quanta
was 4 TeV. It is seen that:
(i) in the wide energy region the energy dependence of the probability is
stronger then the direct proportionality ;
(ii) at energies above 10 PeV, where the probability for protons to produce the
gamma family approaches 1, the corresponding probability for nuclei also approaches 1.
Therefore, beyond the knee, where according to many experiments the primary CR mass
composition is enriched by heavy nuclei, they will be also efficient in producing
gamma-families.

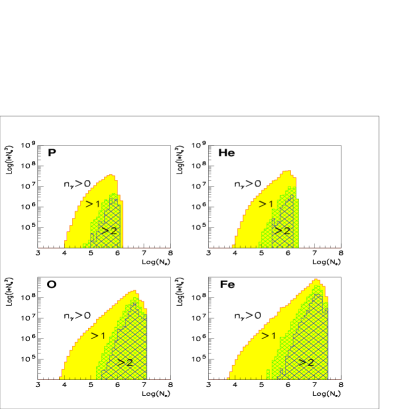
4 Size spectra of EAS containing gamma families
The SSM in common with many other models implies that different CR nuclei are accelerated by a single source up to the same maximum rigidity . In particular, in the SSM with helium dominating at the knee . In Figure 2 we show the size spectra of EAS produced by protons , helium , oxygen and iron nuclei, which can be accelerated by our Single Source. The minimum rigidity has been taken as 0.1 PV. The input conditions ( CORSIKA6.014, QGSJET, , ) were the same as described in the previous section. Energy spectra within the rigidity intervals have been taken as . Showers are shown both containing high energy gamma quanta and families, i.e. for , and without them. It is seen that due to the strong energy dependence of the probability the size spectra of EAS containing gamma quanta and gamma families are flatter than those for all showers. Since the EAS size cutoff is sharp, these spectra shown in our coordinates vs. look even more like spectral lines, than the spectra of all showers.
5 The size spectrum of EAS from the Single Source
In Figure 3 we show the spectrum of all showers and showers containing gamma quanta and gamma families for our SSM, i.e. with energy independent abundance of different nuclei as , , and for fixed rigidity.
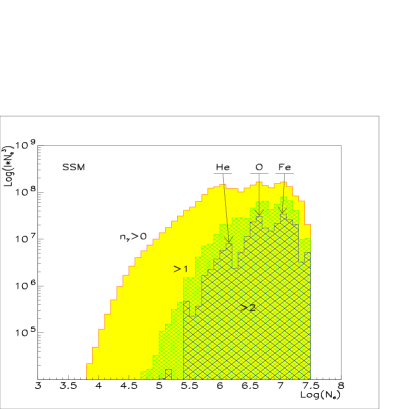
Due to sharper peaks in the individual spectra related to the energy cutoffs of different nuclei in CR from the Single Source these peaks are more distinct in the spectrum of EAS containing gamma families rather than in the total spectrum of all EAS. As can be seen in Figure 3 the excess over the smooth background in the spectrum of all showers in the logarithmic scale is about ( signal/noise ratio ), while that in the spectrum of showers containing gamma families is about ( ). Of course, the statistics of the showers with families is less than that of all showers and, besides the smooth background of the Single Source, there is a background from other sources, which reduces the ratio. However, the estimates based on our simulations show that the confidence level of detecting the signal in the size spectrum of EAS with families is about the same as in the spectrum of all EAS.
There is experimental evidence that in the knee region the size spectrum of EAS with gamma families observed at mountain altitude has sharp peaks, which are more clearly visible than irregularities in the spectrum of all showers [20]. Since this Tien-Shan experiment has the highest statistics of such showers in the world, this result deserves further analysis and the technique of the combined use of EAS detectors with X-ray films - a further development and longer exposure.
6 Conclusion
It is shown that if there is a sharp cutoff in the rigidity spectrum of accelerated nuclei, as in the Single Source Model of the knee, then the size spectrum of the EAS containing gamma families can have more distinct peaks corresponding to the cutoffs of different nuclei than the spectrum of all EAS. There is experimental evidence for the existence of such peaks and the present paper is to some extent inspired by this unique observation.
References
- [1] Brikker S.I. et al., 1958, Suppl. Nuovo Cim., 8, 733
- [2] Rappoport I.D., 1958, J. Exp. Theor. Phys., 34, 998
- [3] Grigorov N.L. et al., 1959, 6th Int. Cosm. Ray. Conf., Moscow, 1, 122
- [4] Smorodin Yu.A. et al., 1965, 9th Int. Cosm. Ray Conf., London, 2, 827
- [5] Matano T. et al., 1970, Acta Phys. Hung., 29, 451
- [6] Dake S. et al., 1970, Acta Phys. Hung., 29, 671
- [7] Dake S. et al., 1977, Nuovo Cim., 41, 55
- [8] Ohta K. et al., 1979, 16th Int. Cosm. Ray Conf., Kyoto, 13, 177
- [9] Shaulov S.B. et al., 1986, Vopr. Atom. Nauk. Techn., ser. Techn. Phys. Exp., 3(29), 72
- [10] Adamov D.S. et al., 1987, 20th Int. Cosm. Ray Conf., Moscow, 6, 144
- [11] Kawasumi N. et al., 1996, Phys. Rev. D, 53, 3534
- [12] Aoki H. et al., 2005, Nucl. Phys. B ( Proc. Suppl. ) ( to be published )
- [13] Saavedra O. and Jones L.W., 2001, Nuovo Cim. C24, 497
- [14] Amurina A. et al., 2005, Nucl. Phys. B. ( Proc. Suppl. ) ( to be published )
- [15] Erlykin A.D. and Wolfendale A.W., 1997, J. Phys. G: Nucl. Part.Phys., 23, 979
- [16] Erlykin A.D. and Wolfendale A.W., 2001, J. Phys. G: Nucl. Part.Phys., 27, 1005
- [17] Erlykin A.D. and Wolfendale A.W., 2005, Astropart. Phys., 23, 1
- [18] Erlykin A.D. and Wolfendale A.W., 2005, submitted to Phys. Lett. B
- [19] Heck D. and Knapp J., EAS Simulation with CORSIKA: A User Guide ( version 6.014 from 25.02.2002 ), FZK
- [20] Shaulov S.B., 2001, 27th Int. Cosm. Ray Conf., Hamburg, 1, 116
- [21] Vólk H.J., 2001, astro-ph/00105356
- [22] Dar A. et al. 2006, Nucl. Phys. B. ( Proc. Suppl. ), 2007 ( to be published ), astro-ph/0606199