Tau polarization effects in the CNGS appearance experiments††thanks: presented by K. Mawatari in poster session at the 4th International Workshop on Neutrino-Nucleus Interactions in the Few GeV Region (NuInt05), September 26-29, 2005, Okayama, Japan.
Abstract
We studied polarization effects on the decay distributions of produced in the CNGS appearance experiments. We show that energy and angular distributions for the decay products in the laboratory frame are significantly affected by the polarization. Rather strong azimuthal asymmetry about the momentum axis is predicted, which may have observable consequences in experiments even with small statistics.
1 INTRODUCTION
An appearance search for oscillation is expected to be performed in the CNGS (CERN Neutrino to Gran Sasso) project [1], which will start taking data from the year 2006. The project with ICARUS and OPERA detectors aims to detect -leptons produced via ’s which originate from ’s through oscillation, propagating from CERN to Gran Sasso in Italy at a distance of 732 km. ICARUS observes decay kinematically with liquid argon time projection chamber [2], while OPERA does topologically with emulsion cloud chamber [3].
Because the is identified by observing its decay products, and because the decay distribution depends crucially on its polarization, it is important to consider the spin polarization of in addition to its production cross section.
In the last report in the proceedings of NuInt04 [4], we discussed spin polarization of produced in neutrino-nucleon scattering at a fixed neutrino energy. Here, we extend to decay distributions from produced , especially for the CNGS experiments. We consider production in the neutrino-nucleon scattering and its subsequent decays, for the decay modes and ().
2 POLARIZATION OF PRODUCED
Let us start with a brief summary of spin polarization of produced via neutrino: (i) at a fixed neutrino energy [5]; (ii) in the CNGS experiments with their neutrino flux [6].
We consider production by charged current (CC) reactions off a nucleon target:
| (1) |
For the hadronic final states , we consider three subprocesses; the quasi-elastic scattering (QE), the resonance production (RES) and the deep inelastic scattering (DIS) processes. The four-momenta are parametrized in the laboratory frame as
| (2) | ||||
and the following Lorentz invariant variables are defined
| (3) |
Each subprocess is distinguished by the hadronic invariant mass : for QE, for RES. is an artificial boundary, and we regard that DIS process occurs in the regions of . We take GeV in this report.
The differential cross section and the spin polarization vector of produced are obtained in the laboratory frame as
| (4) |
and
| (5a) | ||||
| (5b) | ||||
| (5c) | ||||
where is the Fermi constant and . is defined in the rest frame in which the -axis is taken along its momentum direction and the -axis is along , the normal of the scattering plane, in the laboratory frame. It is normalized as for pure spin eigenstates. are structure functions defined with the generic decomposition of the hadronic tensor,
| (6) |
where the totally anti-symmetric tensor is defined as . These functions can be estimated for each process, QE, RES, and DIS. See explicit forms in Ref. [6].
(i) at a fixed neutrino energy
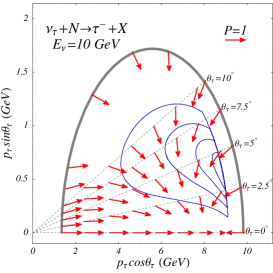
In Fig. 1, the differential cross sections , obtained from Eq. (4), at the incident neutrino energy GeV are shown as a contour map111It must be noted that this contour map differs from Fig. 3 of Ref. [4], where is plotted., where and . Only the contours of the DIS cross section are plotted to avoid too much complexity. Each contour gives the value of the differential cross section in the unit of fb/GeV2, e.g., the innermost line is for 4 fb/GeV2. The QE process contributes along the boundary, and the RES contributes just inside of the boundary. The contour shows that the contributions in the forward scattering angles in the larger side are important. In that region, the cross sections of QE and RES are also large and comparable to that of DIS.
The polarization vector , Eq. (5), of is
also shown in Fig. 1.
The length of each arrow gives the degree of
polarization () at each kinematical point and its
orientation gives the spin direction in the rest frame.
The produced ’s have high degree of polarization, but their spin
directions significantly deviate from the massless limit predictions,
where all ’s should be purely left-handed.
Since of Eq. (5) turns out to be always negative, the spin
vector points to the direction of the initial neutrino momentum axis.
Qualitative
feature of the results can be understood by considering the helicity
amplitudes in the center-of-mass (CM) frame of the scattering particles
and the effects of Lorentz boost from the CM frame to the laboratory
frame.
See more details in Ref. [5].
Let us stress that these features of the polarization of play
an important role in the following analysis.
(ii) in the CNGS experiments
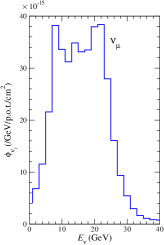
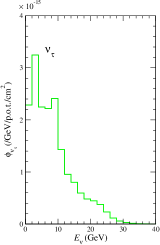
In the CNGS experiments, beam is produced at CERN-PS, which is expected to deliver protons on target (p.o.t.) per year. The beam is optimized for appearance with GeV. Figure 2 shows the expected flux,
| (7) |
at Gran Sasso with the baseline length of km from CERN. Here are the initial fluxes () [1], see Fig. 2 (left), and are the oscillation probabilities in the three-neutrino model. The fraction in the initial fluxes is less than 1%. In our analysis, we take the following values for the neutrino oscillation parameters:
| (8) |
with the constant matter density of g/cm3. Here we assume the so-called normal hierarchy.
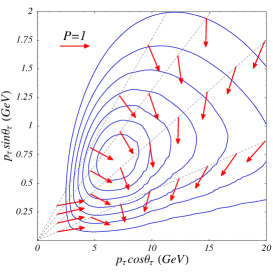
Taking into account the CNGS neutrino flux shown in Fig. 2, we show the distributions of events and polarization vectors of on the - plane in Fig. 3. The initial neutrino energy is integrated out with the incoming flux, of Eq. (7), whereas it is fixed at 10 GeV in Fig. 1. The number of production events for all the QE, RES and DIS processes is included in the contour map, where we assume 5 years with p.o.t./year of the primary proton beam and the 1.65 kton size detector, which are the current plan of the OPERA experiment [3]. Each contour gives a number of events per GeV2, e.g., the innermost line is for 7 events/GeV2. The contour map shows that there are many events around =10 GeV, and around . As for the polarization vectors, the dependence on the energy and the scattering angle of is rather smooth as compared to that in Fig. 1 because of the integration of the incident neutrino energy. However, the direction of the polarization is still non-trivial in the region which has many events.
3 TAU DECAY DISTRIBUTIONS
We present our results of the decay particle distributions from leptons produced by the CC interactions for the CNGS experiments. Main feature of our analysis is to deal with the proper spin polarization of which is calculated for each production phase space, shown in Fig. 3. In order to show the effects of the polarization on the decay distributions, we compare the results with unpolarized decays and also with completely left-handed decays.
The events of the decay distributions for are given by
| (9) |
where is the number of active targets, is the maximum value of neutrino energy in the flux, is the threshold energy to produce lepton off a nucleon, and the other integral ranges are given by
| (10) | |||
| (11) |
where
| (12) | ||||
Here, is the decay distribution for in the laboratory frame.
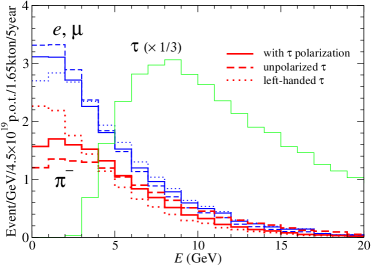
Figure 4 shows the energy distributions of (thick lines) and (medium-thick lines) decayed from produced in the neutrino-nucleon CC interactions. We assume the same configuration of the experimental setup as Fig. 3, i.e., 5 years running with p.o.t. per year of the primary proton beam and 1.65 kton size detector for the OPERA experiment [3]. For each decay mode, solid lines show the distributions from the decay of with the predicted polarization. For comparison, dashed and dotted lines show those of unpolarized and purely left-handed , respectively. The estimated number of the production with respect to the lepton energy, , is also plotted as a thin solid line. The results are calculated by using Eq. (9) with 100% particle detection efficiency for simplicity. For the above parameters, 113 events of are produced and 13 (20) of those decay into () mode.
The and distributions have peak in the low energy region, and in this region the polarization dependence becomes large. The polarization dependence is opposite between and , and is more significant in than in . In the peak region, the polarization dependence affect the distribution around 30% (15%) for the () decay mode. Expected statistics is rather small in the current design of the CNGS experiments. However, the likelihood probability of each event will be affected significantly by the polarization effects. The characteristic feature of our prediction is that the produced is almost fully polarized and that it has non-zero transverse component of the spin vector, namely of Eq. (5). The observed patterns of the and energy distributions in the laboratory frame then follow from the energy angular distributions in the polarized rest frame.
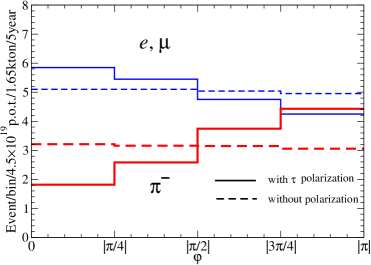
Figure 5 shows the azimuthal angle distribution of (thick lines) and (thin lines). The azimuthal angle is given by in Eq. (9), and is measured from the scattering plane where is along the direction in the laboratory frame, in which the -axis is taken along the direction of the momentum. Solid lines show the distributions from with the predicted polarization, and dashed lines show those from unpolarized . The results of purely left-handed are the same as those for the unpolarized . Since both unpolarized and purely left-handed have zero component of perpendicular polarization, they give flat azimuthal distributions. The azimuthal angle distributions can be measured by tracking the trajectory of leptons by emulsion detectors in the OPERA experiment, or by reconstructing the hadronic cascades from neutrino-nucleon scattering. As is the case of energy distribution, and decay mode show the opposite feature and polarization dependence is clearer on mode than mode. At or , the dependence of the polarization affects the distribution by about 47% (16%) for the () decay. Even though the number of event is limited, it may be possible to obtain a hint of such large asymmetries.
4 SUMMARY
In this report, we studied the effects of the spin polarization of produced in neutrino-nucleon scattering on the subsequent decay distributions, for into or modes. The spin polarization of produced via neutrino were briefly reviewed. Taking into account the polarization of produced , we showed the energy and azimuthal angle distributions of and in the laboratory frame, for the experimental setup of the CNGS long baseline project, OPERA and ICARUS experiments.
We found that the decay particle distributions in the laboratory frame are significantly affected by the polarization. Rather strong azimuthal asymmetry of and about the momentum axis is predicted, which may have observable consequences even at small statistics experiments.
Acknowledgements
K.M. would like to thank M. Sakuda for support and encouragement.
References
-
[1]
CNGS project home page,
http://proj-cngs.web.cern.ch/. -
[2]
ICARUS Collaboration home page,
http://pcnometh4.cern.ch/. -
[3]
OPERA Collaboration home page,
http://operaweb.web.cern.ch/. - [4] K. Hagiwara, K. Mawatari and H. Yokoya, Nucl. Phys. Proc. Suppl. 139 (2005) 140.
- [5] K. Hagiwara, K. Mawatari and H. Yokoya, Nucl. Phys. B 668 (2003) 364; Erratum-ibid. B 701 (2004) 405.
- [6] M. Aoki, K. Hagiwara, K. Mawatari and H. Yokoya, Nucl. Phys. B 727 (2005) 163.