Physics potential of T2KK:
An extension of the T2K neutrino oscillation experiment with a far detector in Korea
Kaoru Hagiwara1,
Naotoshi Okamura2 ,
and
Ken-ichi Senda1
1KEK Theory Division, and the Graduate University
for Advanced Studies (SOKENDAI),
Tsukuba, 305-0801 Japan 2Yukawa Institute for Theoretical Physics, Kyoto University,
Kyoto, 606-8502 Japane-mail: okamura@yukawa.kyoto-u.ac.jpe-mail: senda@post.kek.jp
Abstract
We study physics potential of placing a far detector in the east coast
of Korea,
where the off-axis neutrino beam from J-PARC at Tokai village for the T2K
project has significant intensity at a few GeV range.
In particular, we examine the capability of determining the mass hierarchy
pattern and the CP phase of the lepton-flavor-mixing matrix
when a 100 kt water erenkov detector is placed at various locations in Korea
for the off-axis beam (OAB) of and at the
Super-Kamiokande site.
The best results are found for a combination of OAB at SK
() and OAB at ,
where the mass hierarchy pattern can be determined at 3- level
for when the hierarchy is normal
(inverted), after 5 years of running ( POT).
We also find that the leptonic CP phase, , can be constrained uniquely,
without invoking anti-neutrino beams,
as long as the mass hierarchy pattern is determined.
Those results are obtained by assuming that the charged current
quasi-elastic events can be separated from the other backgrounds with high
efficiency, the neutrino energy can be reconstructed with a hundred
MeV uncertainty, and the earth matter density along the baseline can be
determined with accuracy.
YITP-06-29
KEK-TH-1091
hep-ph/0607255
1 Introduction
All the experimental results of the neutrino flavor oscillation
[1]
are consistent with 3 neutrinos
except for the LSND [2] experiment.
Among the 9 parameters of the three neutrino model, 6 parameters can
be measured by neutrino oscillation experiments:
2 mass-squared differences, 3 mixing angles and 1 CP violating phase.
As of 2006 spring,
we have already known 2 mass-squared differences and 2 mixing angles
from the atmospheric neutrino experiments [3], the
long-base-line (LBL) neutrino oscillation experiments [4, 5], the solar neutrino experiments [6, 7],
and the reactor neutrino experiments [8, 9].
However, the sign of the larger mass squared-difference (),
one of the 3 mixing angles (),
and the CP phase have not been measured yet.
The tasks of the future neutrino oscillation experiments are not only
to confirm the 3 neutrino model, but also to measure those unknown
parameters of the model.
Here we focus our attention on
one of the future neutrino experiments, the Tokai-to-Kamioka
experiment (T2K) [10]
which will start in 2008.
The center of the T2K neutrino beam from J-PARC [11] at Tokai
village will go through underground beneath Super-Kamiokande (SK), and
reach the sea level east of Korean shore.
At the baseline length km away from Tokai village
the upper side of the beam at to off-axis angle is observed at SK,
and the lower side of the same beam at to off-axis angle
can be observed in Korea
[12].
An additional far detector in Korea can probe the neutrino oscillation
at a baseline length () of 1000 to 1200 km away from the Tokai village
[12, 13, 14].
The most welcome feature of this two detector system has been identified [14]
as the relative hardness of the neutrino beam energy spectrum at a smaller off-axis angle,
which can be observed in the east coast of Korea at km.
Accordingly, it is possible to arrange such that a far detector in Korea probe
the oscillation at around the same oscillation phase, , at Kamioka.
The difference between the resulting two measurements should then come from the difference in the
matter effects, which can be a factor of three larger in Korea.
In Ref. [14], we showed that the two detector system can resolve the mass hierarchy
ambiguity by making use of the strong matter effects on the transition probability
[15, 16, 17, 18] if a 100 kt level water erenkov detector is
placed in the east coast of Korea and if the third mixing angle is not too small.
It has further been shown in [14] that the leptonic CP phase, , can be
uniquely constrained once the hierarchy pattern is determined.
In this paper we present details of our findings in Ref. [14].
The paper is organized as follows.
In section 2, we review the formalism of the neutrino oscillation
including the matter effect, as well as the constraints in the model parameters from the
present experimental results.
In section 3, we briefly introduce the T2K experiment and discuss
merits of the Tokai-to-Kamioka-and-Korea (T2KK) proposal,
where an additional large detector is placed in Korea along the T2K neutrino beam baseline.
In section 4, we explain details of our analysis method where we select
the charged current quasi-elastic events, and a function is proposed
that takes into account statistical and systematic uncertainties in the experiment,
as well as a part of possible background contaminations.
In section 5, we show the results of our numerical calculation
on the determination of the neutrino mass hierarchy.
In section 6, we present our studies on the determination of the CP phase.
In section 7, we summarize our findings and give some discussions on
the possibility of expanding the T2KK two detector system,
and the necessity of further studies on backgrounds which we could not include in the present analysis.
2 Oscillation formulae under the experimental constraints
The neutrino flavor eigenstates, ( ),
are related to the mass eigenstates ()
through the lepton-flavor-mixing matrix, or the Maki-Nakagawa-Sakata (MNS) matrix [19]
(1)
The probability that an initial flavor eigenstate with energy is observed as
a flavor eigenstate after traveling a distance in the vacuum is expressed as
(2)
where the phase is
(3)
Eq. (2) tells us
that neutrino oscillation experiments measure the
2 mass-squared differences and
the lepton-number conserving contributions of the
MNS matrix elements,
which can be parametrized by
3 mixing angles and 1 CP violating phase.
The present neutrino oscillation experiments are each sensitive to only
one of the 2 mass-squared differences, and the amplitude of each oscillation
probability can be expressed in terms of the MNS matrix elements.
The atmospheric neutrino oscillation experiments [3]
and the long-base line (LBL) neutrino oscillation experiments,
K2K[4] and MINOS [5], which measure the survival probability,
are sensitive to the magnitude of the larger mass-squared
difference.
The constraints on the mass-squared difference and the amplitude are [3, 4, 5]
(4a)
(4b)
each at the 90 confidence level.
The solar neutrino oscillation experiments [6, 7] and the KamLAND [8] experiment,
which measure the and survival probability, respectively,
are sensitive to the smaller mass-squared difference.
The present constraints can be expressed as [7]
(5a)
(5b)
In the solar neutrino experiments, the sign of is determined by
the matter effect in the sun [20, 21].
The reactor experiments at km are
sensitive to the oscillation with the larger mass-squared difference.
No reduction of the survival probability has been observed,
and the CHOOZ experiment gives the upper limit on the amplitude [9];
(6a)
(6b)
(6c)
at the 90 confidence level.
These observed amplitudes can be identified with
the MNS matrix elements as follows [22].
In the atmospheric neutrino experiments and the CHOOZ reactor experiment,
is satisfied. Therefore we can set
in eq. (2) and we find the following relations;
(7)
As for the solar neutrino experiments and the KamLAND experiment,
where the region is probed,
the terms with oscillate rapidly within the experimental resolution of .
After averaging out the contribution, and by neglecting the
term of order , which is constrained to be smaller than about 0.04 by the
CHOOZ experiment [9], eq. (6b),
we obtain the relation;
(8)
These simple identifications, eqs. (7) and (8),
are found to give a reasonably good description of the present data
in dedicated studies [23]
of the experimental constraints in the three neutrino model.
In this paper we parametrize the MNS matrix in terms of the three positive numbers,
, ,
and with the identification of eqs. (7) and (8),
respectively,
and the CP phase
(9)
This convention [22] allows us to express the MNS matrix
in terms of the three observed amplitudes, directly.
The neutrino oscillation through the earth is complicated by the fact that
and have the extra -boson exchange interactions
with electrons in the matter [20].
The effect is small at low energies, and an approximation of keeping only
the first and second order corrections
in the matter effect and the smaller mass-squared difference has been
found useful for analyzing the LBL experiments at sub
GeV to a few GeV range [24, 25].
Although we evaluate the oscillation probabilities numerically
in this report,
the following analytic expressions are found to be useful
for the T2KK setup where the earth
matter effects can be treated pertubatively.
For the survival probability,
an accurate analytic expressions is found
by retaining only those terms linear in
and the matter effect term
[25, 14]:
(10)
Here and
are the corrections to the amplitude and the oscillation phase, respectively,
which are linear in the smaller mass squared difference and the matter effect term.
These can be expressed as,
(11a)
(11b)
Here the term gives the contribution of the extra potential for
(12)
where is the electron
number density and is the
matter density.
In the second lines of
eqs. (11a), (11b),
we employ the mean values of the atmospheric and
the solar oscillation parameters in
eqs. (2) and (2),
and .
The simple analytic expressions of eqs. (10) and (10)
reproduces the survival probability accurately with 1 error
throughout the parameter range explored in this report,
except where the probability vanishes.
According to eqs. (11a), (4b), and (6b),
the magnitude of
around should be smaller than
about () at km (1000 km),
and hence
the amplitude of the survival probability is not affected much by
the matter effect.
Therefore, we can measure rather uniquely from the
disappearance probability independent of the neutrino mass hierarchy
and the other unconstrained parameters.
The phase-shift term affects the measurement of ,
whose preferred value grows (decreases) for the normal (inverted) hierarchy,
and the magnitude of the shift can be about to () when
() for .
In other words, unless we determine the hierarchy,
a few percent level of uncertainty should remain as a systematic error
of .
For the transition probability,
we need not only the linear terms of and but also
their quadratic terms to obtain a good approximation.
We find
(13)
where
, , and are the correction terms:
(14b)
(14d)
(14f)
Here in the first lines of eqs. (14b) and (14d)
follows the sign of .
The first and second terms
in eqs. (14b) and (14d)
are linear,
and the other terms including
eq. (14f)
are quadratic in and corrections.
The quadratic terms can dominate the probability when
, which gives the leading term,
is very small.
We find that the above analytic expressions,
eqs. (13) and (13),
are useful throughout the
parameter range of this report,
down to ,
except near the oscillation minimum
where the approximation can give
negative probability.
The largest deviation is found for
,
and the inverted hierarchy,
where the analytic formula underestimates
the probability by about for km.
The term proportional to in eq. (13)
is the main oscillation term in our approximation,
and shifts the magnitude of the amplitude.
From eq. (14b), we find that the amplitude of the
transition probability
is sensitive to the mass hierarchy pattern,
because the first term changes sign.
Its magnitude increases (decreases) by about for the normal
(inverted) hierarchy at km for .
The difference between the two hierarchy cases
grows with when is fixed at ,
reaching about at km.
The shift is also sensitive to , which can decrease (increase)
the amplitude by as much as for
when , independent of the mass hierarchy.
The term proportional to in eq. (13)
can be re-organized as
(15)
just like the survival formula, eq. (10),
when and are small.
Since the term shifts the oscillation phase in this limit,
we call it as the phase-shift term.
It shifts the oscillation peak energy higher
(lower)
for the normal (inverted) hierarchy,
by about at km and by about at km,
for .
The dependence of the shift is also significant,
which can be for if .
Note, however, the factorized expression eq. (15)
seizes to be a good approximation when or
gets larger than about 0.5,
which happens when ;
see eqs. (14b) and (14d).
The above observation inspires a two detector system,
where both detectors can measure oscillations around
the oscillation maximum ()
but at significantly different base-line lengths. If the magnitude of
the product of
is large enough that the oscillation is observed
at both detectors,
then the difference of the observed oscillation probabilities at the
two locations determines the
mass hierarchy uniquely, and hence also the
product rather independent of .
Once the hierarchy is determined, the measurements of the magnitude
and the phase of the oscillation
measure and , respectively,
and hence the CP violating phase can be determined uniquely.
In the following section, we will find that the T2KK two detector system can indeed satisfy
the above conditions, and our analysis based on the exact numerical evaluation
of the oscillation probability supports the simple picture presented in this
section based on the approximate formula eqs. (10) - (13).
3 Merits of detecting the T2K off-axis beam in Korea
Many neutrino oscillation experiments [26, 27, 29, 28, 30, 31, 32]
are planned to measure .
Tokai-to-Kamioka (T2K) neutrino-oscillation experiment which will start in 2008 is one of them.
In T2K, high intensity beam is produced by the proton accelerator which is under construction at
J-PARC in Tokai-village.
These ’s are shot to Kamioka, 295 km west from Tokai.
Super-Kamiokande (SK) will measure both the
survival rate and the transition rate.
The measurement of the transition probability is the main purpose of the T2K experiment,
because it tells us the magnitude of , see eq. (13),
the last unmeasured mixing angle of the MNS matrix.
In order to observe the signal of clearly,
the neutrino beam should satisfy the following conditions.
1.
The neutrino energy near the oscillation maximum () at km is
expected to be around 0.5 GeV to 0.7 GeV
according to the present experimental bound, eq. (2).
The flux should hence be large in this energy region.
2.
High energy neutrinos produce ’s via neutral current,
which become background to the Charged Current Quasi-Elastic (CCQE) events.
Therefore, the flux of beam should be small at high energies.
T2K adopts the off-axis beam which satisfies the above requirements [10, 33].
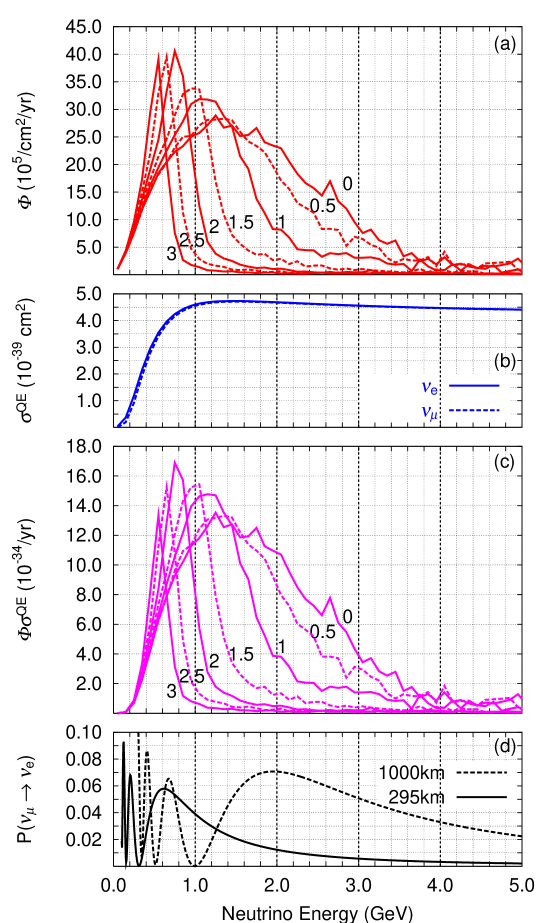
We show the flux of the T2K off-axis beam [33]
in Fig. 1 (a), for POT/yr
at = 295 km for various off-axis angles between and .
Figure 1:
(a). The flux of the T2K beam for POT/yr
at = 295 km for various off-axis angles between and .
(b). The cross section per nucleon
of the Charged Current Quasi Elastic (CCQE) events for and
off the water target.
(c). The flux at 295 km times CCQE cross section.
(d). Probability of transition at 295 km (solid line)
and that at 1000 km (dashed line) calculated for ,
, , , ,
, and for ,
and for .
It is clearly seen that the flux peaks at 0.55 to 0.75 GeV at to
off-axis angles.
In Fig. 1(b) we show the cross section per nucleon
of the and CCQE events
off the water target [4],
and in Fig. 1(c),
we show the product of the CCQE cross section and the
flux at 295 km for various off-axis angles.
Because the neutrino energy reconstruction is essential to determine the
oscillation phase, we use only the CCQE events in our analysis.
Fig. 1(b) shows that the CCQE cross sections grow quickly above the threshold,
become cm2 at GeV,
and stay approximately constant at
cm2 at GeV up to GeV where the flux diminishes.
We also show the typical transition probability at km and
that at km in Fig. 1(d), calculated for
,
,
, , ,
, and for ,
and for .
From Fig. 1 (a), (c), and (d),
we confirm that the to off-axis beam (OAB) has a strong flux peak
where the oscillation maximum is expected at SK.
We also note that the beam at smaller off-axis angles has significant flux in the
GeV region where the oscillation maximum of the
transition is expected at km.
During the T2K experimental period, the center of the beam from
J-PARC goes through Kamioka at to beneath SK, and the lower
side of the same beam will appear in Korea at various off-axis angles.
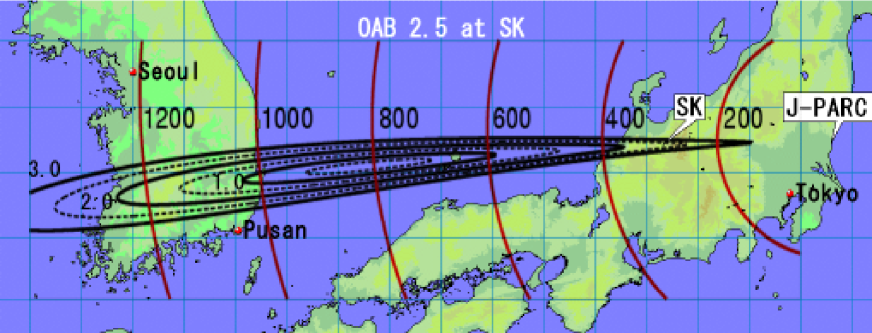
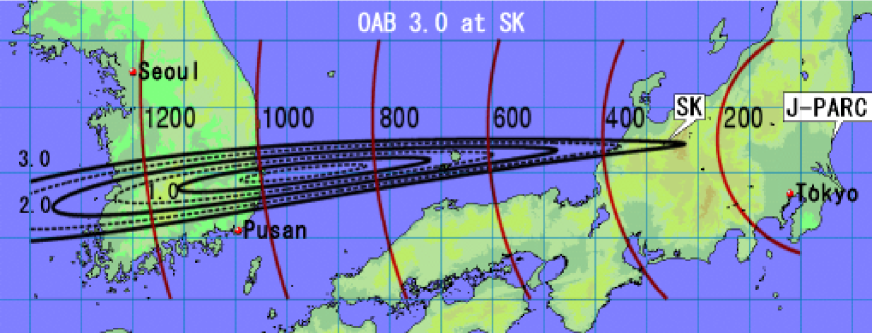
(a)
(b)
Figure 2: The off-axis angle of the neutrino beam from J-PARC on
the sea level, when the beam center is (a)
and (b) off at the SK site.
The baseline lengths are shown by
vertical contours, and the off-axis angles at the sea level
are shown by elliptic
contours between and .
The SK is slightly off the corresponding contour because it is
about 320 m above sea level.
We show in Fig. 2 the off-axis angle of the beam at
the sea level
for the off-axis beam (a) and off-axis beam (b) at SK.
The baseline lengths are shown by
vertical contours, and the off-axis angles at the sea level
are shown by elliptic
contours between and .
The SK is slightly off the corresponding contour because it is
about 320 m above sea level.
We find that,
when the () off-axis beam reaches SK,
the () off-axis beam appears in the
east coast of Korea which is 1000 km away form J-PARC.
If a huge neutrino detector is constructed in the east coast of Korea,
along the T2K beam direction,
the two detector system,
the Tokai-to-Kamioka-and-Korea (T2KK) experiment,
can observe the oscillation maximum of the transition
probability at two vastly different base-line lengths.
Our most important observation for the T2KK proposal
is that the matter effect term
in eq. (14b) at Korea
is about 3 times as large as that at Kamioka.
Because the sign of the matter effect in follows the sign of
,
the amplitude of the oscillation
for the normal hierarchy at
is larger than that for the inverted hierarchy.
Because the matter effect is stronger at Korea,
if the probability is found larger (smaller) at Korea than the one at Kamioka,
we can conclude that the hierarchy is normal (inverted),
irrespective of the other model parameters such as and [14].
Let us examine this observation semi-quantitatively by using the
approximate formulae in eqs. (13) - (13).
The difference between the oscillation
amplitude
at a far detector
and that at a near detector is
(16)
The error of the
can be estimated as
(17)
Here is the number of appearance events.
The ratio between and
at the maximum value of the oscillation probability,
, can be expressed as
(18)
where denotes the fiducial volume of the detector
and is the neutrino beam flux at ,
which is proportional to .
The cross section ratio at different energies drops out,
because the neutrino cross section of CCQE events is almost
constant in the 0.7 - 5 GeV region; see Fig. 1(b).
We therefore need to estimate the number of CCQE events
near the oscillation maximum at SK, .
We show in Fig. 3, typical numbers of expected
CCQE events for the events (a) and the events (b),
for the OAB at SK.
The open squares show the expected numbers of events in a 200 MeV wide
bin, after 5 years ( POT),
at and for the normal hierarchy, just
as in Fig. 1 (d).
From the two bins around GeV in Fig. 3(b),
we may estimate .
Figure 3: The typical numbers of the events (a), and those of the
events (b),
for the exposure time of 5 years ( POT),
for the OAB at SK (open square), and for the OAB
at km with a 100 kt water erenkov detector (solid circles).
The input parameters are the same as those of Fig. 1 (d)
[14].
The difference between the maximum value of the oscillation
probability, ,
for the normal hierarchy () and
that for the inverted hierarchy ()
can be expressed as
where we set km and used the approximation
of eqs. (13) and (14b).
The difference grows linearly with the distance, , as
long as the oscillation maximum is covered by the flux.
The significance of excluding the fake hierarchy can then be estimated as
(19)
We find that when we put a 100 kt detector at km,
the significance can exceed the 3- level in this very rough estimate,
which is confirmed in the following numerical studies.
The phase-shift factor
of eq. (15) also contributes to the determination
of the neutrino mass hierarchy pattern.
Since is an even function of ,
the magnitude of controls the
oscillation in eq. (15).
Because the value of varies by
changing the sign of ,
we have the possibility to distinguish the sign of by
measuring the oscillation phase.
At Kamioka, however,
is governed by the term proportional to ; see
eq. (14d), and hence the fake hierarchy can reproduce the
same by changing the sign of .
In Korea, the magnitude of the matter effect term in eq. (14d) is
larger than that of the terms,
and hence the fake hierarchy cannot reproduce the same oscillation phase.
The efficiency of these phase-shift contribution grows with the
magnitude of , which grows as decreases.
We find that the effect of the phase difference becomes as important
as that of the amplitude difference at .
From the above consideration, we observe that it is useful to have a
far detector in Korea in the region where the neutrino flux is
significant around the oscillation maximum,
which is typically between 1.4 GeV to 3 GeV, see Fig. 1(d).
Figs. 1 (a) and (c) show that beams
at an off-axis angle smaller than have this property.
Figs. 2(a) and (b) show that such an off-axis beam will
appear in a specific region near the east coast of Korea during the
T2K experimental period.
Once the neutrino mass hierarchy is determined,
the T2KK experiment
also has the ability to measure
the leptonic CP phase uniquely without using the anti-neutrino beam.
From eqs. (13) and (14b),
there are 2 unmeasured parameters which control the amplitude of
oscillation,
and .
Due to the significantly different matter effect at between Kamioka and Korea,
we can constrain both and uniquely from the two amplitudes.
The value of is measured through the energy dependence of
the
oscillation probability, through the phase shift ; eq. (14d).
Since both and can be measured independently,
the CP phase can be constrained uniquely.
4 Analysis method
Before we present the results of our numerical calculation, we would
like to explain our treatment of the signals and background.
In our case study,
we consider a 100 kt level detector,
in order to compensate for the decrease in the neutrino flux
which is about of that at SK.
We adopt a Water erenkov detector because it allows us to distinguish
clearly the events
from events.
We use the CCQE events in our analysis,
because it allows us to kinetically reconstruct the neutrino energy
event by event.
Since the Fermi-motion of the target nucleon dominates
the uncertainty of the neutrino energy reconstruction,
which is about 80 MeV,
we take the width of the energy bin as
MeV for MeV, in the following analysis
111At a few GeV region, contributions from soft-charged emission processes to the CCQE
signal events become significant [34].
Those events have soft charged ’s which do not emit erenkov lights, and hence
the reconstructed neutrino energy is underestimated by about 300 MeV [10].
In this analysis we do not consider contribution from non-CCQE events, and leave
the studies of their impacts for the future..
The event numbers of
from flux ()
which is delivered by J-PARC [33]
in the -th energy bin,
,
are then calculated as
(20)
where
is the neutrino oscillation probability
including the matter effect,
is the detector mass,
is the Avogadro constant,
and
is the CCQE cross section per nucleon in water
[4].
All the primary as well as secondary fluxes used in our analysis are
obtained from the website [33].
The fiducial volume of Super-Kamiokande is 22.5 kt,
and we assume that a detector in Korea is 100 kt.
CCQE events have been selected as single-ring events at K2K. Efficiency of
the technique has been estimated to be about around 600 MeV and
about around a few GeV [10, 34].
In the following numerical analysis
we set the efficiency to be at both SK and at a far detector
for brevity
222
Our results can be regarded as those for larger fiducial volumes,
such as 28.1 kt at SK and 167kt at a far detector, if we take the efficiencies
of and estimated in refs [10, 34].
.
When the secondary neutrino flux
()
of the primary beam is considered,
the -like and -like events for the -th bin are obtained
as
(21)
The second term in eq.(21)
corresponds to the contribution from the secondary
neutrino flux.
In our analysis,
we calculate
by assuming the
following input parameters:
(22)
with the constant matter density, along T2K
and for the Tokai-to-Korea baseline,
which goes through deeper in the earth than that of T2K333Because the sea between Japan and Korea is less than 1km deep,
there is no contribution from the water to the average density..
We use the above numerical values in order to keep the consistency
with our previous report [14].
Our results are not sensitive to the small change in the input values
in eq.(22)
but the quantitative results on the mass hierarchy determination
depend on the mater density along the baseline.
Dedicated study on the impacts of the matter density profile along the
T2KK baseline will be reported elsewhere.
We examine various input values of , ,
and the sign of .
Since our concern is the possibility to distinguish the neutrino mass
hierarchy and to constrain the CP phase uniquely,
we study how the above ‘data’ can constrain the model parameters by
using the function
(23)
Here the first two terms, and ,
measure the parameter dependence of the fit to the SK and the Korean
detector data,
(24)
where the summation is over all bins
from 0.4 GeV to 5.0 GeV for ,
0.4 GeV to 1.2 GeV for at SK,
and 0.4 GeV to 2.8GeV for at Korea.
Here is the calculated number of events
in the -th bin,
and its square root gives the statistical error.
We include the contribution of the -events in order to constrain
the absolute value of strongly in this analysis,
because a small error of dilutes the phase shift
[14, 25].
is calculated by allowing the model parameters
to vary freely
and by allowing for systematic errors.
In our analysis, we consider 4 types of systematic errors.
The first ones are for the overall normalization of each neutrino flux,
for which we assign errors,
(25)
for all neutrino flavor,
which are taken common for T2K and the Tokai-to-Korea experiment.
The second systematic error is for the uncertainty in the matter density,
for which we allow overall uncertainty along the baseline,
independently for T2K () and
the Tokai-to-Korea experiment ():
(26)
The third uncertainty is for the CCQE cross section.
Since and CCQE cross sections are expected to be very
similar theoretically, we assign a common overall error of for
and
(),
and an independent error for and
CCQE cross sections
().
The last one is the uncertainty of the fiducial volume,
for which we assign error independently for T2K
() and the
Tokai-to-Korea experiment ().
is then calculated as
(27)
and has four terms;
(28)
In short,
we assign errors for the normalization of each neutrino flux,
the and CCQE cross sections,
the effective matter density along each base line,
and for the fiducial volume of SK, and that of the Korean detector.
Finally, accounts for the external constraints
on the model parameters:
(29)
The first two terms correspond to the present experimental constraints
summarized in eq. (2).
In the second term,
we adapt the larger error than that shown in eq. (5b)
for continuity of the previous work, ref. [14].
In the last term, we assume that the planned future reactor
experiments [26, 27]
should measure with the expected uncertainty of 0.01, during the
T2KK experimental period.
In total, our function depends on 16 parameters,
the 6 model parameters and the 10 normalization factors.
5 Determination of the mass hierarchy pattern
In this section we show the results of our numerical calculation.
First, we search for the best combination of the off-axis angle at SK
and that at a Korean detector,
as well as
the base-line length up to Korean detector for determining the sign of
.
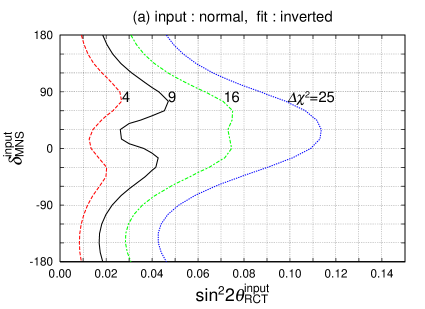
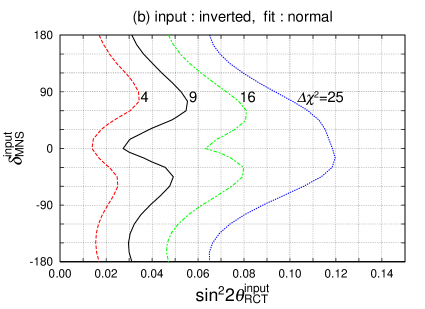
Figure 4: Minimum of the T2KK two detector experiment
after 5 years of running ( POT)
as functions of the off-axis angle and
the base-line length of the far-detector from J-PARC at Tokai,
when the normal hierarchy
()
is assumed in generating the events,
and the inverted hierarchy
() is assumed in the fit.
The left-hand figure (a) is for the OAB at SK,
and the right-hand one (b) is for the OAB beam at SK.
The input parameters are the same as those of Fig. 1 (d);
in particular,
and .
For this purpose, we first calculate the expected number of the
CCQE events
at both detectors by assuming either normal or inverted hierarchy, and
then examine if the resulting ‘data’ can be fitted for the opposite
hierarchy by adjusting the model parameters.
We show in Fig. 4
the minimum expected at the T2KK two detector experiment
after 5 years of running (POT),
as functions of the off-axis angle and
the base-line length of the far-detector site from J-PARC at Tokai,
when the normal hierarchy
()
is assumed in generating the events,
and the inverted hierarchy
() is assumed in the fit.
The left-hand figure (a) is for the OAB at SK,
and the right-hand one (b) is for the OAB beam at SK.
The input parameters are choose as in eq. (22),
and .
The four symbols, solid circle, open circle, triangle, and square are
for km, 1050km, 1100km, and 1150km, respectively.
There are no data points at in Fig. 4(a) for
the
OAB at SK,
because the
off-axis beam does not reach Korea: see Fig. 2(a).
It is clearly seen from Fig. 4 that the best combination
of off-axis angles
are for SK and for the Korean detector at km.
The off-axis beam has strong flux up to GeV,
which overlaps significantly with the broad peak of the
oscillation at km; see Fig. 1 (a), (c) and (d).
Because the number of the CCQE events
is large enough around the oscillation maximum for ,
both at SK and at the far detector in Korea, we are able to measure
the difference in the magnitude
of the probability at two vastly different
baselines, and can hence distinguish between the normal
hierarchy and the inverted hierarchy.
We can reject the fake hierarchy
at 4.7- level in our simple simulation with this combination
of at SK and at
km.
If we remove the the constraint of the future reactor
experiment, the last term in eq. (29),
the minimum value drops from 23 to 18,
for the combination of
at SK and at km;
see [14].
We find from Fig. 4
that the OAB in Korea still keeps the sensitivity to the
neutrino mass hierarchy,
where both a combination of at km and
OAB at SK (Fig. 4 (a))
and that of at km km and the
OAB at SK
(Fig. 4 (b)) distinguish the neutrino mass hierarchy
nearly at 4- level in our simulation.
This is because the CCQE cross section times the flux of OAB
extends to 1.7 GeV,
see Fig. 1 (a) and (c),
which barely overlaps with the broad peak region of the oscillation probability
shown in Fig. 1(d).
From Fig. 2 (a) and (b),
we find that the OAB is observable only in the east coast of
Korea ( km)
for the OAB at SK,
whereas for the OAB at SK,
it can be observed at various base-line lengths up to km.
The small values of for larger off-axis angles in Fig. 4
tell us that it is essential to choose the location of the detector in Korea where the off-axis angle is smaller than .
Figure 5: The same as Fig. 4,
but when the input data is calculated for the inverted hierarchy ()
and the fit is performed by assuming the normal hierarchy ().
All the other parameters are the same as those in Fig. 4.
Fig. 5 is the same as Fig. 4, but when the input data is calculated for the inverted hierarchy
and the fit is performed by assuming the normal hierarchy.
It is remarkable that almost the same level of the capability to distinguish the neutrino mass hierarchy
can be achieved for the OAB at km
even when the hierarchy is inverted ().
Slight decreases of the minimum value of the best combinations,
23.5 in Fig. 4(b) to 21.3 in Fig. 5(b), and
14.8 in Fig. 4(a) to 14.6 in Fig. 5(a),
can be attributed to the smaller expected number of the
appearance events because of the matter effect which suppresses the probability in the inverted hierarchy.
We may conclude that a far detector that observes the T2K neutrino beam at km
and the off-axis angle has the potential to determine the neutrino mass hierarchy whether it is normal
or inverted.
Because we find from Fig. 4 and Fig. 5
that a combination of OAB at km and the OAB at SK has a significantly
better capability of determining the neutrino mass hierarchy,
we study in the following physics potential of this preferred T2KK set up in more detail.
In particular,
we investigate
the whole un-explored parameter space of the three neutrino model.
First in Fig. 6, we summarize our findings on the capability
of the T2KK experiment to determine the neutrino mass hierarchy in the
whole space of and .
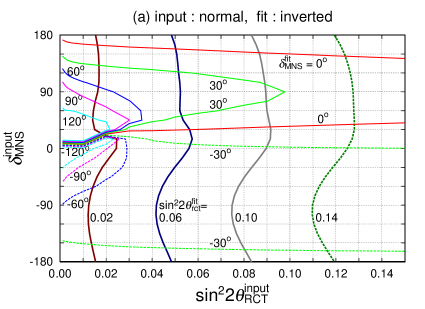
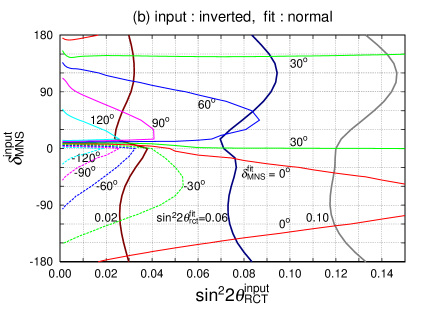
Figure 6:
Capability of the T2KK two-detector experiment to determine the neutrino mass hierarchy,
(a) when the mass hierarchy is normal ,
and (b) when it is inverted .
The numerical results are obtained for a combination of OAB at SK
and off-axis at with a 100 kt water erenkov detector,
after 5 years of running ( POT).
In each figure the input data are calculated for the model parameters
at various and ,
and the fit has been performed by surveying the whole parameter space with the
opposite mass hierarchy.
The resulting values of minimum are shown as contours for 2, 3, 4, and 5.
The wrong hierarchy can be excluded with the corresponding confidence level
if the true and values lie in the right-hand side of each contour.
The model parameters are set at
(a),
(b),
,
,
,
for SK,
and for .
Fig. 6(a) shows our result when the mass hierarchy is normal (),
and (b) when it is inverted ().
In each figure the input data are calculated for the model parameters
at various and points,
and the fit has been performed by surveying the whole parameter space, but under
the opposite mass hierarchy.
The resulting values of the minimum are shown as contours for 2, 3, 4, and 5-.
The wrong mass hierarchy can be excluded with the corresponding confidence level
if the true value lies in the right-hand side of each contour along the true value of ().
In particular, the minimum values of 22 for the point ()
= (0.10, ) in Fig. 6(a)
corresponds to the highest point in Fig. 4(b),
and the corresponding value of 21 in Fig. 6(b) is the highest point in Fig. 5(b).
We find that the wrong hierarchy can be excluded at the 3- level if (0.06)
if the hierarchy is normal (inverted).
It is remarkable that the = case chosen to plot Fig. 4 and Fig. 5
turns out to be the case when it is most difficult to determine the neutrino mass hierarchy.
If = ,
the wrong hierarchy can be excluded at the 3- level
for for the normal hierarchy
(Fig. 6(a)) or
for the inverted hierarchy (Fig. 5(b)).
The origin of the dependence is the difference of the oscillation phase at
the far detector in Korea.
From eqs. (14d) and (15), the difference of the oscillation
phase near the oscillation maximum, ,
between the input and the fit is expressed as,
(30)
The upper sign is for the normal hierarchy, and
the lower sign is for the inverted hierarchy.
The phase-shift difference depends on both
and .
As explained in section 3, below eq. (3),
when ()
the phase shift is smaller than that with the other
at km.
Therefore the fitted value
of ()
also tends to be large and has the opposite sign for the fake hierarchy.
If , it is not possible to compensate
for the phase-shift difference of eq. (30)
even by choosing ,
and the significantly higher minimum value results in Fig. 6(a) and (b).
In general, is favored even when
in order to minimize the phase-shift difference of eq. (30).
Figure 7:
The values of the fit parameters, and ,
at the minimum point of the analysis of Fig. 6 are
shown. The results for the normal hierarchy (a) and those for the inverted hierarchy (b)
are shown correspondingly to the fit of Fig. 6 (a) and
Fig. 6 (b), respectively.
The thick vertical lines are the contours at 0.02, 0.06, 0.10, and 0.14.
The thinner contours give the values.
This is clearly seen in Fig. 7, where
we show the values of the best fit parameters, and ,
at the minimum point of the analysis of Fig. 6.
The results for the normal hierarchy (a) and those for the inverted hierarchy (b),
are shown correspondingly to the fit of Fig. 6(a)
and Fig. 6(b),
respectively.
The thick vertical lines are the contours at 0.02, 0.06, 0.10
and 0.14.
The thinner contours give the values.
We find that the value of around is almost always favored as expected.
Here let us try to explain more detailed features of Fig. 6 and Fig. 7
by separating the parameter space of and into 4 regions.
1.
small region ( ) at
any :
In this region the phase difference eq. (30) is mainly
controlled by the terms,
because of the enhancement over the matter effect term.
It is hence relatively easy to make the difference small by adjusting
.
The hierarchy is determined essentially by the difference of the
oscillation amplitude only.
2.
at :
Although the effect of
is canceled by choosing ,
the difference from the matter effect term in eq. (30) cannot be canceled.
Therefore in this region the hierarchy is determined by the differences of both the amplitude and the oscillation phase.
3.
at :
In eq. (30), the difference is controlled by the matter effect term and the term
because .
In this region, we can make the phase-shift difference small by choosing .
4.
to at :
In this region the phase-shift difference eq. (30) at can be
made small at ,
but the difference at becomes large.
Because the flux of off-axis beam is strong at lower energies where ,
the growth of the phase-shift difference eq. (30) at larger cannot be compensated.
This explains why the minimum value
in this region is larger than the one for the case 3.
The systematics of the oscillation phase is rather complicated,
but its effect turns out to be significant in determining the neutrino mass hierarchy.
Before closing the section,
let us briefly study the value of in Fig. 7.
In Fig. 7(a), is larger than ,
whereas in Fig. 7(b), is smaller than .
This is because the same oscillation amplitude can be obtained by choosing
when the hierarchy is normal but it is assumed to be inverted in the fit,
and vice versa for the opposite case.
The fitted value of cannot deviate too much from the input value of ,
however, because of the constraint from the proposed reactor experiments,
according to the last term in eq. (29),
and also because of the SK measurement of the probability,
which is much less sensitive to the mass hierarchy difference.
6 Measurement of the CP phase
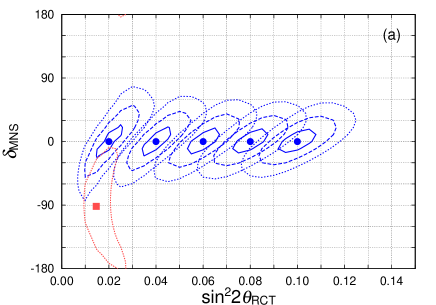
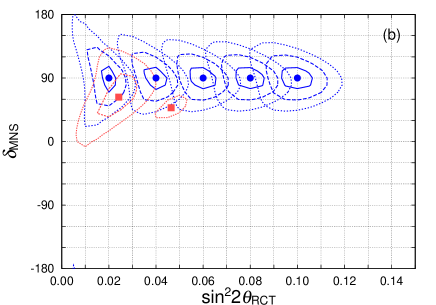
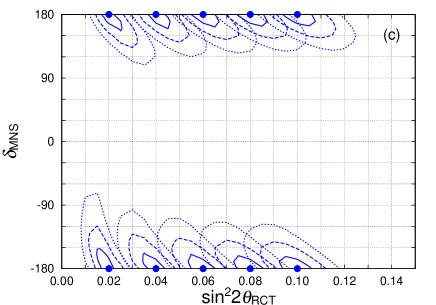
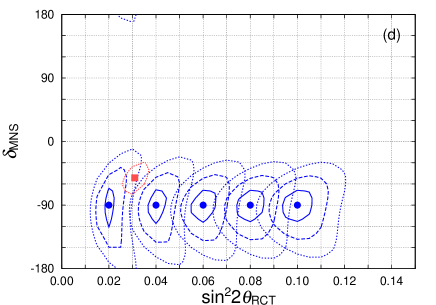
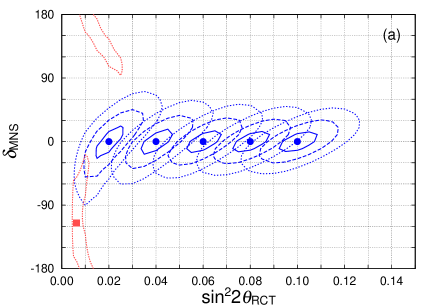
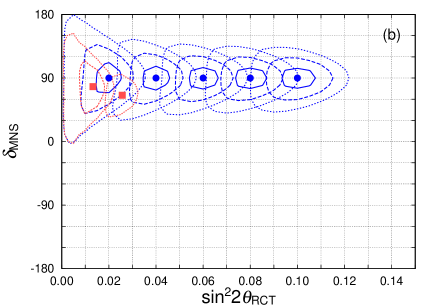
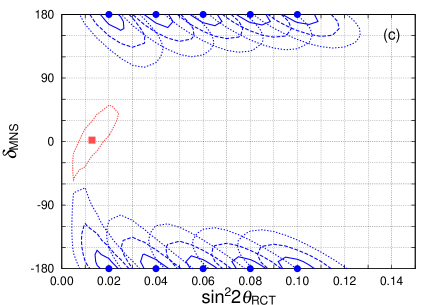
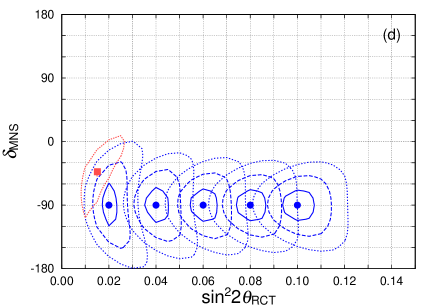
Figure 8:
Capability of the T2KK two detector experiment for measuring and .
Allowed regions in the plane of and
are shown for a combination of OAB at SK and at with
a 100 kt water erenkov detector after 5 years of running ( POT).
The input values of are 0.02, 0.04, 0.06, 0.08 and 0.10 for
= (a), (b), (c), and (d).
The normal hierarchy is assumed at ,
and the
other parameters are the same as those in Fig. 6.
The input points are shown as solid blobs, where by definition.
The 1-, 2-, and 3- contours are then shown by solid, dashed, and dotted lines,
respectively.
For the input values of (, )
= (0.02, ) (a), (0.02, ) and (0.04, ) (b) and (0.02, ) (d),
there appear additional allowed regions when the mass hierarchy is chosen
with the wrong sign in the fit, where the local minimal point is depicted by
a solid square.
In this section we investigate the measurement of and for
our preferred combination of the OAB at SK and OAB at km.
This combination of the T2KK experiment allows us to measure the oscillation
around the oscillation maximum at two base-line lengths,
which can be parametrized as in eq. (13),
in terms of the amplitude shift
eq. (14b) and the phase shift eq. (14d).
Once the neutrino mass hierarchy is determined as explained in the previous section,
the terms proportional to
in the amplitude shift eq. (14b) measure ,
and those in the phase shift eq. (14d) measure .
In the T2KK two detector system, both and can be determined
uniquely because the amplitude shift eq. (14b) has significantly different matter effect
contributions between SK and the far detector.
The phase shift measurement of the term eq. (14d) constrains
independent of .
Figure 9:
The same as Fig. 8, but when the events are calculated for the inverted hierarchy,
i.e., .
Just like in Fig. 8, additional allowed regions,
when the wrong sign of the is chosen in the fit,
appear for all the cases at ,
and for (b) at .
We show in Fig. 8 and Fig. 9 regions
allowed by this experiment
in the plane of and .
The mean values of the input data are calculated for the parameters
of eq. (22).
In each figure,
input points () are
shown by solid-circles for between 0.02 and 0.1,
with an interval of 0.02,
and for four values of ;
(a), (b), (c), and (d).
The regions where the minimum value is less than 1, 4, 9
are depicted by solid, dashed, and dotted boundaries, respectively.
Fig. 8 is for the normal hierarchy,
and Fig. 9 is for the inverted hierarchy.
From these figures,
we find that can be constrained to at
1- level,
when as long as the neutrino mass
hierarchy is determined.
If we remove the last term in eq.(29),
the error of changes little but that of grows significantly; see Fig. 5 of Ref. [14]
As shown in Fig. 6(a) and (b),
the mass hierarchy cannot be determined at 3- level
( 9) when is too small.
In case of the input parameters of Fig. 8 for the
normal hierarchy,
this is the case for at (a),
and 0.04 at (b),
and at (d).
For those input points,
there appear an additional allowed region whose center (local minimum
of ) is shown by a solid square.
No extra allowed region appears for in
Fig. 8(c),
in accordance with the result of Fig. 6(a).
In case of Fig. 9 for the inverted hierarchy,
the local minimum appears for
at (a),
and 0.04 at (b),
at (c),
and
at (d).
It is remarkable that the error of is almost independent of
value between 0.02 and 0.1,
for all the four input values of , , , and .
This is remarkable because the event number is proportional to according to eq. (13),
and hence the statistical error of the measurement of the amplitude and the phase should be proportional to ,
or .
This increase in the error for small values
is canceled by the increased sensitivities of both
the amplitude and the phase shift to and ,
respectively,
which are both proportional to .
The two effects cancel rather accurately, and we find that the error of
is almost independent of the input
values of and .
7 Conclusion and discussions
In this paper we study physics potential of the T2KK proposal
[12, 13, 14],
where a far detector along the T2K neutrino beam line is placed in Korea.
We find that the off-axis neutrino beam from J-PARC at Tokai village
for the T2K
project has significant intensity at a few GeV range
when the far detector is placed in the east coast of Korea where
the beam at less than off-axis can be observed at a base-line
length of km.
The resulting two detector system can observe the
oscillation probability near the oscillation maximum at two different energies,
if is not too small.
We examine,
in particular, the capability of determining the mass hierarchy
pattern and the CP phase of the lepton-flavor-mixing matrix
when a 100 kt water erenkov detector is placed at various locations in Korea
for the off-axis beam (OAB) of and at the
Super-Kamiokande site.
The best results are found for a combination of OAB at SK ()
and OAB at ,
where the mass hierarchy pattern can be determined at 3- level
for when the hierarchy is normal (inverted), after 5 years of
running ( POT).
The sensitivity of the T2KK experiment on the neutrino mass hierarchy
depends not only on but also on .
We explore the sensitivity in the whole space of and ,
and the results are shown in Fig. 6(a) for the normal
hierarchy and in Fig. 6(b) for the inverted hierarchy.
Significantly higher sensitivity is found for
for both hierarchy cases.
We also find that the leptonic CP phase, , can be constrained uniquely,
without invoking anti-neutrino beams,
as long as the mass hierarchy pattern is determined: see Fig. 8
for the normal hierarchy,
and Fig. 9
for the inverted hierarchy.
Those results are obtained by assuming that the neutrino energy can be
reconstructed with a hundred MeV uncertainty for the charged current
quasi-elastic events, and the earth matter density along the baseline
can be determined with accuracy.
All our numerical results have been understood semi-quantitatively,
by using the approximative expression for the
and oscillation
probabilities,
eqs. (10),
(10),
(13)
(13),
and
(15),
where only the linear and quadratic terms
in the matter effect and those in are
kept in the oscillation probabilities.
Our results are based upon a very simple treatment of the systematic
errors where overall errors are assigned for all the 10 normalization
factors of eq. (28).
We find that the significance of the mass hierarchy determination is not affected much
even if we enlarge all the systematic errors to except for the matter density uncertainties.
This means that the errors of the T2KK experiment proposal
in this paper are dominated by the statistical error.
Therefore, if we make the detectors at Kamioka and/or Korea larger,
or if the intensity of the J-PARC beam is stronger,
the significance of the
measurement will grow as
proportional to the square root of the product of the volume,
the intensity, and the exposure time.
It is not so clear,
however,
what is the best volume ratio between the detector in Kamioka and that in Korea.
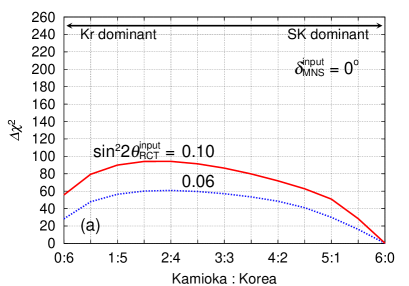
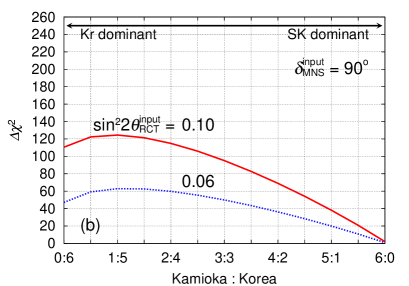
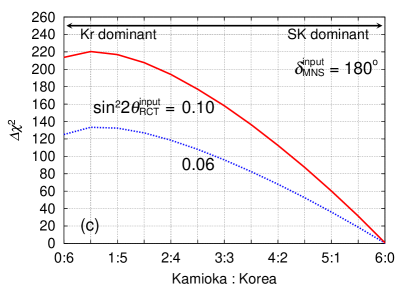
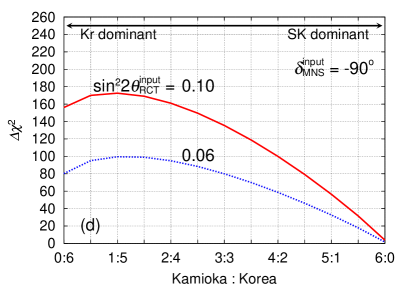
Figure 10:
Optimal ratio of the fiducial volumes of two detectors, one at Kamioka ( km)
and the other at km in Korea, for determining the neutrino mass hierarchy.
The input data are calculated for the normal hierarchy at
and the minimum
of the fit with the wrong hierarchy is shown for (solid lines)
and 0.06 (dotted lines) and for (a), (b),
(c), and (d),
when the sum of the fiducial volumes is fixed at 600 kt.
The other parameters are same as those in Fig. 1 (d),
and the results are calculated for POT.
We show in Fig. 10 the minimum
as functions of the volume ratio of the near (Kamioka) and far (Korea) detectors
while keeping the total volume at 600 kt for POT.
We assume the normal hierarchy for the input and the inverted hierarchy
in the fit.
We examine 8 cases,
for (solid lines) and
(dotted lines),
and for = (a),
(b), (c), and (d).
It is clearly seen from Fig. 10
that a 600 kt detector in Kamioka alone cannot resolve the mass
hierarchy at all,
because there is a little difference in
transition probability between the normal hierarchy
and the inverted hierarchy.
On the other hand,
in the case of only a Korean detector with 600 kt,
the minimum value is not much smaller than the best case.
This is because the constraint of from the future reactor
neutrino experiment replaces the role of the near detector which
measures the transition
at low energies where the matter effect is small.
We find that the minimum value of 23.5
in Fig. 10(a)
at the volume ratio of 1:5 ()
is about 4.5 times as large as the minimum value
in Fig. 4(b), confirming the
dominance of the statistical error in our analysis.
If we request that the minimum should be at least
of its optimal value,
then the near-to-far volume ratio
should be between and .
More volumes should be given to the far detector than to the near detector.
The above results are obtained with a detection efficiency for the CCQE
events. If we set efficiency for SK and efficiency for a far detector
in Korea [34], the value of in Fig. 4
for the combination of for SK and for a far detector placed
at km drops from 22.6 to 14.5, roughly scaling with the effective number of events
at a far detector.
We note here that our proposal is significantly different from that
of Ref.[13] in the following aspects.
1.
We propose to use a combination of large off-axis angle at SK and
a small off-axis angle at the far detector, so that the first
oscillation maximum can be observed at both detectors.
2.
As a consequence, the CP phase can be determined uniquely without
invoking experiments with an anti-neutrino beam.
3.
We propose that the far detector should have larger fiducial volume
in order to maximize the physics outputs, see Fig. 10.
The use of two different off-axis angles implies that our proposal
should suffer from larger systematic errors, especially for high
energy events at the far detector.
Among the potentially serious background which we could not estimate
in this paper are;
•
possible miss-identification of NC production as
CCQE events,
•
possible miss-identification of soft emission events as
CCQE events.
Although the above uncertainties were found to be rather small at K2K
experiments [35],
we should expect them to be more serious at high energies.
Dedicated studies on the fake reconstructed neutrino energy of the NC
events and those on the correlation between the true and the reconstructed
neutrino energy of the CC soft events are mandatory.
In addition,
careful studies including possible energy
dependence of the flux and cross section uncertainties, and also the location
dependence of the matter density, may be needed to justify the physics
case of the T2KK proposal.
Acknowledgments
We thank our colleagues
Y. Hayato,
A.K. Ichikawa,
T. Ishii,
I. Kato,
T. Kobayashi
and
T. Nakaya,
from whom we learn about the K2K and T2K experiments.
We are also grateful to
Mayumi Aoki,
Paul H. Frampton,
Chung-Wook Kim,
Soo-Bong Kim,
and
Yeongduk Kim,
for useful discussions and comments.
The work is supported in part
by the Core University Program of JSPS.
The numerical calculations were partly carried out on
Altix3700 BX2 at YITP in Kyoto University.
References
[1]
B. Pontecorvo,
J. Expt. Theor. Phys. 53, 1717 (1967)
[Sov.Phys.JETP 26, 984 (1968)];
V.Gribov and B. Pontecorvo,
Phys. Lett. B28, 493 (1969).
[2]
The LSND Collaboration (A. Aguilar et al.), Phys. Rev. D64, 112007 (2001) [hep-ex/0104049].
[3]
M. Ambrosio et al. (MACRO Collaboration), Phys. Lett. B566 35 (2003) [hep-ex/0304037];
M. C. Sanchez et al. (Soudan 2 Collaboration), Phys. Rev. D68, 113004 (2003) [hep-ex/0307069];
Y. Ashie et al. (Super-Kamiokande Collaboration), Phys. Rev. D71, 112005 (2005) [hep-ex/0501064].
[4]
M. H. Ahn et al. (K2K collaboration) [hep-ex/0606032]
[5]
P. Adamson et al. (MINOS Collaboration),
Phys. Rev. D73, 072002 (2006) [hep-ex/0512036];
N. Tagg, (MINOS Collaboration), hep-ex/0605058;
D.G. Michael, et al. (MINOS Collaboration),
Phys. Rev. Lett. 97, 191801 (2006) [hep-ex/0607088].
[6]
B.T. Cleveland et al. (Homestake Collaboration),
Astro. J. 496 505 (1998);
J.N. Abdurashitov et al. (SAGE Collaboration),
J. Exp. Theor. Phys. 95 181 (2002)
[Zh. Eksp. Teor. Fiz. 95, 211 (2002)]
[astro-ph/0204245];
W. Hampel et al. (GALLEX Collaboration),
Phys. Lett. B447, 127 (1999);
M. B. Smy et al. (Super-Kamiokande Collaboration),
Phys. Rev. D69, 011104 (2004) [hep-ex/0309011];
B. Aharmim et al. (SNO Collaboration),
Phys. Rev. C 72, 055502 (2005) [nucl-ex/0502021];
M. Altmann et al. (GNO Collaboration),
Phys. Lett. B616, 174 (2005) [hep-ex/0504037].
[7]
J. Hosaka et al. (Super-Kamiokande Collaboration),
Phys. Rev. D73, 112001 (2006) [hep-ex/0508053].
[8]
T. Araki et al. (KamLAND Collaboration), Phys. Rev. Lett. 94, 081801 (2005) [hep-ex/0406035].
[9]
M. Apollonio et al. Eur. Phys. J. C27 331 (2003) [hep-ex/0301017].
[10]
Y. Itow et al., [hep-ex/0106019].
see also the JHF Neutrino Working Group’s home page,
http://neutrino.kek.jp/jhfnu/.
[11]
J-PARC home page, http://j-parc.jp/.
[12]
K. Hagiwara, Nucl. Phys. Proc. Suppl. 137, 84 (2004) [hep-ph/0410229].
[13]
M. Ishituka et al., Phys. Rev. D72, 033003 (2005) [hep-ph/0504026]
[14]
K. Hagiwara, N. Okamura, K. Senda, Phys. Lett. B637 266 (2006) [hep-ph/0504061].
[15]
P. Lipari, Phys. Rev. D61, 113004 (2000) [hep-ph/9903481];
M. Narayan, S. Uma Sankar, Phys. Rev. D61, 013003 (1999) [hep-ph/9904302];
V. Barger et al., Phys. Lett. B485, 379 (2000) [hep-ph/0004208].
[16]
V. Barger, D. Marfatia, K. Whisnant, Phys. Rev. D65, 073023 (2002) [hep-ph/0112119].
[17]
M. Aoki et al., Phys. Rev. D67, 093004 (2003) [hep-ph/0112338].
[18]
O. Mena Requejo, S. Palomares-Ruiz, S. Pascoli,
Phys. Rev. D72, 053002 (2005) [hep-ph/0504015]
[19]
Z. Maki, M. Nakagawa and S. Sakata, Prog. Theor. Phys. 28, 870 (1962).
[20]
L. Wolfenstein, Phys. Rev. D17, 2369 (1978);
R.R. Lewis, ibid. 21, 663 (1980);
V. Barger et al., ibid. 22, 2718 (1980).
[21]
S.P. Mikheyev and A.Yu. Smirnov, Yad. Fiz. 42, 1441 (1985)
[Sov.J.Nucl.Phys.42, 913 (1986)];
Nuovo Cimento C9, 17 (1986).
[22]
K. Hagiwara and N. Okamura, Nucl. Phys. B548, 60 (1997).
[23]
G. L. Fogli et al., Phys. Rev. D59, 033001 (1999) [hep-ph/9808205];
Phys. Rev. D69, 017301 (2004) [hep-ph/0308055];
Prog. Part. Nucl. Phys. 57 742 (2006) [hep-ph/0506083].
[24]
J. Arafune, M. Koike, J. Sato, Phys. Rev. D56, 3093 (1997) [hep-ph/9703351];
Erratum ibid. D60, 119905 (1999).
[25]
M. Koike et al., Phys. Rev. D73, 053010 (2006)[hep-ph/0510082];
M. Honda, N. Okamura and T. Takeuchi [hep-ph/0603268]
[26]
The Double-CHOOZ Collaboration [hep-ex/0405032].
M. G. T. Lasserre,[hep-ex/0606025].
[27]
F. Suekane (for the KASKA Collaboration) [hep-ex/0407016].
[28]
T. Bolton, Nucl. Phys. Proc. Suppl. 149, 166 (2005).
[29]
J. Cao, Nucl. Phys. Proc. Suppl. 155, 229 (2006) [hep-ex/0509041].
[30]
S. B. Kim, talk presented in ‘Fourth Workshop on Future Low Energy Neutrino Experiments’,
Angra dos Reis, RJ - Brazil (2005)
[31]
J. C. Anjos et al., Nucl. Phys. Proc. Suppl. 155, 231 (2006) [hep-ex/0511059].
[32]
D. S. Ayres et al. (NOvA Collaboration) [hep-ex/0503053].
[33]
A.K. Ichikawa, private communication;
the flux datas for various off-axis angles are available this web page;
http://jnusrv01.kek.jp/~ichikawa/jhfnu/nubeam/655km
[34]
S. Nakayama’s talk given at ”International Workshop on Far Detector in Korea
for the J-PARC Neutrino Beam”( http://newton.kias.re.kr/ hepph/J2K )
[35]
K2K Collaboration (S. Nakayama et al.),
Phys. Lett. B619 255 (2005) [hep-ex/0408134]