IPPP/06/10
DCPT/06/20
22nd February 2006
Leading neutron spectra
A.B. Kaidalova,b, V.A. Khozeb,c, A.D. Martinb and M.G. Ryskinb,c
a Institute of Theoretical and Experimental Physics, Moscow, 117259, Russia
b Department of Physics and Institute for Particle Physics Phenomenology,
University of Durham, DH1 3LE, UK
c Petersburg Nuclear Physics Institute, Gatchina, St. Petersburg, 188300, Russia
Abstract
It is shown that the observation of the spectra of leading neutrons from proton beams can be a good probe of absorptive and migration effects. We quantify how these effects modify the Reggeized pion-exchange description of the measurements of leading neutrons at HERA. We are able to obtain a satisfactory description of all the features of these data. We also briefly discuss the corresponding data for leading baryons produced in hadron-hadron collisions.
1 Introduction
Leading neutrons, which are produced from proton beams, are of special interest since the production process is dominated by exchange, see Section 2. Such leading neutron spectra have been measured recently in photon-proton collisions at HERA [1]-[5]. These data supplement measurements of leading baryon spectra made in hadron-hadron collisions many years ago [6]-[10]. By observing leading neutrons we have essentially a tagged beam. For example at HERA this beam may participate in deep inelastic scattering (DIS) or photoproduction. In this way both the structure function of the pion [4, 2] and the form of the underlying Reggeized trajectory [3] can be studied.
There is another aspect of such processes which merits particular study. Soft rescattering effectively leads to the absorption of leading neutrons with Feynman (which we denote ) close to 1; the role of this correction was originally studied in Refs. [11, 12]. At that time, these were essentially theoretical studies, which provided predictions for future measurements. Now detailed leading neutron data have become available from the experiments at HERA. These experiments measure the cross sections for producing leading neutrons with different and values, as functions of both the virtuality, , of the photon, and the c.m. energy, , of the incoming system. The HERA data offer the opportunity of seeing how absorption changes as a function of all these kinematic observables. We also show the importance of migration, or change of the kinematic variables, of the leading neutron due to rescattering effects. The ways to estimate the effects of absorption and of migration are discussed in Sections 3 and 4 respectively. The description of the HERA data, , is presented in Section 5. For completeness, in Section 6, we discuss the behaviour of leading baryons produced in hadron-hadron collisions, in particular in the processes and .
In exclusive reactions, the rescattering could produce new secondaries which has the effect of suppressing the rate. That is, an exclusive cross section is suppressed by absorptive effects. On the other hand, for an inclusive process the rescattering, will just change the energy and transverse momentum of the leading baryon, and will depopulate the region of large and small . From the viewpoint of an experimental trigger, for this appears as absorption, but it is better to consider it as a migration into an enlarged phase space. In particular, such a migration can affect the form of the effective (that is measured) trajectory, leading to a larger mean at lower . Of course, this may also modify the measurement of the pion structure function, , which is extracted from the HERA data.
2 Leading neutrons from exchange
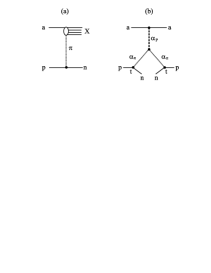
To begin, let us recall the triple-Regge formula which describes the inclusive processes with or . For close to unity the inclusive leading neutron spectra is given by the triple-Regge diagrams shown in Fig. 1. Thus we have
| (1) |
where ; and is the coupling of the Pomeron to the photon, via a pair, or the proton, depending on whether or . The above form, with only the dominant pion-exchange contribution, has been used by many authors, see, for example, Refs. [2, 13, 14]. Moreover, both the old hadron-hadron interaction data and the recent HERA results on the spectra of neutrons [3] clearly indicate the reggeization of pion exchange. In fact, detailed studies of hadronic interactions in the reggeized pion-exchange model [13, 14] have shown that the formula can be used in a broad range of , with .
The contribution of reggeized pion exchange to the inclusive production of baryons, with , is of the form
| (2) |
where is the pion trajectory with slope , and [15]. The invariant mass of the produced system is given by . The signature factor, and the difference between sin and factors in the denominators of (1) and (2), are absorbed in the effective vertex form factor . This form factor is usually taken to be of the form
| (3) |
where, from data at relatively low energies, we expect , see, for example, Ref. [14]. However more recent analyses find [16, 2].
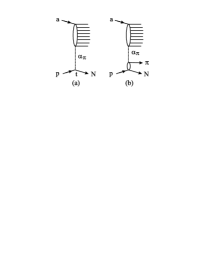
For the pion-exchange contributions to the spectra of both protons and neutrons, it is possible to take account, not only of the diagram of Fig. 2a, but also, of the diagram of Fig. 2b. Besides this we can include the contributions of exchanges, and also of resonance decays, such the -resonance contribution in the amplitude, to the leading and spectra. The calculations of the spectra of neutrons of Refs. [13, 14, 16], show that the diagram of Fig. 2a dominates, and that the contribution of the diagram of Fig. 2b is about 20 at most. On the contrary, the leading proton spectrum is dominated by the triple-Pomeron diagram; the diagram of Fig. 2a gives only about of the inclusive cross section for in the ISR energy range.
One interesting application of the leading neutron spectra at HERA is the possibility of using (2) to extract information on the total cross section, , for both real and virtual photons. This, in turn, allows a measurement of the pion structure function at very high energy or small Bjorken . The direct application of (2) to the HERA photoproduction data [2] leads to the result , which is about a factor 2 lower than the expected111Note that experimental estimates of at high energies, based on the absorptive corrections to the amplitude for and its interference with the amplitude, are about at the same energy [17]. Thus we expect the additive quark model estimates to be reliable. ratio of 2/3. However, so far, we have neglected the absorptive corrections, or so-called rescattering effects, to (2). These are very important at high energies. They reduce the predicted cross section, as well as modifying both the energy and the dependence of the inclusive spectra of leading neutrons. We discuss the form of the correction in the next Section, and present the leading neutron spectra at HERA in Section 5.
3 Unitarity effects and gap survival
The Born-type regge pole exchange diagram of Fig. 1 represents only the first approximation to the description of the leading neutron spectra at high energies. Multi-pomeron exchanges introduce modifications of the amplitudes, and lead to the restoration of unitarity [18, 19].
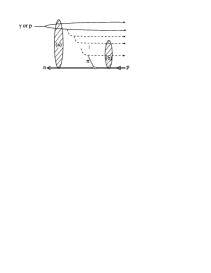
We use the space-time diagram of Fig. 3 to distinguish between two types of rescattering. First we have the eikonal scattering of the leading hadrons (either incoming or outgoing) indicated by exchange (a). The other possibility is the rescattering of the leading hadron on one of the intermediate partons in the central rapidity region, indicated by exchange (b).
In terms of Feynman diagrams, an additional Pomeron exchange leads to a negative contribution; that is absorptive corrections diminish the size of the predicted cross section. From the physical point of view, the inelastic interaction, shown by either exchange (a) or exchange (b) in Fig. 3, produces new secondary particles which populate the rapidity gaps and carry away energy from the leading neutron. In other words a leading neutron, with a large energy fraction , can only be observed in the small fraction of events which have no secondary inelastic interactions. The rescattering corrections therefore reduce the probability that the leading neutrons will be found in the large bins.
Technically the absorptive corrections are calculated in the following way. The most familiar are the eikonal-type corrections which are shown symbolically in Fig. 4, where only elastic rescatterings are taken into account. The corrections are well known:
| (4) |
where is the impact parameter, and is the contribution to the cross section for leading neutron production from the lowest order diagram of Fig. 1(b). The opacity is the impact representation of the single-pomeron contribution to elastic scattering, which can be determined from studies of the total and elastic processes; for a recent review see, for example, Ref. [20]. The formalism can easily be extended to take into account diffractive excitations of the initial and final hadrons. It leads to a multi-channel version of (4), see, for example [21, 18, 19]. Diagrams of this eikonal type have been considered in previous estimates of absorptive corrections to the spectra of leading baryons [11, 12].
Note that since increases with energy, the suppression of the Born cross section also increases with energy. The damping factor, exp, is strongest for small values of the impact parameter . Thus the absorptive suppression is greater for the reggeons than for -exchange, which, due to the behaviour at small , has a broader distribution in .
The unitarity corrections have an interesting effect on the -dependence of the cross section driven by pion-exchange, (2). As the pion pole is approached, that is as , the corresponding impact parameter becomes very large, , and the gap survival damping factor
| (5) |
Thus we anticipate a more complicated dependence than that given by eqs. (2) and (3). First, at very small , the survival factor rapidly decreases from at , finally reaching a value at large . However before then, the additional -dependence coming from the pion vertex and trajectory reveals itself, namely exp with . So, in (2), we have
| (6) |
Thus fitting the data using the single exponential form (3) may confuse the situation. Note that in the discussion below we will use the average value of
| (7) |
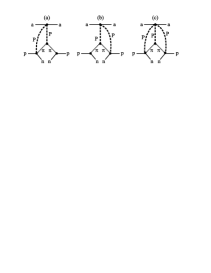
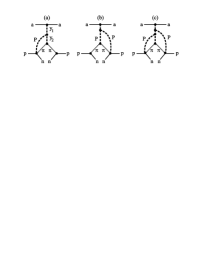
Another class of multi-pomeron diagrams corresponds to the modification of the upper reggeon in the triple-pomeron diagram (Fig. 6a), or of the lower reggeons (Fig. 6b), or of both (Fig. 6c). The diagrams of Fig. 6a modify only the dependence of the cross sections, and for the -exchange model can be absorbed in the behaviour of . The diagrams of Fig. 6b modify the dependence, and for the case can be by modifying the -trajectory (essentially the slope and the form factor. It is important, that to a good approximation, they do not depend on the energy222The unfactorizable diagram Fig. 6c can, in principle, have some weak dependence. .
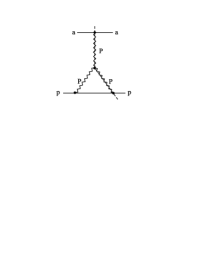
The multi-pomeron diagrams of Fig. 5 are only expected to become relevant at sufficiently high energies. That is when the energy is large enough for the mass of the produced system to itself be large enough for both the rapidity intervals and to be sufficiently large to accommodate pomeron exchange333Diagrams of this type were mentioned in our paper on dijet production at the Tevatron [18], but for this hard diffractive process they were small even at Tevatron energies.; that is with . Recall that with ; so for a typical value of we have . Note that rapidity intervals are included in the contributions of the diagrams of Fig. 4 and Fig. 6(b).
Let us study in more detail the diagram shown in Fig. 5a, which describes the process . This diagram is one of the -channel discontinuities of the triple-pomeron diagram for the elastic scattering amplitude444The summation of more complicated enhanced diagrams was discussed in [22], and more recently in [23]., see Fig. 7. Indeed the diagram is related to the triple-pomeron diagram for the elastic amplitude by the AGK cutting rules [24]. The corresponding coefficient is 4. So it is straightforward to obtain the correction to the cross section from diagram of Fig. 5a, provided we know the cross section of Fig. 7 in the triple-Pomeron region, . By fitting this cross section to the triple-Pomeron formula we can extract the strength of the vertex [25]. If we take the value of the effective vertex determined in the analysis of the old hadron data, then we find the correction due to the enhanced absorptive diagrams to be about 15.
So there is a relatively small contribution coming from the enhanced graphs of Fig. 5, that is from the rescattering of intermediate partons, as indicated by the shaded region (b) of Fig. 3. This is consistent with the fact that within the HERA range ( GeV) no energy dependence is observed in the leading neutron yields; see, for example, Figs. 6 of [4]555See also Figs. 2 and 4 of [5] for leading proton data, where the effect of enhanced diagrams should be the same., and Tables 14, 18 and Figs. 11, 12 of [2] which show, for fixed , the same probability666That is the same probability, , to observe the rapidity gap associated with pion-exchange. to observe a leading neutron for values of which decrease by more than an order of magnitude corresponding to an increase of the photon laboratory energy by more than a factor of 10. This flat experimental behaviour of the probability indicates that actually the absorptive corrections caused by the rescattering of intermediate partons are much smaller than might be expected from leading-order perturbative QCD calculations, similar to those presented in Ref. [26] (see also the discussion in [27, 28]).
4 The inclusion of migration
In order to compute the spectra of leading neutrons, we must consider the effects of migration, as well as of absorption. We assume that each rescattering spreads out the spectra of the leading baryon according to distribution777Strictly speaking, besides the migration in space, there may be charge-exchange (that is neutron to proton transitions). We neglect this effect since the goal of the present section is not a precise quantitative description, but rather a qualitative evaluation of the role and possible size of the ‘migration’ phenomena. For the same reason we use a simplified form, (8), of the leading baryon distribution.
| (8) |
where we take the slope GeV-2, and the intercept corresponding to secondary Reggeon exchange in the Kancheli-Mueller approach. Thus, after two rescatterings
| (9) |
Correspondingly, after rescatterings the distribution becomes
| (10) |
The probability of rescattering, or, equivalently, the mean number of rescatterings, at fixed impact parameter is given by the opacity
| (11) |
Here we focus attention on migration effects in , so . The cross section is, however, not the total cross section, since the process proceeds in two stages. First the photon fluctuates into a pair, which may be considered as a sum of vector mesons, and then the vector mesons rescatter on a nucleon. We therefore assume is the total cross section having in mind the additive quark model and/or meson dominance. is the slope of the rescattering amplitude (which we take to be GeV-2).
Note that the impact parameter in (11), which controls the absorption and migration effects, is not equal to the parameter which describes the space structure of ‘pure’ one-pion exchange in leading neutron production. The subscript denotes the ‘transverse’ position of the Pomeron vertex in Fig. 1(b). That is is Fourier conjugate of the neutron transverse momentum in the bare (Born) amplitude leading to the cross section in (2). However, due to the rather large values of , we may expect that the absorptive and migration effects will not be too strong — since the transverse distance between the leading baryon and the incoming photon (or -pair),
| (12) |
is, in turn, relatively large and the mean number of rescatterings at the periphery of the interaction (described by the amplitude ) is rather small. Here is the impact parameter for the amplitude describing the interaction of the incoming photon with the ‘effective’ pion (exchanged in the -channel); recall that the subscript denotes the position of the Pomeron vertex in Fig. 4.
To account for the fact that and are not the same, for each value of , we calculate the probability
| (13) |
where is the amplitude in impact parameter space for the photon-pion interaction. It is of the form (11) with the same slope GeV-2. Since the expression (2) already includes the probability of the ‘effective’-pion- interaction the probabilities are normalized to one; that is the normalization is fixed by the condition888Strictly speaking we should work with amplitudes and not with cross sections. Moreover the impact parameter in the amplitude may not be equal to the parameter in the conjugated amplitude . We find only after integration over the neutron transverse momentun . However to simplify the computations, here we use the semiclassical approximation, which assumes , using the Fourier transform just for the cross section. This approach, which is usually used in Monte Carlo simulations, may be justified by the fact that the effect of migration becomes important only at relatively large , see Fig. 8. So after we integrate up to GeV we find that the equality holds to rather good accuracy. Nevertheless, the fact that we need to correct the normalization in (13,14) is just the result of this semiclassical approximation.
| (14) |
for every value of .
Thus, to calculate the inclusive cross section for leading neutron production we have to integrate over the impact parameter
| (15) |
where
| (16) |
The factor accounts for the probability of the first interaction and the absorption at a given impact parameter , where is the mean number of interactions. The first term in the square brackets, , is the original cross section (2) in the representation, that is
The second term function accounts for the migration. When we sum over rescatterings, the spectra in representation takes the form
| (17) |
Thus the function in (16) is
| (18) |
The results shown below correspond to , but the spectra obtained for are very similar.

5 Predictions for leading neutrons at HERA
To predict the absorptive corrections to the pion-exchange formula (2), in which we set , we use (4), together with (11) in which we take mb. The value mb agrees with the Donnachie-Landshoff parametrization [29] and with the cross section evaluated by ZEUS via the -proton absorption in process [17]. The factor 1.3 takes account of the diffractive excitations of the initial and final hadrons [30].
The resulting predictions for the spectra of leading neutrons produced at HERA are shown in Fig. 8. In the first plot the ZEUS acceptance cut, mrad, has been imposed. In the next three plots we show the effect of imposing different cuts, rather than the cut, on the leading neutron. Each plot shows three curves. The dotted curve is the Reggeised -exchange prediction calculated from (2), whereas the continuous and dashed curves are computed from (15) and (16) with and without migration () included. The data points correspond to the leading neutron spectra measured by ZEUS [2].
As anticipated, the migration practically does not affect the region of large , where it is essentially enough to account for absorption only. However at smaller , the role of migration becomes quite important. First of all, it compensates the absorption (which occurs for close to 1), and provides the conservation of baryon charge. Next, it changes the behaviour of the and distributions of the leading neutrons; and modifies the ‘effective’ slope of the reggeized pion trajectory which was extracted from the data using the simplified formula (2).
From Fig. 8, we see that the predicted leading neutron spectrum is in satisfactory agreement with that measured by ZEUS. The absorptive corrections reduce the cross section given simply by Reggeised pion exchange by a factor of just less than 0.5 so that the predictions are in agreement with the data at large . The reduction by 0.4-0.5 is not inconsistent with an earlier calculation [31] which gave a rapidity gap survival factor of 0.34 for the resolved part of the photon wave function.
Moreover the data on the production of a leading neutron, together with either a pair of high jets [32] or charm [33], are consistent with a much larger value of , as is to be expected when we select events which sample a point-like photon, which directly interacts with high dijets. In particular, the probability to observe a leading neutron increases by up to a factor of 2.5 (that is increases up to about 0.9) when the momentum fraction carried by the dijet grows from 0 to 1, see Fig. 8c of Ref. [32]. In Ref. [34] the H1 dijet data were described, within NLO QCD [35], by pure pion-exchange without the inclusion of the survival factor, that is with . However the -dependence was not studied. Moreover a larger -slope parameter, , was used in [34] than the value used in [35]. Thus the slope in [34] is 3.5 times larger. In this way the absorptive corrections were mimicked in [34], see the discussion leading to eq. (6).
The comparison with the ZEUS data in Fig. 8 shows evidence of migration for . The points at lower indicate that there may be additional contributions999Note that in our computation we have already used . Thus we have no possibility to enlarge the neutron yield for by diminishing the value that we take for the slope . caused by the recombination of an initial valence quark with a sea quark in the neutron with , as well as by baryon charge transfer to the central region101010The ratio measured in the central region at RHIC and HERA indicates the presence of such an effect., whose description is beyond the present analysis.
The leading neutron measurements at HERA also allow us to explore the dependence of the problem. Unlike the naive Vector Dominance Model (VDM), where the effect of absorption should disappear as , in QCD (or in the Generalized VDM) these effects are expected to decrease as . It was shown in Ref. [2] that the behaviour observed at HERA is consistent with predictions [11, 12] based on the QCD dipole approach.
6 Leading baryon spectra in hadron-hadron collisions
Some years before the HERA data became available, leading nucleon spectra had been observed in hadron-hadron collisions in a variety of experiments, albeit at lower energies. Generally, these, and related, data are well described by the triple-Reggeon formalism. At first sight, it appears strange that no gap survival factor suppression, , was necessary — particularly in view of our discussion of the HERA data in the previous section. However, this factor is effectively included in the normalization of the triple-Reggeon vertices [25] which were determined by fitting the data. The only problem is the -Pomeron vertex, which must be consistent with the known result for the on-shell pion as . The on-shell vertex is known from an independent analysis of total and differential cross section data. Now, it is crucial to note that the -Pomeron vertex depends strongly on the value of , leading to an effective factor at . In the physical region of negative this factor is expected to be in the CERN ISR energy range [36, 37, 30]. Indeed, the indications for such absorptive corrections to -exchange were observed in data for production [8, 36]. Spectra of leading baryons in the Reggeized pion-exchange model have been described in papers [13, 38, 39, 16, 36, 37]. In papers [13, 38, 39] a phenomenological form-factor, which to some extent mimic absorptive effects, has been used.
The situation with inclusive nucleon-charge exchange in (and ) collisions, that is in the spectra of neutrons in -collisions and protons in -collisions, is not clear. The largest set of the highest energy data was obtained at the CERN ISR, Refs.[6] and [7]. These ISR spectra of neutrons have a rather different form. It was emphasized in Ref. [38] that the data of [6] are strongly different111111Note that in the CERN ISR paper [6] the cross section plotted in Fig. 7 is about 3 times smaller than that given in the Tables and in Fig. 6. from predictions of the pion-exchange model, and lead to a violation of the energy-momentum sum rule, while the data of [7] are in a reasonable agreement with theoretical predictions [39]. As mentioned above, the models of Refs. [38, 39] are based on Reggeized pion-exchange, with the gap survival factor represented by a form factor which, however, gave only a rather small effect (). The equivalent process was also measured [9] over range of energies, which partly overlap with ISR energy range and are consistent with the model of Ref. [38]. On the other hand there are data on the process at relatively low energies (11.6 GeV), which are lower than predictions of the pion-exchange model without the factor.
Thus the final picture for hadron-hadron processes is not clear. Some experiments are in agreement with the theoretical expectations of appreciable absorptive corrections to -exchange, while others appear to be described by simplified -exchange.
7 Summary
We have described all the main features of the leading neutrons observed at HERA, both in photoproduction and as a function of . For photoproduction we may refer to Fig. 8. We see that Reggeized pion-exchange on its own is insufficient to describe the production of leading neutrons. However the inclusion of absorptive corrections are found to reduce the -exchange prediction by a factor of just less than 0.5, and to bring the theoretical expectation in line with the data. Thus, after accounting for the rapidity gap survival factor , such data can be used to measure the cross section and the pion structure function. Moreover the value of the gap survival factor may be monitored by comparing the spectra of leading neutrons in dijet production at low with those for , where the cross section is dominated by the direct, point-like photon. Next, the dependence of the survival factor (which specifies the probability to observe a leading neutron) on the photon energy may be used to experimentally probe the contribution of the enhanced absorptive corrections of Fig. 5. The data appear to be flat in energy indicating only a small contribution from enhanced diagrams. This is relevant to the proposed Higgs searches in exclusive diffractive production at the LHC. Thus we conclude that the additional suppression of the exclusive Higgs cross section caused by the enhanced diagrams cannot be as large as mentioned in Ref. [26], see [28] for a detailed discussion.
We also found that the neutron spectrum shows some evidence of migration effects, see Fig. 8. Including migration slightly reduces the value extracted for the slope of the pion Regge trajectory; the reduction is about depending on the interval of used to measure .
Finally, in Section 6, we briefly reviewed the available experimental data for leading baryons produced in hadron-hadron interactions, which were obtained about 30 years ago. Here the experimental situation is confusing. Some experiments are in line with theoretical expectations, while others are not.
Acknowledgements
We thank Jon Butterworth, Albert De Roeck, Boris Kopeliovich and Graeme Watt for useful discussions. ABK and MGR would like to thank the IPPP at the University of Durham for hospitality, and ADM thanks the Leverhulme Trust for an Emeritus Fellowship. This work was supported by the Royal Society, the UK Particle Physics and Astronomy Research Council, by grants INTAS 00-00366, RFBR 01-02-17383 and 04-02-16073, and by the Federal Program of the Russian Ministry of Industry, Science and Technology 40.052.1.1.1112 and SS-1124.2003.2.
References
-
[1]
ZEUS Collaboration, M. Derrick et al., Phys. Lett B384 (1996) 388;
J. Breitweg et al., Nucl. Phys. B596 (2001) 3; Eur. Phys. J. C1 (1998) 81; ibid. C2 (1998) 237. - [2] ZEUS Collaboration, S. Chekanov et al., Nucl. Phys. B637 (2002) 3.
- [3] ZEUS Collaboration, S. Chekanov et al., Phys. Lett. B610 (2005) 199.
- [4] H1 Collaboration, C. Adloff et al., Eur. Phys. J. C6 (1999) 587.
- [5] H1 Collaboration, C. Adloff et al., Nucl. Phys. B619 (2001) 3.
- [6] J. Engler at al., Nucl. Phys. B84 (1975) 70.
- [7] W. Flauger and F. Monnig, Nucl. Phys. B109 (1976) 347.
- [8] S.J. Barish et al., Phys. Rev. D12 (1975) 1260.
- [9] B. Robinson et al., Phys. Rev. Lett. 34 (1975) 1475.
- [10] Y. Eisenberg et al., Nucl. Phys. B135 (1978) 189.
- [11] N.N. Nikolaev, J. Speth and B.G. Zakharov, hep-ph/9708290.
- [12] U.D. Alesio and H.J. Pirner, Eur. Phys. J. A7 (2000) 109.
- [13] K.G. Boreskov, A.B. Kaidalov and L.A. Ponomarev, Sov. J. Nucl. Phys. 19 (1974) 565.
-
[14]
K.G. Boreskov, A.B. Kaidalov, V.I. Lisin, E.S. Nikolaevskii and L.A.
Ponomarev, Sov. J. Nucl. Phys. 15 (1972) 203;
L.A. Ponomarev, Sov. J. Part. Nucl. 7 (1976) 70. -
[15]
V. Stoks, R. Timmermans and J.J. de Swart, Phys. Rev.
C47 (1993) 512;
R.A. Arndt, I.I. Strakovsky, R.L. Workman and M.M. Pavan, Phys. Rev. C52 (1995) 2120. - [16] B.Z. Kopeliovich, B. Povh and I. Potashnikova, Z. Phys. C73 (1996) 125.
- [17] ZEUS collaboration, J.Breitweg et al., Eur. Phys. J. C2 (1998) 247.
- [18] A.B. Kaidalov, V.A. Khoze, A.D. Martin and M.G. Ryskin, Eur. Phys. J. C21 (2001) 521.
-
[19]
A.B. Kaidalov, Phys. Rep. 50 (1979) 157;
S.N. Ganguli and D.P. Roy, Phys. Rep. 67 (1980) 201. - [20] E. Gotsman, E. Levin, U. Maor, E. Naftali and A. Prygarin, in HERA and the LHC, CERN-2005-014, p. 221.
- [21] K.A. Ter-Martirosyan, ITEP preprints No. 70, 71 (1975); 7, 11, 133-135, 158 (1976).
- [22] A. Schwimmer, Nucl. Phys. B94 (1975) 445.
-
[23]
K.G. Boreskov et al., Eur. Phys. J. C44 (2005) 523;
Yu.V. Kovchegov and E. Levin, Nucl. Phys. B577 (2000) 221;
S. Bondarenko, E. Gotsman, E. Levin and U. Maor, Nucl. Phys. A683 (2001) 644. - [24] V. Abramovsky, V.N. Gribov and O.V. Kancheli, Sov. J. Nucl. Phys. 18 (1974) 308.
-
[25]
A.B. Kaidalov, V.A. Khoze, Yu.F. Pirogov and N.L. Ter-Isaakyan, Phys. Lett. 45 (1973) 493;
R.D. Field and G.C. Fox, Nucl. Phys. B80 (1974) 367. - [26] J. Bartels, S. Bondarenko, K. Kutak and L. Motyka, Phys. Rev. D73 (2006) 093004.
- [27] A.D. Martin and M.G. Ryskin, in HERA and the LHC, CERN-2005-014, p. 369.
- [28] V.A. Khoze, A.D. Martin and M.G. Ryskin, JHEP 0605 (2006) 036.
- [29] A. Donnachie and P.V. Landshoff, Phys. Lett. B296 (1992) 227.
-
[30]
V.A. Khoze, A.D. Martin and M.G. Ryskin, Eur. Phys. J. C18 (2000) 167;
A.B. Kaidalov, Phys. Rep. 50 (1979) 157. - [31] A.B. Kaidalov, V.A. Khoze, A.D. Martin and M.G. Ryskin, Phys. Lett. B567 (2003) 61.
- [32] ZEUS collaboration, J. Breitweg et al., Nucl. Phys. B596 (2001) 3.
- [33] ZEUS collaboration, S. Chekanov et al., Phys. Lett. B590 (2004) 143.
- [34] H1 collaboration, A. Aktas et al., Eur. Phys. J. C41 (2005) 273.
- [35] M. Klasen and G. Kramer, Phys. Lett. B508 (2001) 259.
- [36] K.J.M. Moriarty, J.H. Tabor and A. Ungkichanukit, Phys. Rev. D16 (1977) 130.
-
[37]
B.G. Zakharov and V.N. Sergeev, Sov. J. Nucl. Phys. 28 (1978) 689;
A.G. Azcarate, Phys. Rev. D17 (1978) 3022;
B.G. Zakharov and V.N. Sergeev, Sov. J. Nucl. Phys. 38 (1983) 801. - [38] K.G. Boreskov, A.A. Grigorian and A.B. Kaidalov, Sov. J. Nucl. Phys. 24 (1976) 411.
- [39] K.G. Boreskov, A.A. Grigorian, A.B. Kaidalov and I.I.Levintov, Sov. J. Nucl. Phys. 27 (1978) 813.