On solar neutrino fluxes in radiochemical experiments111The paper is extended version of the report presented on 9th International Pulkovo Conference on Solar Physics, Saint-Petersburg, Russia, July 4-9, 2005.
Abstract
We analyze fluctuations of the solar neutrino flux using data from the Homestake, GALLEX, GNO, SAGE and Super Kamiokande experiments. Spectral analysis and direct quantitative estimations show that the most stable variation of the solar neutrino flux is a quasi-five-year periodicity. The revised values of the mean solar neutrino flux are presented in Table 4. They were used to estimate the observed pp-flux of the solar electron neutrinos near the Earth. We consider two alternative explanations for the origin of a variable component of the solar neutrino deficit.
1 Introduction
Investigation of solar neutrinos is one of the key directions of modern astrophysics. The data from neutrino observatories (Super Kamiokande, GALLEX, SAGE and SNO) allowed to get important information on both the solar neutrinos and the properties of neutrino as an elementary particle. The observed solar neutrino flux turned out to be by a factor of at least 2 smaller than predictions of the standard solar model (SSM). The currently most commonly accepted mechanism responsible for the solar neutrino deficit is the process of neutrino oscillations whereby electron neutrinos may be converted into either muon or tau neutrinos. This transformation is the most likely to be resulted from the effect of Mikheev, Smirnov and Wolfenstein (MSW) [Mikheev and Smirnov (1987)] taking place as neutrinos propagate through matter in the solar interior. The MSW effect is based on the differences in interaction with matter for neutrinos of different types.
Solar neutrino studies have been repeatedly reviewed. The latest detailed review of the solar neutrino problem was presented by Bahcall [Bahcall et al. (2004)]. New important results have been obtained in the recent experiments with anti-neutrino from the ground-based reactors (the KamLand experiment [KamLAND collaboration (2004)]).
The total deficit of the solar neutrino flux as compared to SSM can be presented as a sum of two components: a constant component, caused purely by neutrino oscillations, and a variable one, connected presumably with solar activity and, in particular, with magnetic field variations in the interior of the Sun.
A physical mechanism, responsible for such kind of variability can be a so called “resonant spin-flavor precession” (RSFP, see, e.g., [Schechter and Valle (1981), Akhmedov (1998), Lim and Marciano (1988)]), which involves a nonzero magnetic moment of neutrino. In this case, a strong magnetic field, which probably exists at the base of the solar convective zone, causes a strong spin precession, which converts some of the left-handed electron neutrinos, produced by nuclear reactions in the core, into sterile right-hand neutrinos which do not participate in the weak interaction. The stronger magnetic field is, the more probable is neutrino transition from one state to another, resulting in reducing the number of neutrinos of certain type at the surface of the Earth. Although the magnetic moment of a Dirac neutrino is essentially small () due to quantum radiative corrections, there exist models, in which the value of neutrino magnetic moment is in the interval from to [Klapdor-Kleingrothaus and Zuber (2000)].
Due to admixture of the strong and electromagnetic interactions to the week interaction in the super-symmetry theory there is no direct dependence between the magnetic moment and the mass of neutrino. An interesting variant arises in the SUSY theory with SU(2) symmetry, in which the right- and left-hand neutrinos form a close doublet. In this situation the neutrino magnetic moment is non-zero even in the case of zero mass. Theoretical studies have shown that if the mass of electron and muon neutrino is under 10 eV, the magnetic moment of neutrino of both types is —. This value of magnetic moment can affect the solar neutrino experiments, especially taking into account that the magnetic field in the Sun’s interior can exceed G at the distance of 0.2 solar radius [Couvidat et al. (2003), Balantekin and Volpe (2004)].
Although an existence of a variable component of the solar neutrino flux and its possible connection with solar activity remains under discussion for many years, the ultimate conclusion has not been made so far. A number of authors have reported this connection (see, e.g., reviews [Ikhsanov and Miletsky (2002), Ikhsanov and Miletsky (2003)]), while the other criticize such claims — specifically the claim that the neutrino flux is anti-correlated with some indices of solar activity [Klapdor-Kleingrothaus and Zuber (2000)].
A major part of recent studies have not revealed variations of the solar neutrino flux [Cattaneo (2003), Yoo et al. (2003), Pandola (2004)], but some authors still report observations of the variable component of the solar neutrino flux [Milsztajn (2003), Caldwell and Sturrock (2003)]. The latter concluded about possible contribution of the spin-flavor process to the variable part of the solar neutrino deficit.
Searching for associations with the solar activity cycle, most investigations focused on correlation (anti-correlation) with the 11- and 2-year periodicity. Ikhsanov and Miletsky [Ikhsanov and Miletsky (1999), Ikhsanov and Miletsky (2002)] have shown that a periodicity close to 5 years plays the most important role in the variations of the neutrino flux. They have made an attempt to find indices of solar activity, variations of which show pronounced manifestation of the quasi-5-year periodicity.
In this paper we address some pros and cons of the neutrino flux deficit variations with the periods in excess of one year. First we examine the data from neutrino experiments by means of spectrum analysis and show that the data from Homestake and GALLEX exhibit flux fluctuations at the -level, while in the data from GNO and SAGE these oscillations are within errors. Then we make quantitative estimates of the neutrino flux variations and discuss their possible relation to the solar activity. We argue that the mean flux estimates from the radiochemical experiments need correction and present the revised values in Table 4. They were used to evaluate the observed pp-flux of the electron neutrino at the surface of the Earth.
2 Variations of the solar neutrino flux
We use the data, obtained with the Cl-Ar detector Homestake [Cleveland et al. (1998)] with a threshold value of 0.814 MeV, the data from the observatories GALLEX, GNO [Kirsten (1999), Pandola (2004)] and SAGE [Abdurashitov et al. (2002)] working with gallium-germanium detector and a threshold value of 0.233 MeV, as well as Super-Kamiokande data [Yoo et al. (2003)], with a threshold value of 7 MeV and averaged for 10 days.
Fig. 1a shows the power density spectra (PDS) for the neutrino flux (or, more exactly, for the 37Ar counting rates) from the Homestake experiment, calculated using the Lomb-Scargle technique [Scargle (1982)]. Two peaks with the periods of 4.6 and 2.1 years can be distinguished at the level of confidence probability equal to or a bit higher than 95% (Table 1). The levels of confidence probability of the most pronounced peaks were determined by means of shuffle technique [Sturrock et al. (1998)], with 10 000 test spectra having been computed for each estimate. This evaluation of confidence allows to take off some limitations of standard methods being in use in this kind of investigations. For example, a criterion, which was applied in some recent papers [Yoo et al. (2003), Pandola (2004)], significantly diminish the confidence level of the revealed periods. It should be noted here that statistical criteria being used in these studies contain assumptions about stationarity and normality of the data, while the processes under investigation are non-stationery and quasi-periodical, and, hence, require more refine and adequate criteria of significance, especially if the amplitudes of quasi-periodical variations are relatively small. In such cases it makes sense to perform additional analysis by means of heuristic methods.

| Period (years) | 10.6 | 4.6 | 2.1 |
| Power Spectral Density | 1.4 | 3.2 | 3.8 |
| Level of confidence probability (%) | 67 | 96 | 97 |
Let us note that numerous peaks around a 2-year period are caused by its instability [Ikhsanov and Miletsky (2002), Ikhsanov and Miletsky (2003)], and a duration of solar neutrino data is not long enough to permit a reliable detection of 11-year periodicity. In order to check, to what extent the character of neutrino fluctuations is affected by the background value, we have removed the runs with a large background level ( count per day) from the Homestake series (about 1/3 of total number) [Cattaneo (2003)]. The power spectrum was then calculated. The result, shown in Fig. 1 b,c, allows to conclude that the influence of the background value is not essential: the same peaks, corresponding to 10, 4.6 and 2 years are seen in the PSD.
| No | Date | Maximum | Number | Minimum | Number |
| at/day | of runs (n) | at/day | of runs (n) | ||
| 1a | 1970.5 | - | 0.27 0.20(?) | 4 | |
| 1b | 1970.5 | - | 0.21 0.19 (?) | 3 | |
| 2a | 1973.0 | 0.49 0.47(?) | 5 | - | |
| 2b | 1973.0 | 0.62 0.59(?) | 3 | - | |
| 3a | 1975.0 | - | 0.44 0.31 | 6 | |
| 3b | 1975.0 | - | 0.38 0.15 | 3 | |
| 4a | 1977.8 | 0.72 0.34 | 8 | - | |
| 4b | 1977.8 | 1.00 0.13 | 3 | - | |
| 5a | 1980.2 | - | 0.17 0.19(?) | 8 | |
| 5b | 1980.2 | - | 0.02 0.03(?) | 3 | |
| 6a | 1982.3 | 0.54 0.34 | 8 | - | |
| 6b | 1982.3 | 0.65 0.14 | 3 | - | |
| 7a | 1984.3 | - | 0.48 0.34 | 9 | |
| 7b | 1984.3 | - | 0.31 0.11 | 3 | |
| 8a | 1986.8 | 0.80 0.32 | 4 | - | |
| 8b | 1986.8 | 0.85 0.18 | 3 | - | |
| 9a | 1989.0 | - | 0.49 0.30 | 9 | |
| 9b | 1989.0 | - | 0.28 0.24 | 3 | |
| 10a | 1991.5 | 0.59 0.24 | 8 | - | |
| 10b | 1991.5 | 0.75 0.20 | 3 | - | |
| Mean | a | 0.66 0.31 | 28 | 0.47 0.32 | 24 |
| Mean | b | 0.77 0.17 | 12 | 0.32 0.18 | 9 |
| Mean | a | 0.566 0.313 | 52 | ||
| Mean | b | 0.545 0.173 | 21 | ||
A short duration of data series from the GALEX+GNO, SAGE and SK experiments does not allow to reveal periodicities longer than 2 years in their PSD. Fig. 2a shows that PSD of a whole GAL+GNO data series exhibits only three modes in excess of : 1.25, 2.34 and 4.1 years. Separate presentation of the PSD for the series GAL (Fig. 2b) and GNO (Fig. 2c) indicates that these peaks are seen only in the first PSD, with the 2.2-year period being revealed with a large confidence (). It should be noted that three peaks of quasi-two-year oscillations are clearly seen on the graph representing the original data series (see Fig. 1 [Pandola (2004)]). The PSD of the GNO series does not show any significant periods, while the PSD of the SK series (for the same time interval) exhibits two peaks at a -level: 2.6 and 1.22 years.

Another picture is seen in the SAGE experiment. In the PSD for a whole data series (Fig. 3a) only one peak at 2.1 year can be suspected, and it is noticeably below a -level. Separate presentations of the PSD for the time intervals 1990-1996 and 1997-2001 show no significant peaks either, although the quasi-2-year peaks are in the latter case even higher than in the Homestake data for 1989-1994 (Fig. 3d). The above analysis allows to conclude that detection of a 2-year quasi-periodicity in the neutrino flux data is unstable and hardly reliable.

Thus, the data from the Homestake experiment indicate that a quasi-5-year period is the most stable in the solar neutrino flux fluctuations. Let us consider pros and cons of reliability of this periodicity.
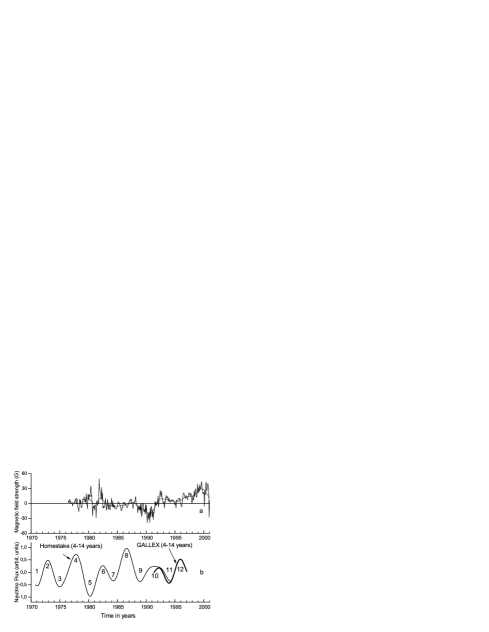
1. The smoothing of the Homestake series using the broadband Butterworth filter (with the frequency interval of maximum transmission, corresponding to the period interval 4-14 years) [Ikhsanov and Miletsky (1999)] reveals six consequent peaks on a 5-year wave (with account for GALLEX data) with the average distance between maxima of about years (Fig. 4b). As can be seen from this figure, the distance between the centers of neighboring hills changes from 3.9 to 5.3 years, i.e. the neutrino flux variations do show a 5-year periodicity.
2. Table 2 presents the average values of the counting rates from the Homestake experiment for all the runs within years from the centers of maxima and minima of the flux fluctuations from Fig. 4b (case “a”). Besides of that, the same calculations have been done for the case “b”, when only three consecutive runs have been taken within the same limits (with the maximum and minimum flux values respectively). The statistical errors on the confidence level of 68% () are also given here. The values marked by “?” have statistical errors at the level of flux estimate itself. They were not taken into account when calculating the column mean values. The following conclusions can be made examining the Table 2:
Firstly, all flux values from the column of maxima are higher than minimum values next to them. In the case (b), the difference between neighboring minima and maxima are mostly exceeds of , and is on average , that coincides with the confidence level, determined from the power spectrum (Table 1). In the case (a) this difference is significantly smaller - on average.
Secondly, the maximum values of the neutrino flux can be divided into two groups: high values N 4,8,12 and low values N 2,6,10. The column mean value of the maximum neutrino flux is at/day, that corresponds to 46% of the SSM value (1.44 at/day), while the maxima N4,8 constitute 53% of the SSM value. Taking into account that according to Table 2 the mean minimum value of the neutrino flux is at/day, that is 33% of the SSM value, the modulation of the flux fluctuations can be as high as 20% of the SSM value. However, this value could be considered as statistically justified only if statistical errors given above were at least by a factor of 3 smaller than those from the Homestake experiment. That is why the only statistically significant estimate from the Homestake experiment is the mean value of neutrino flux, determined as an average of the mean maximum and minimum values from Table 2. It equals at/day, that is of the SSM value. The error was estimated as a root-mean-square deviation from the mean () for . We could leave off at this point, as many other authors considering this question. But the fact that a five-year fluctuation of the neutrino flux manifests itself continuously throughout the whole period of observations (Fig. 4b) allows to claim the reality of this quasi-periodicity in the Homestake series.
Thirdly, a comparison of the maxima positions on the neutrino flux curve (Fig. 4b) with the cyclic variations of the large-scale solar magnetic field strength on the transit of neutrinos from the solar core to the Earth (Fig. 4a) reveals a certain regularity. The positions of high maxima (N 4,8,12) coincide with the phases of minima of the 11-year cycle in the equatorial zone of the large-scale magnetic field. The maxima of smaller height (N 6,10) were observed during the change of polarity of the large-scale magnetic field in the equatorial zone, while the minima of the neutrino flux (N 5,9) occurred during the periods of maxima of the 11-year cycle. Thus, the Homestake series shows fluctuations with the quasi-periods of about 10 and 5 years, thus demonstrating their interconnection with the cyclic changes of the solar magnetic field. Such regularity can hardly be an accidental phenomenon.
This problem could be solved by comparison with the data from other independent experiments. Unfortunately, observations with the Homestake experiment finished at the first set-out of other neutrino experiments. However, the data from GAL+GNO can be considered as some resumption of the Homestake observations: they show Homestake-like PSD (Fig. 1a, 2a) and a presence of quasi-5-year hills.
| No | Date | Maximum (data in SSM units) | Number of runs (n) | Minimum (data in SSM units) | Number of runs (n) | Experiment |
|---|---|---|---|---|---|---|
| 1 | 1991.8 | 0.82 0.26 0.59 0.62(?) | 9 9 | GALLEX SAGE | ||
| 2 | 1994.2 | 0.59 0.27 0.79 0.54(?) | 15 10 | GALLEX SAGE | ||
| 3 | 1996.6 | 0.99 0.28 0.42 0.15 0.44 0.05 | 11 7 22 | GALLEX SAGE SK | ||
| 4 | 2000.2 | 0.41 0.06 0.58 0.34 0.46 0.05 | 7 9 17 | GNO SAGE SK | ||
| 5 | 2001.8 | 0.61 0.24 | 7 | GNO |
Similar to Table 2, Table 3 presents the neutrino flux values GAL+GNO and their standard deviations within the time intervals, which have been chosen shorter than in Table 2 (0.6–0.9 year) in order to get approximately the same number of runs. The centers of these time intervals are given in the second column of Table 3. The flux values from the SAGE and SK experiments during the same time intervals are presented in the second and third rows, respectively. For the sake of further comparison, the fluxes have been normalized to the corresponding SSM-values. Similarly to the Homestake data, Table 3 shows that the GAL+GNO count rates (flux values) from the column “Maximum” are in all the cases higher than the neighboring minima. This difference is particularly noticeable between the fluxes at the phases of minimum (N3) and maximum (N4) of the solar cycle - . However, the data from SAGE experiment shows an opposite behavior during the same time intervals - the values from the column “Minimum” are higher than the values from the column “Maximum”, although the difference between them remains within errors. What is the reason for so significant divergency of results obtained from the same Gallium experiment? First of all, it is connected with large observational errors. Table 3 shows that the SAGE flux estimates before 1996 (hereafter, SAGE I) are contaminated with errors at the level of or even higher than the flux values themselves (N1). Such cases are marked by “?” (as in Table 2). However, from 1996 onwards (Sage II) the errors are at the level compared to that of the GAL+GNO and Homestake experiments.
Thus, Table 3 reveals that a comparison of the neutrino flux at the phases of minimum and maximum (N4 and N3, respectively) allows to conclude that the series SAGE and GAL+GNO show connection with solar activity, although within errors.
3 Discussion
Studies of different periodicities in the solar activity (from the index of sunspots areas and Wolf numbers to the global magnetic field of the Sun) in the range 1–11 years (see [Ikhsanov and Miletsky (1996), Ikhsanov and Miletsky (1998)] and references therein) have shown that in addition to the 11-year cycle there exist three quasi-periodic modes centered at 1.3, 2.1 and 4.4 years. As can be concluded from the Figures 1–4 and Table 2, these and only these quasi-periodic modes have been observed in the variations of the solar neutrino flux. A natural question arises, if the observed fluctuations result from a real change of the neutrino flux or they are caused by an exterior effect on the experiment, operating synchronously with solar activity.
If the Homestake data really reflect the value of incoming neutrino flux from the Sun, then, according to Table 2, a total deficit of the neutrino flux consists of constant and variable components. The constant component of the flux deficit can be determined as a difference between the estimated SSM flux and the maximal observed flux, that is about 50%, according to Table 2. Then a variable component can constitute about 20% of the SSM value. According to recent theoretical and experimental studies, the constant component of the flux deficit can be explained in the frame of neutrino oscillations theory (MSW-effect) [Mikheev and Smirnov (1987), Klapdor-Kleingrothaus and Zuber (2000)], while interpretation of the second (minor) component of the flux deficit requires implementation of the mechanism accounting for variations of the solar magnetic field. Such mechanism is likely to be a “resonant spin-flavor precession” (RSFP), which implies a significant magnetic moment of neutrino.
However, two parallel observational series of the Ga-experiment, SAGE and GAL+GNO (see Table 3), provide controversial results on the variable component of the neutrino flux deficit. Let us note, that in spite of relative scarceness of the data (1990-2003), Table 3 allows to make some important conclusions. As mentioned above, the table reveals that during the time interval 1990-1996 (N1,2) the errors in the SAGE data are very significant. The same can be seen from the mean flux value calculated within this period of time : SNU. However, this flux value and large errors are caused presumably by the runs, in which the flux estimate exceeded the mean value by a factor of 2-3. After removal of these known too high estimates of 5 runs, one finds SAGE I to be SNU (), or SSM. Although a root-mean-square error remains large, the mean flux value is in good agreement with the mean flux of SAGE II - SNU ( SSM), calculated for the time interval 1996–2001 (48 runs). Taking into account that in 1996 the observing programm was changed [Abdurashitov et al. (2002)], SAGE I and SAGE II can be considered as two independent series.
Addressing Table 3 again, we find that an averaged counting rate, determined as a half-sum of the column-mean values for “Maximum” and “Minimum”, is about 0.50 SSM for SAGE II and GNO, while for the GALLEX series it is 0.75 SSM, i.e. the latter case shows a significant shift of the zero point with respect to the SAGE and GNO data. According to the SAGE data, the constant component of the flux deficit is of the order of 50%, while a variable component, in contrast to GALLEX, is within errors. In this connection, it seems necessary to consider an alternative reason for the variable deficit component to arise in the Homestake and GALLEX data, namely, an unproper background reduction.
As shown by Cattaneo [Cattaneo (2003)], the neutrino flux values from the Homestake data are strictly correlated with the background level. His main conclusion was that the runs with high background level are unreliable and should be excluded from the further analysis. Having removed such runs (about one third of the total amount), he managed to increase a mean neutrino flux in the Homestake experiment up to atom/day. The removed 30% of the runs belong predominantly to the first half of the series, while the second half displays the neutrino flux which is on average systematically higher by approximately the same value. It is clearly seen on the low flux values and large errors in the case N1, and particularly N5 of Table 2, and just in these cases the background magnitude is in excess of 0.027 at/day. The derived above mean counting rate of the solar neutrino in the Cl-experiment ( atom per day, according to Table 2) is in good agreement with the value obtained by Cattaneo, while the commonly adopted value atom/day, presented by Clevelend [Cleveland et al. (1998)], is obviously underestimated and corresponds to the minimal flux derived from Table 2.
However, as seen in Fig. 1c and Table 2, even a new mean flux estimate does not essentially change a shape of PSD, that is it still shows neutrino flux fluctuations, corresponding to quasi-periods of 10, 4.6 and 2 years. That is why it seems reasonable to unite a statement about a background level with that about its dependence on the solar activity.
Really, analogous to the Homestake experiment, the variable flux component in the SAGE and GNO observations contributes about 0.20 of the SSM value, but in the GAL+GNO experiment the maximum neutrino flux was observed at the phase of minimum of the 11-year solar activity cycle, while in the SAGE experiment - at the phase of maximum. This means that flux fluctuations are likely to be connected with an opposite reaction of these two experiments on the influence of solar activity, rather than with a real change of the solar neutrino flux. Then the amplitude of these fluctuations of the neutrino flux, depending on the phase of the 11-year solar activity cycle, lies within the limits SSM relative to the mean solar neutrino flux. In this case the maximum neutrino flux in the Cl- and Ga-experiments is likely to be about 3.83 SNU and 77.6 SNU, respectively. The PSD on Fig. 2d evidences that an influence of this unknown factor, that is an influence of solar activity on the experimental results, may extend over the SK-experiment as well.
According to Vladimirsky and Bruns [Vladimirsky and Brunce (2004)], this factor can be connected with the influence of geophysical factors, controlled by the solar activity, on the physicochemical kinetics of the target material.
The GALLEX data from Table 3 display the same picture as the Homestake data, with the flux value from the column “Minimum”, SSM, being significantly higher than the mean flux estimate in the SAGE and GNO experiments. This means that the GALLEX series should not be used in calculation of the mean value over all the series of the Ga-experiment.
Table 4 presents the summary of revised values for the neutrino counting rates in the Cl- and Ga-experiments, along with the flux values from SK and SNO [Fukuda et al. (2004)]. These data allow to conclude that the observed energy spectrum of the electron neutrinos, normalized to SSM, demonstrates a decrease of the neutrino flux relative to SSM with an increase of their energy. This decrease occurs nonlinearly, since the most rapid decay is observed in the intermediate energy range.
| Experiment | Data (SNU) | SSM flux (SNU) | Data (in SSM units) |
|---|---|---|---|
| SAGE (71Ga) I | 67.1 7.9 | 129 8 | 0.520 0.061 |
| II | 66.1 5.3 | - | 0.512 0.041 |
| GNO (71Ga) | 62.9 6.0 | 129 8 | 0.488 0.042 |
| Homestake (37Cl) | 3.03 0.22 | 7.7 1.2 | 0.393 0.029 |
| Super Kamiokande (H2O) | 2.390.07 (106cm-2s | 5.150.72 (106cm-2s | 0.465 0.014 |
| SNO (D2O) | 1.800.11 (106cm-2s | - | 0.349 0.022 |
It seems worthwhile to evaluate the flux of pp-neutrinos, constituting a main part of the solar neutrino spectrum, using the experimental data listed in Table 4.
Let us adopt the neutrino counting rate in the Ga-experiment to be SNU, as having the least error value. This counting rate is composed of all the components of the solar neutrino flux: pp+, where , and the subscript “o” shows that this is an observed value. Evaluation of errors will be discussed later.
Using the SNO flux and the cross section for 8B neutrinos in the SSM form, cm-2, we find the contribution of 8B neutrinos to the Ga-experiment to be 4.3 SNU. Subtracting this value from the total counting rate of the Ga-experiment, one gets SNU.
The observed counting rate in the Cl-experiment is SNU. Using again the SNO flux and the cross section in SSM, cm-2, we find the contribution of 8B neutrinos to the Cl-experiment to be 2.05 SNU. Thus, Fo(Cl)=0.98 SNU. Taking after Abdurashitov et al. (2002) that the energy-dependent surviving factor with respect to SSM, Fo(Ga)/Ft(Ga), is the same as in the Cl-experiment, Fo(Cl)/Ft(Cl)=0.527, we get Fo(Ga)=0.527Ft(Ga)=24.4 SNU. However, a transition surviving factor in this form essentially depends on the flux ratio of the SNO- to Cl-neutrinos in the SSM. To diminish this influence, we multiplied the transition factor by the value of this ratio. Then, Fo(Ga)=0.47 Ft(Ga)=21.7 SNU. Thus, the observed pp-counting rate in the Ga-experiment is 40.1 SNU. The results obtained above are collected in Table 5.
| Neutrino source | Cl (SNU) | Ga (SNU) |
| PP | 0 | 40.115.6 |
| 8B | 2.050.20 | 4.31.0 |
| F∗ | 0.980.23 | 21.78.7 |
| sum | 3.030.22 | 66.15.3 |
| F∗=7Be + CNO + pep + hep | ||
Similarly, we have estimated the pp-counting rate for the maximal flux values in the Cl- and Ga-experiments as 42.1 SNU.
In order to get the observed pp-flux of electron neutrinos on the Earth, one can divide the obtained counting rate by the SSM cross section for electron neutrinos, cm2, thus getting cm2c-1 and cm2c-1, respectively.
For more precise evaluation of the observed pp-flux it is necessary to measure 7Be flux, which constitutes a major part of Fo(Ga), and, naturally, to diminish the influence of the statistical and systematical errors in the Ga-experiments.
4 Conclusions
The analysis of power spectra for the series of neutrino experiments has revealed that they display, 11-, 5-, 2- and 1.3-year quasi-periodicities, which are also observed in the solar activity. The most stable one turns out to be a quasi-5-year fluctuation of the neutrino flux detected in the radiochemical experiments. Quantitative estimates of the amplitude of these fluctuations have shown that the variable component of the neutrino flux deficit is likely to be connected with cyclic changes of the solar magnetic field.
We have considered two alternative possibilities to explain an origin of the variable component of the solar neutrino deficit. The first possibility implies real changes of the solar neutrino flux, while the second one suggests that the observed fluctuations are due to effect of an unknown factor, which operates synchronously with the solar activity and influences the results of neutrino experiments. The second possibility is supported by the fact that the solar activity seems to produce an opposite effect on the detection of neutrino flux in the GAL+GNO and SAGE experiments (Table 3). In order to check this assertion, it might be useful, in particular, to perform synchronous observations in SAGE and GNO. In any case, the maximum deviation from the averaged neutrino flux is SSM.
We argue that earlier reported average neutrino flux values derived with the radiochemical experiments need corrections. The revised values, given in Table 4, turn out to be larger for the Homestake data, and smaller for the SAGE data, than those previously published. The revised counting rates have been used to estimate the observed pp-flux of the electron solar neutrino at the Earth as SSM.
Any further refinement of the values presented in Tables 4 and 5 as well as a study of variable component of the solar neutrino flux deficit, require, in particular, significant reduction of the systematic and statistical errors in the neutrino experiments (see Tables 2, 3).
Acknowledgements.
The authors are grateful to Dr. N. Beskrovnaya for her assistance in preparation of this manuscript. The work was supported by the Program of the Presidium of the Russian Academy of Sciences “Non-stationary phenomena in astronomy”.References
- Abdurashitov et al. (2002) Abdurashitov J.N., et al.: 2002, astro-ph 0204245.
- Akhmedov (1998) Akhmedov E.Kh.: 1988, Phys. Lett., 213, 64.
- Bahcall et al. (2001) Bahcall J.N., Pinsonneault M.H., Basu S., et al.: 2001, Astrophys. J., 555, 990.
- Bahcall et al. (2004) Bahcall J.N., Gonzalez-Garcia M.C., Pena-Garay C., et al.: 2004, hep-ph, 0406294.
- Balantekin and Volpe (2004) Balantekin A.B., Volpe C.: 2004, astro-ph, 0111148.
- Caldwell and Sturrock (2003) Caldwell D.O., Sturrock A.: 2003, hep-ph, 0309191.
- Cattaneo (2003) Cattaneo P.W.: 2003, astro-ph, 0311534.
- Cleveland et al. (1998) Cleveland B.T., Daily T., Davis R., et. al.: 1998, Astrophys. J., 496, 505.
- Couvidat et al. (2003) Couvidat S., Turck-Chieze S., Kosovichev A.: 2003, Astrophys. J., 599, 1434.
- Fukuda et al. (2004) Fukuda Y., et al.: 2004,hep-ex., 0405075.
- Ikhsanov and Miletsky (1996) Ikhsanov R.N., Miletsky E.V.: 1996, Izvestiya GAO, 211, 163.
- Ikhsanov and Miletsky (1998) Ikhsanov R.N., Miletsky E.V.: 1998, Izvestiya GAO, 212, 165.
- Ikhsanov and Miletsky (1999) Ikhsanov R.N., Miletsky E.V.: 1999, Proceedings Conf. Large scale structure of solar activity, SPb, 165.
- Ikhsanov and Miletsky (2002) Ikhsanov R.N., Miletsky E.V.: 2002, Izvestiya GAO, 216, 543.
- Ikhsanov and Miletsky (2003) Ikhsanov R. N., Miletsky E. V.: 2003, astro-ph, 0312581.
- KamLAND collaboration (2004) KamLAND collaboration: 2004, hep-ex., 040621.
- Kirsten (1999) Kirsten T.A.: 1999, Reviews of Modern Physics, 71, 1213.
- Klapdor-Kleingrothaus and Zuber (2000) Klapdor-Kleingrothaus H.V., Zuber K.: 2000, Particle Astrophysics Institute of Physics Publishing, Bristol and Philadelphia.
- Lim and Marciano (1988) Lim C.S., Marciano W.J.: 1988, Phys. Rev. D, 37, 1368.
- Mikheev and Smirnov (1987) Mikheev S.P., Smirnov A.Y.: 1987, UFN, 153, 3.
- Milsztajn (2003) Milsztajn A.: 2003, hep-ph, 0301252.
- Pandola (2004) Pandola L.: 2004, hep-ph, 0406248.
- Scargle (1982) Scargle J.D.: 1982, Astrophys. J., 263, 835.
- Schechter and Valle (1981) Schechter J., Valle J.W.F.: 1981, Phys. Rev. D, 24, 1883.
- Sturrock et al. (1998) Sturrock P.A., Walther G., Wheatland M.S.: 1998, Astrophys. J., 491, 409.
- Vladimirsky and Brunce (2004) Vladimirsky B.M., Brunce A.V.: 2004, JETPh, 125, 717.
- Yoo et al. (2003) Yoo J. et al.: 2003, hep-ph, 0307070.