RECENT RESULTS FROM NA49
New results of the NA49 collaboration on strange particle production are presented. Rapidity and transverse mass spectra as well as total multiplicities are discussed. The study of their evolution from AGS over SPS to the highest RHIC energy reveals a couple of interesting features. These include a sudden change in the energy dependence of the -spectra and of the yields of strange hadrons around 30 GeV. Also, fluctuations of the ratio and the ratio, as well as the of in Pb+Pb collsions at 158 GeV are discussed.
1 Introduction
In the recent years the NA49 experiment has collected data on Pb+Pb collisions at beam energies between 20 to 158 GeV with the objective to cover the critical region of energy densities where the expected phase transition to a deconfined phase might occur in the early stage of the reactions. NA49 is a fixed target experiment at the CERN SPS. Details on the experimental setup can be found in .
2 Rapidity and transverse mass spectra
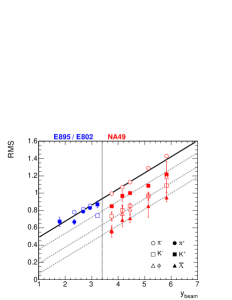
An increase of the RMS-widths of the rapidity spectra with beam energy can be observed which for the pions exhibits to a good approximation a linear dependence on the beam rapidity in the center-of-mass system over the whole energy range covered by the AGS and SPS (see Fig. 1). Between 20 GeV and 158 GeV this is also true for the other particle types having a Gaussian-like distribution, with a clear hierarchy in the widths: . However, this seems to break down at lower energies, where the widths of the kaons apparently approach the ones of the pions.
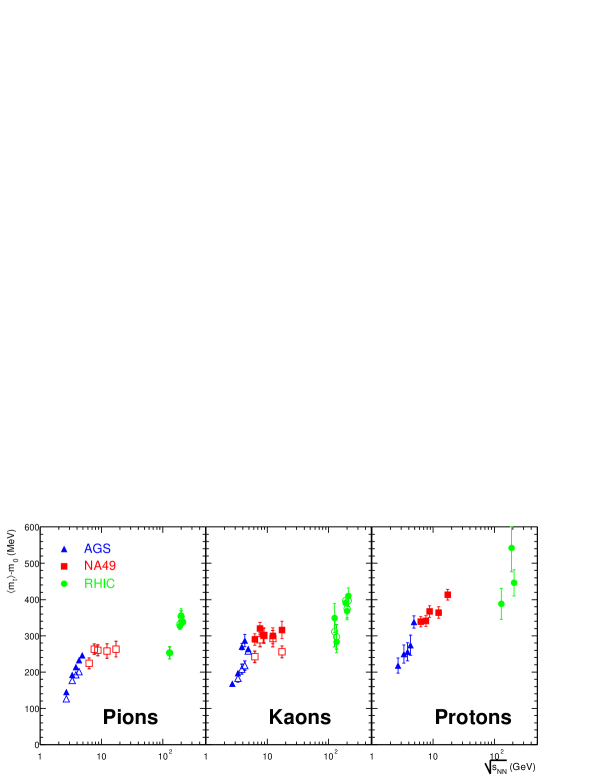
The increase with energy of the inverse slope parameter of the kaon -spectra, as derived from an exponential fit, exhibits a sharp change to a plateau around 30 GeV . Since the kaon -spectra – in contrast to the ones of the lighter pions or the heavier protons – have to a good approximation an exponential shape, the inverse slope parameter provides in this case a good characterization of the spectra. For other particle species, however, the local slope of the spectra depends on . Instead, the first moment of the -spectra can be used to study their energy dependence. The dependence of on the center of mass energy is summarized in Fig. 2. The change of the energy dependence around a beam energy of 20 – 30 GeV is clearly visible for pions and kaons. While rises steeply in the AGS energy range, the rise is much weaker from the low SPS energies on. To a lesser extent this change is also seen for protons.
3 Particle yields
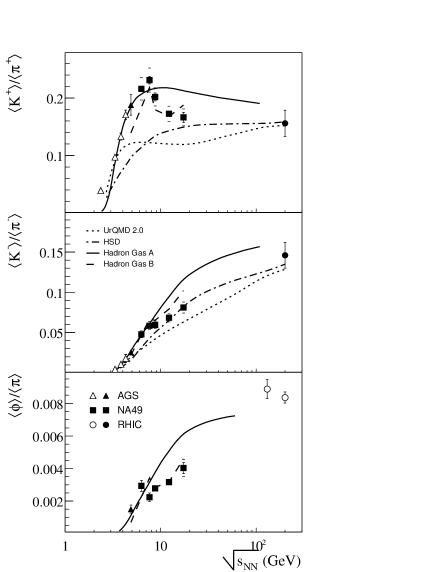
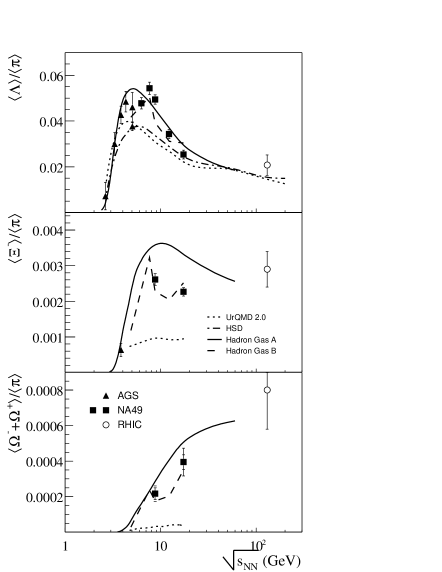
In Fig. 3 the energy dependence of the total multiplicities for a variety of strange hadrons, normalized to the pion yield, is summarized and compared to model predictions. Generally, it can be stated that the string hadronic models UrQMD and HSD do not provide a good description of the data points. Especially the and production is substantially underestimated and the maximum in the /ratio is not reproduced. The statistical hadron gas models , on the other hand, provide a better overall description of the measurements. However, the introduction of an energy dependent strangeness under-saturation factor is needed , in order to capture the structures in the energy dependence of most particle species (, , , ) The rapid changed of the hadron production properties observed at low SPS energies may be related to the onset of deconfinement .
4 Fluctuations
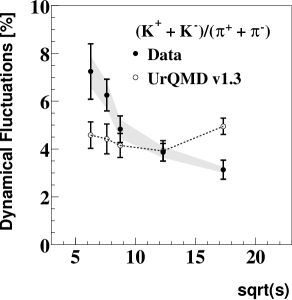
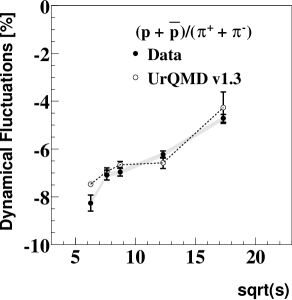
A study of the energy dependence of event-by-event fluctuations is given in Fig. 4. It shows the fluctuation signal of the ratio and the ratio. The dynamical fluctuations are derived as the difference to a mixed events reference sample (). As shown in the left panel of Fig. 4, the fluctuations are positive and decrease with beam energy. The fluctuations, on the other hand, are negative – indicating a correlation present in the real data – and increase with beam energies. While the trend of the fluctuations is not reproduced by UrQMD , it provides a good description of the energy dependence of the fluctuations. This might indicate that the negative value of the fluctuations in this ratio is due to resonance decays.
5 -Flow
References
References
- [1] S.V. Afanasiev et al. (NA49 collaboration), Nucl. Instrum. Meth. A 430 (1999), 210.
- [2] J.L. Klay et al. (E895 Collaboration), Phys. Rev. C 68 (2003), 054905.
- [3] L. Ahle et al. (E802 collaboration), Phys. Rev C 57 (1998), 466.
- [4] M. Gaździcki (for the NA49 collaboration), J. Phys. G 30 (2004), S701.
- [5] M. Bleicher et al., J. Phys. G 25 (1999), 1859.
- [6] E.L. Bratkovskaya et al., Phys. Rev. C 69 (2004), 054907.
- [7] P. Braun-Munziger, J. Cleymans, H. Oeschler, and K. Redlich, Nucl. Phys. A 697 (2002), 902.
- [8] F. Becattini, M. Gaździcki, A. Keränen, J. Manninen, and R. Stock, Phys. Rev. C 69 (2004), 024905.
- [9] C. Roland (for the NA49 collaboration), J. Phys. G 30 (2004), S1381.
- [10] J. Adams et al. (STAR collaboration), Phys. Rev. Lett. 92 (2004), 052302.