Scale dependence of heavy quark production in pp and p collisions - transverse momentum dependence.
Abstract:
The dependence of the differential cross section of inclusive heavy quark production in pp and p collisions on the renormalization and factorization scales is investigated. The implications of our results for experiments at TEVATRON and LHC are discussed. In particular, it is shown that the NLO QCD predictions for production at the LHC based on the Principle of Minimal Sensitivity are by % higher than the standard ones.
1 Introduction
Heavy quark production in hard collisions of hadrons, leptons and photons has been considered as a clean test of perturbative QCD. It has therefore come as a surprise that the first data on the production in p collisions at the TEVATRON p collisions at HERA and collisions at LEP2 have turned out to lie significantly and systematically above theoretical calculations. The disagreement between data and theory is particularly puzzling for the collisions of two quasireal photons at LEP2.
The NLO QCD calculations of heavy quark production in these collisions depend on a number of inputs: , parton distribution functions (PDF) of colliding hadrons or (resolved) photons, fragmentation functions, masses of heavy quarks, and last but not least the choice of renormalization (RS) and factorization (FS) scales and .
The discrepancy between the D0 [1] and CDF data [2] on production and theoretical calculations [3] has led to suggestions that it might represent the manifestation of effects of unintegrated gluon distribution function within the -factorization approach [4], or even a signal of supersymmetry [5]. In both cases the agreement between the TEVATRON data and the corresponding calculations [4, 5] is quite impressive. On the other hand, it has been argued in [6] that proper parameterization of the b-quark fragmentation functions also improves the agreement between CDF data and QCD calculations. There have furthermore been attempts to go beyond fixed order calculations by resumming the effects of large logs of the type [7], where denotes the center-of-mass energy squared, or [8], as well as the effects of soft gluon resummation important in the threshold region [9].
In [10] the sensitivity of NLO QCD calculations of the total cross section to the variation of the renormalization and factorization scales and was investigated in some detail. It was shown that in order to arrive at locally stable results these two scales must be kept independent. Moreover, it turned out that in the TEVATRON energy range the position of the saddle point of the cross section , considered as a function of and , lies far away from the diagonal . Using the NLO prediction at the saddle point instead of the conventional choice enhances the theoretical prediction in the TEVATRON energy range by a factor of about 2, which may help in explaining part of the excess of data over NLO QCD predictions.
In this paper the analysis of [10] is extended to the differential cross section of inclusive heavy quark production at the NLO. Bottom as well as top quark production will be considered in circumstances relevant for experiments at TEVATRON and LHC.
2 Basic facts and formulae
The basic quantity of perturbative QCD calculations, the renormalized color coupling , depends on the renormalization scale in a way governed by the equation
| (1) |
where for massless quarks and . The solutions of (1) depend beside also on the renormalization scheme (RS). At the NLO (i.e. taking into account first two terms in (1)) this RS can be specified, for instance, via the parameter , corresponding to the renormalization scale for which diverges. The coupling is then given as the solution of the equation
| (2) |
where . At the NLO the coupling is thus a function of the ratio and the variation of the RS for fixed scale is therefore equivalent to the variation of for fixed RS. To vary both the renormalization scale and scheme is legitimate, but redundant. Let us emphasize that the choice of the RS is as important as the choice of renormalization scale. As setting the renormalization scale equal to some “natural physical scale” gives different results in different RS, the existence of such a “natural scale” is actually of no help in arriving at unique result. If not stated otherwise, we shall work in the conventional RS and vary the renormalization scale only.
For hadrons the factorization scale dependence of PDF is determined by the system of evolution equations for quark singlet, nonsinglet and gluon distribution functions
| (3) | |||||
| (4) | |||||
| (5) |
where
| (6) | |||||
| (7) |
The splitting functions admit expansion in powers of
| (8) |
where are unique, whereas all higher order splitting functions depend on the choice of the factorization scheme (FS). The equations (3-5) can be recast into evolution equations for and . In all calculations presented below we took in the case of bottom quark and for top quark. The RG equation (2) was solved numerically in order to guarantee correct behaviour of its solution for small renormalization scales.
3 General form of the cross section
According to the factorization theorem, the differential cross section for inclusive production in hadronic collisions has the form (suppressing the specification of the dependence on and )
| (9) |
where and denote the rapidity and transverse momentum of a heavy quark , and stand for the beam particles and the partonic hard scattering cross sections admit expansions in powers of
| (10) |
Note that whereas the factorization scale scale appears as argument of both the PDF and parton level hard scattering cross sections , the renormalization scale enters only if we calculate the latter as perturbative expansion in powers of . Both the renormalization and factorization scales are auxiliary, unphysical quantities, on which observables like the cross section (9) cannot depend, provided both the expansions (10) and (8) are taken to all orders. In such a case any choice of gives the same result for (9). If, however, these expansions are considered to a finite order, as is in practice always the case, the expression on the right hand side of (9) develops nontrivial dependence on these two scales and their choice therefore matters. Moreover, as the renormalization scale reflects ambiguity in the treatment of short distances, whereas the factorization scale comes from similar ambiguity concerning large distances, these two scales should be kept as independent free parameters of any finite order perturbative approximations [11].
4 Choice of scales
For a given , the result of the evaluation of (9) to the NLO can be represented graphically in the form of two-dimensional surface over the plane . In this representation any of the points on such a surface corresponds to one, in principle equally legitimate, choice of these two scales. By constructing this surface we get quantitative idea of the stability of our calculations. Specifically we can look for the presence of saddle points, where the NLO results exhibit locally the independence of and , which is a necessary feature of all-order calculations globally. The choice of scales based on this criterion, called Principle of Minimal Sensitivity (PMS) [12], is one of the two general approaches to scale setting, the other being the Effective Charges method [13]. This latter approach selects those points for which the LO and NLO approximations of (9) coincide and the perturbative expansion thus has the “fastest apparent convergence”. Graphically this choice of scales is given by the intersection of LO and NLO surfaces representing the cross section . As shown in [10] for the total cross section the resulting points form a curve which passes very close to the saddle point, if such a point does exist. As will be shown below the same holds for differential cross section .
In this connection we want to recall the simple but often overlooked fact that the conventional procedure of setting and identifying it with some “natural physical scale” (in our case usually ) does not actually resolve the underlying ambiguity, because it implicitly assumes that we are working in the RS. There is, however, nothing “natural” on this (or any other) RS, as the is just one of the infinite number of equally legitimate choices of the RS. As emphasized in Section 2, working in a different RS of the couplant , the same choice of “natural” renormalization scale leads to a different result for the cross section (9). This fact also implies that it is meaningless to estimate the “theoretical uncertainty” related to freedom in the choice of the renormalization scale by varying it in some interval around the “natural” scale because the same procedure leads in different RS to different bands of theoretical predictions. The standard choice of RS is often justified by noting that it leads to small coefficients in perturbative expansions of physical cross sections. But if the apparent rate of convergence is the basic criterion for the “proper” choice of the scales than the points preferred by the EC approach, rather than those defining the RS should be selected.
On the other hand, although the positions of the saddle points do also depend on the chosen RS, the values of the cross section (9) at these saddle points do not! Contrary to the scale setting methods relying on the existence of “natural physical scale” the PMS approach therefore results in a unique prediction. For predictions based on the method of effective charges [13] the same uniqueness holds for any fixed factorization scale as well. In the case both and are treated as independent free parameter the EC approach does not yield a unique prediction but the whole continuum of values reflecting the fact that the intersection of LO and NLO surfaces defines a curve 111This statement should be taken with some reservation as there is in fact no guarantee that the saddle points and/or the mentioned intersection do, in a given kinematic region, exist..
However, independently of the strategy one prefers for choosing the renormalization and factorization scales, it is undoubtedly useful to have quantitative idea of the sensitivity of our calculations to the variation of these unphysical parameters.
5 Results
The cross section (9) was computed to the NLO using the code of the ref. [3] together with CTEQ6.1 set of PDF (with MeV). As no restrictions on the rapidity of the produced heavy quark was imposed in this study, the integration over the whole kinematically allowed region of was performed. To see how much our conclusions depend on the knowledge of PDF, some of the calculations were done also for the GRV94 set. The difference between the CTEQ6.1 and GRV94 results, should, however, not be taken as an estimate of their dependence of the chosen PDF. We have deliberately taken the now obsolete GRV94 set in order to illustrate the independence of the basic features of the renormalization and factorization scale dependence of on the selected PDF.
The numerical integration used in [3] employs standard Vegas method. For the evaluation of the LO contribution 4 iterations each with 4000 points were used, whereas for the NLO term these numbers were increased to 6 iterations each with 8000 points.
5.1 production
For inclusive production the differential cross section was computed for p collisions at and GeV and for pp collisions at TeV. For p collisions the first energy does not correspond to any real experiment, but we have included it to make contact with the earlier studies of this kind [14]. In all calculations we set GeV.
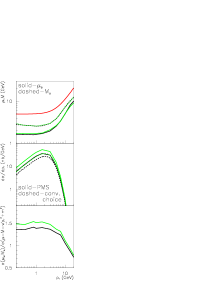
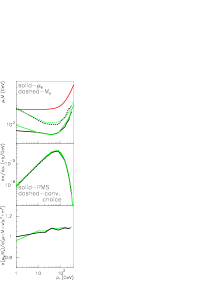
We start with p collisions at GeV. In Fig. 1 the quantity (9), integrated over the rapidity , is displayed as a function of and for several values of . On each surface the point corresponding to the standard choice is marked by a yellow triangle. Each of the surfaces in Fig. 1 exhibits a saddle point, marked by a yellow circle. The dependence of the coordinates of these saddle points, displayed in the upper left part of Fig. 1, shows the first indication of the disparity between the renormalization and factorization scales: saddle points occur at locations clearly away from the diagonal and always for . Moreover, for all values of these saddle points lie almost exactly on the intersection (not shown) between the LO and NLO surfaces, which defines the points preferred by the Effective Charge Approach. We shall plot the corresponding contour plot, illustrating this claim, for the phenomenologically most interesting case of production at LHC. In the middle left part of Fig. 1 the distribution computed for the standard choice is compared to that corresponding to the saddle points. To quantify their difference, we plot in the lower left part of Fig. 1 the ratio (setting )
| (11) |
The difference between the results obtained with CTEQ6.1 and GRV94 PDFs is negligible as far as the position of saddle points is concerned, but CTEQ6.1 gives, for both the PMS and the conventional choice of scales, slightly higher values of the cross section. In the region GeV saddle-based NLO results are by a factor of about higher than the conventional ones.

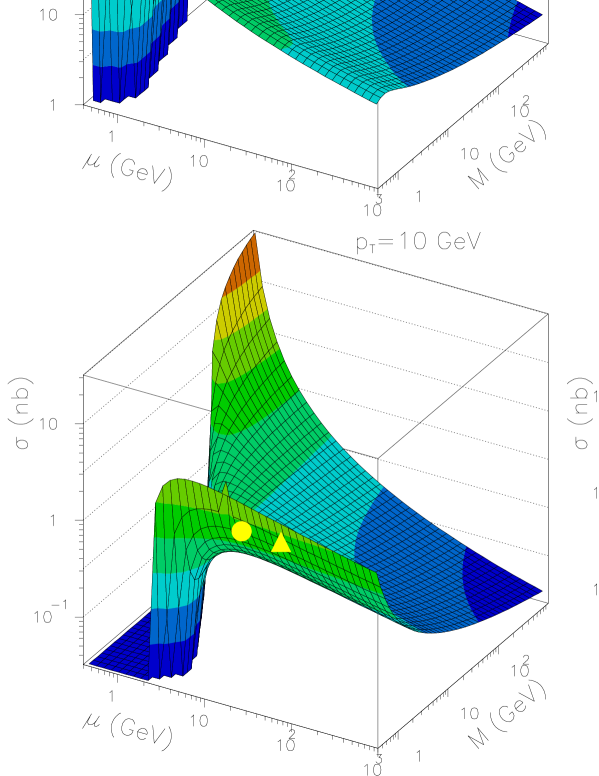
As we go to higher energies the relation between the conventional and saddle-based results changes. At GeV (see Fig. 2) we find that
-
•
In the interval GeV the saddle point lies far away from the diagonal .
-
•
For GeV the renormalization scale at the saddle point GeV, dipping to very small value around GeV for GeV, where the ratio (11) peaks at about 10.
-
•
Stability of the NLO predictions improves for GeV, where the saddle point moves closer to the conventional choice and the ratio (11) approaches unity.
-
•
The shapes of the conventional and saddle-based distributions differ substantially, particularly in the region GeV.
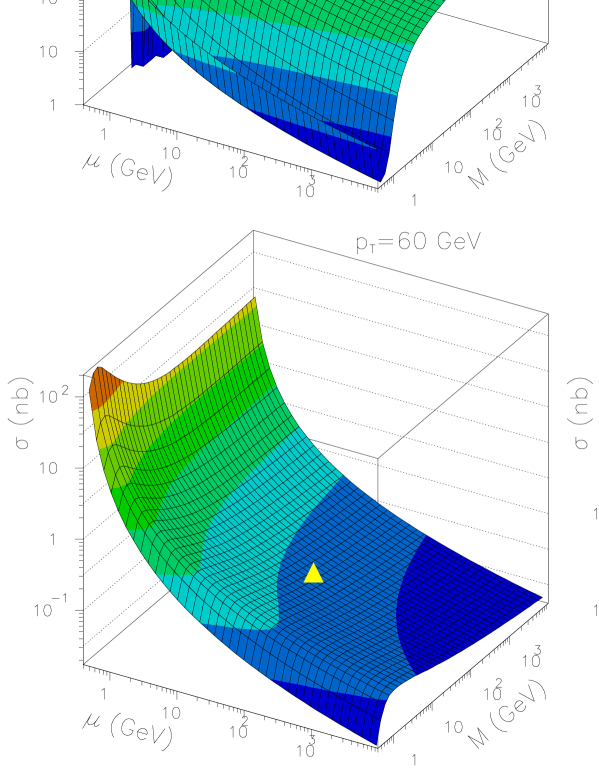
At this energy and in the experimentally accessible region GeV the typical parton fractions come from the region and thus neither the effects of low and/or large are likely to change the fixed order predictions significantly.
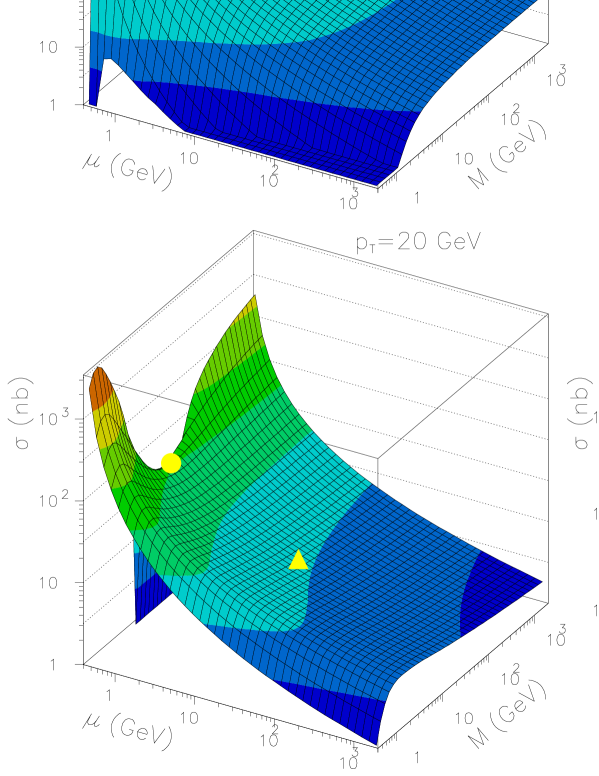
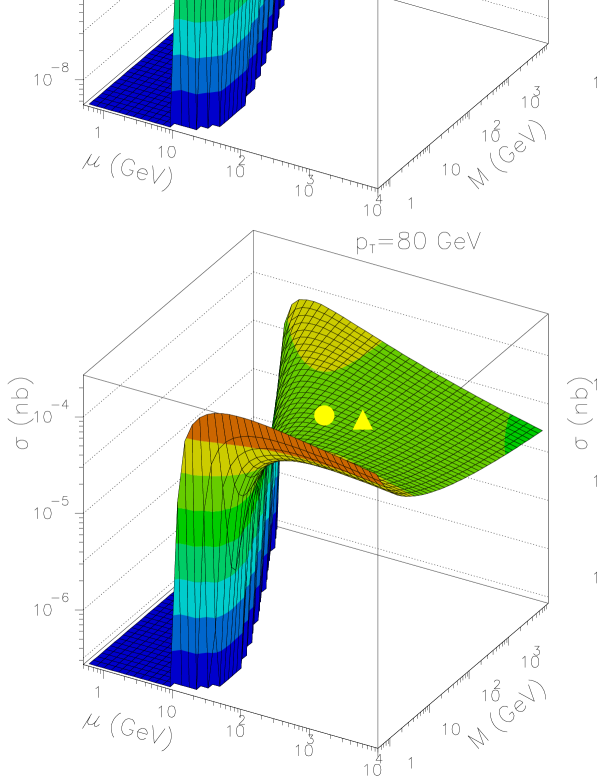
For p collisions at GeV (see Fig. 3) the saddle point disappears for GeV and reappears only for GeV. The value of the renormalization scale at the saddle point, , remains small, dropping below GeV as approaches GeV. The saddle point remains close to the intersection of the LO and NLO surfaces even as the saddle point approaches the unphysical region, though in this case the distance between the saddle point and the mentioned intersection increases. For GeV the ratio (11) stays constant at about 2, but then rapidly rises, diverging at GeV. Only for very large and experimentally inaccessible region GeV do the conventional results approach the saddle-based ones. At these large transverse momenta the resummation of the large logs of the type must certainly be performed to improve the NLO calculations. However, in most of the range accessible at the TEVATRON, i.e. , this effect is likely to be small. For moderate the NLO QCD predictions of inclusive bottom production are thus highly unstable. For very small , roughly GeV, one may argue that because the relevant parton fractions are typically , the approach [4] using the unintegrated PDF within the -factorization may be superior to the present fixed NLO results. It should, however, be kept in mind that the agreement with TEVATRON data relies on the use of a particular set of unintegrated PDF (which are still not well-constrained from data) and the appropriate choice of the factorization scale. In the case of -factorization there is, however, no mechanism for the cancelation of the factorization scale dependence between the unintegrated PDF (which depend on it) and the off-mass-shell hard scattering cross section as the latter is taken to the LO only and is thus independent of .
For the proton-proton collisions at the LHC the interval where the NLO QCD predictions exhibit no stability region and behave as a monotonously decreasing functions of the renormalization scale extends between GeV. In the lower part of this range the partons (mostly gluons) involved in hard collision have momentum fractions typically of the order of , for which the calculations [4] based on unintegrated PDF is likely to be more appropriate. On the other hand, for large transverse momenta the resummation of logs is definitely necessary to arrive at a reasonably stable result. Compared to these effects the threshold ones are likely to be negligible.
5.2 production
We have computed for p collisions at GeV and for pp collisions at TeV, setting in both cases GeV.
For the former case the results, presented in Fig. 4, exhibit saddle points for GeV. As these saddles are broad, the points corresponding to the standard choice are not far away and the saddle-based and standard results are close, typically to within less than %. Moreover, contrary to the case of production, the saddle points are located at large renormalization scale GeV.
At the TEVATRON about % of the cross section comes from light quark annihilation with the remaining roughly 15% from gluon-gluon fusion. The typical parton fractions come from the region where quark distribution functions are very well (with the precision better than about 3%) constrained by existing data, but the gluon distribution function suffers from much larger uncertainties. Recent error analysis by both CTEQ and MRST groups 222The numbers quoted below concerning the accuracy of PDF were obtained with the help of Durham HEPDATA PDF interactive facility [17] using CTEQ6 and MRST E-sets. show that just above this uncertainty starts to increase quite rapidly, reaching % above for CTEQ or for MRST, respectively. Despite the fact that gluon-gluon channel contributes just a small part of the cross section, the overall uncertainty may thus be comparable to or even larger than that resulting from the scale ambiguity. This fact was noted in [15] 333Where the theoretical uncertainty was defined in a standard manner by changing the common scale by a factor of 2 around . which contains detailed investigation of the dependence of NLO QCD predictions, including the soft gluon resummation, on the variation of the scales as well as on choice of parton distribution functions. The soft gluon resummation reflects the fact that at TEVATRON the production threshold is not far below . Unfortunately, as the calculations of [9], used in [15], are available for the total cross section only, we cannot investigate their implications for the transverse momentum distributions considered in the present paper. Taking as an estimate of their importance the number given in [9] for the total cross section , i.e. the enhancement of the standard NLO results with by about %, we expect them to be comparable to the difference between the standard and saddle-based NLO results. However, as the scale dependence (assuming ) of the resummed results for is reduced substantially with respect to standard NLO calculations [9], it would be quite interesting to see the effects of the soft gluon resummation on the surfaces in Fig. 4.

Though non-negligible, all the uncertainties of higher order QCD corrections discussed above are nevertheless substantially smaller than the current experimental errors even for the total cross section. It is difficult to quote just one number as the results from various channels and from D0 and CDF experiments differ sizably (see Figs. 5 and 7 of a recent review [16]), but a conservative estimate of the experimental uncertainty for the total cross section is %, depending on the way one adds statistical and systematical errors (the number in [16] reads ). The only conclusion one can thus draw from the analysis of the TEVATRON data on is that they are consistent with QCD calculations, with or without the soft gluon resummation.
At the LHC and even in the initial low luminosity period, pairs will be produced abundantly, with millions of such pairs produced per year by each of the two main experiments. The gluon-gluon channel contributes most of the cross section, except for very large GeV, there the light quark-gluon channel becomes of comparable importance. The channel contributes less than % throughout the experimentally accessible regions. The precision of the measurements of production will thus be limited primarily by the uncertainty of the luminosity, which is expected to be in the range % [18].
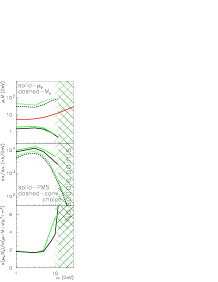
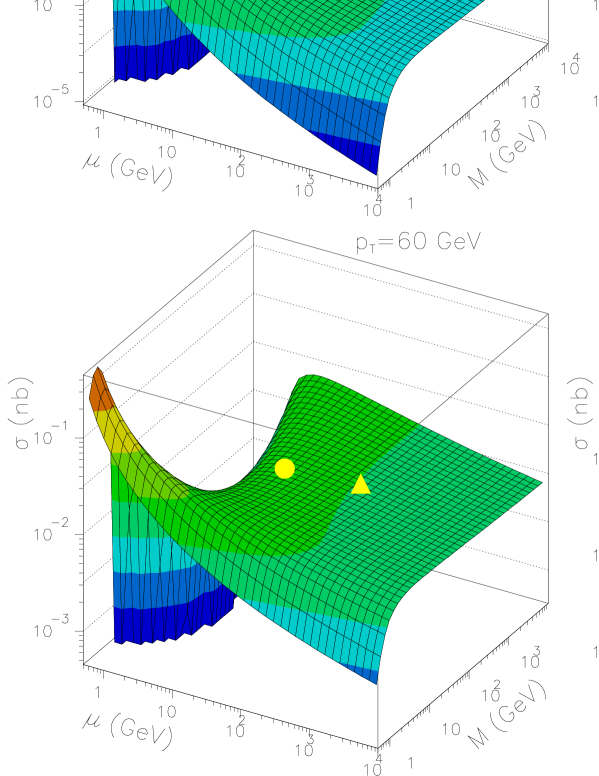
As shown in Fig. 5, for production at the LHC the saddle points exist for all accessible values of , but they are located further away from the points corresponding to the standard choice, primarily due to the fact that the renormalization scale at the saddle points, , remains below GeV. This by itself is not so important, what matters is the fact that the difference between the saddle-based results and the conventional is quite sizable. For GeV and the CTEQ6.1 set of PDF the former are higher by a factor of . This is by about a factor of two more than the upper limit of the theoretical band based on the standard way of estimating the “theoretical uncertainty” of NLO calculations, shown by the lower (black) solid curve in the left part of Fig. 6.
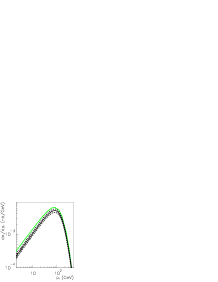

This enhancement is phenomenologically relevant since at LHC the typical parton fractions will be by a factor of seven smaller than at the TEVATRON and thus in the region where both light quark and gluon distributions functions are known with accuracy better than about 3% [17]. The sensitivity of NLO QCD predictions to the choice of PDF is thus expected to be substantially smaller than the difference between the standard and saddle-based NLO calculations, with or without the soft gluon resummation. The effects of the resummation of large logs coming from the region of small and/or large are also unlikely to be important in the experimentally accessible region.
As demonstrated by the four contour plots in Fig. 6 the saddle points are located close to the curves representing the intersections of the LO and NLO predictions, the feature mentioned already in the case of production at GeV. Note moreover, that for all these intersections follow closely the ridge on both sides of the saddles implying that out of all the points preferred by the Effective Charges Approach [13] the one closest to the saddle gives the lowest value of the cross section.
6 Summary and conclusions
We have investigated the renormalization and factorization scale dependence of inclusive and production in pp and p collisions as a function of . For bottom quark at 64 GeV and top quark at TEVATRON and LHC energies, the cross sections were found to exhibit regions of local stability around the saddle points for all experimentally relevant values of . In all these cases the standard choice of scales yields results which are lower than those at the saddle points. The difference is smallest for production at TEVATRON energie, where it amounts to about %. For pp collisions at the LHC the enhancement of the saddle-based predictions over the standard one increases to to , depending on . As at LHC top quark production cross sections will be measured with a precision of about %, and hopefully even better, theoretical predictions should be of comparable accuracy. In view of this fact the latter enhancement is phenomenologically relevant. This is our most important conclusion.
For smaller ratio , characteristic for the bottom production at TEVATRON and LHC, the saddle points are located far away from the diagonal and the corresponding saddle-based results are substantially higher that the standard ones. For some regions of there is no region of local stability at all. For small values of the process is dominated by very small partonic fractions and thus the use of unintegrated PDF may be more appropriate. For large GeV, on the other hand, the resummation of the large logs of the type should certainly precede any scale analysis.
References
- [1] B. Abbott et al. (D0 Collab.): Phys. Rev. Lett. 85 (2000), 5068
- [2] D. Acosta et al. (CDF Collab.): Phys. Rev. D65 (2002), 052005
- [3] S. Frixione and M. Mangano: Nucl. Phys. B483 (1997), 321
- [4] H. Jung: Phys. Rev. D65 (2002), 034015
- [5] E. Berger et al: Phys. Rev. Lett. 86 (2001), 4231
- [6] M. Cacciari and P. Nason: Phys. Rev. Lett. 89 (2002), 122003-1
- [7] S. Catani, M. Ciafaloni and F. Hautman: Nucl. Phys. B366 (1991), 135
- [8] M. Cacciari, M. Greco and P. Nason: JHEP 05 (1998), 007
- [9] R. Bonciani, S. Catani, M. Mangano, P. Nason: Nucl. Phys. B529 (1998), 424
- [10] J. Chýla, JHEP03 (2003) 042
- [11] H. D. Politzer, Nucl. Phys. B192 (1984), 493
- [12] P. M. Stevenson, Phys. Rev. D21 (1981), 2916
- [13] G. Grunberg, Phys. Rev. D29 (1984), 2315
- [14] G. Altarelli, M. Diemoz, G. Martinelli and P. Nason: Nucl. Phys. B308 (1988), 724
- [15] M. Cacciari, S. Frixione, G. Ridolfi, M. Mangano, P. Nason: JHEP04(2004)068
- [16] A.P. Hainson: in New Views in Particle Phyics, Rencontres du Vietnam, Hanoi, August 2004, hep-ex/0502023
- [17] http://durpdg.dur.ac.uk/hepdata/pdf.html
- [18] ATLAS Technical Design Report, CERN/LHC 99-15, p. 639