Universidade de Santiago de Compostela, 15782 Santiago de Compostela, Spain
STRING and PARTON PERCOLATION
Abstract
A brief review to string and parton percolation is presented. After a short introduction, the main consequences of percolation of color sources on the following observables in A-A collisions: suppression, saturation of the multiplicity, dependence on the centrality of the transverse momentum fluctuations, Cronin effect and transverse momentum distributions, strength of the two and three body Bose-Einstein correlations and forward-backward multiplicity correlations, are presented. The behaviour of all of them can be naturally explained by the clustering of color sources and the dependence of the fluctuations of the number of these clusters on the density.
pacs:
25.75.-q, 12.38.Mh, 24.85.+p1 Introduction
What conditions are necessary in the pre-equilibrium stage to achieve deconfinement and perhaps subsequent quark-gluon plasma formation? This question on the occurence of color deconfinement in nuclear collisions without assuming prior equilibration has been addressed on the basic of two closely related concepts, string or parton percolation Ref1 -Ref2 and parton saturation Ref3 -Ref4 -Ref5 .In this paper we will study the first subject.
Consider a flat two dimensional surface S (the transverse nuclear area), on which small disc of radius (the transverse partonic or string size) are randomly distributed, allowing overlapping. With increasing density (we take here , clusters of increasing size appear. The crucial feature is that this cluster formation shows critical behaviour: in the limit and with finite, the cluster size diverges at a certain critical density. The percolation threshold is given by
| (1) |
and its value 1.13 is determined by numerical studies. For finite and , percolation sets in when the largest cluster spans the entire surface from the center to the edge. Because of overlap, a considerable fraction of the surface is still empty at the percolation point in fact, at the threshold, only of the surface is covered by discs.
In high energy nuclear collision, the strings or partons are originated from the nucleons within the colliding nuclei, therefore their distribution on the transverse area of the collision is highly non uniform with more nucleons and hence more strings or partons in the center than in the edge. In this case the value of becomes higher Ref6 .
2 Local parton percolation and suppression
Hard probes, such as quarkonia, probe the medium locally, and thus test only if it has reached the percolation point and the resulting geometric deconfinement at their location. It is thus necessary to define a more local percolation criterium Ref7 .
As we mentioned before, at the percolating critical density, 1/3 of the surface remains empty. Hence disc density in the percolating cluster must be greater than . In fact numerical studies show that percolation sets in when the density of partons in the largest cluster reaches the critical value , slightly larger than . This result provides the required local test: if the parton density at a certain point in the transverse nuclear collision plane has reached this level, the medium there belongs to a percolating cluster and hence to a deconfined parton condensate. In Fig. 1 the percolation probability and its derivative as a function of are shown.

Let us apply the above idea to suppression in A-A collision Ref8 . We denote by the density of nucleons in the transverse plane and by the parton distribution functions. (At central rapidity , we have , where denotes the transverse momentum of the partons and thus ). The local parton percolation condition is
| (2) |
For a given A-A collision at a fixed centrality and energy, the relation (2) determines .
For collision at , . The scales of the charmonium states and , as determined by the inverse of their radii calculated in potential theory, are around 0.6 GeV and 0.5 GeV respectively, therefore the parton condensate can thus resolve these states and all and states formed inside the percolating cluster disappear. The location is determined by the collision density. The first onset of suppression in collision at SPS should occur at , where the due to feed-down from and states in the percolating cluster are eliminated. Directly produced survive because of their smaller radii (leading to a scales of 0.9–1.0 GeV) and its dissociation requires more central collisions, which lead to a better resolution, i.e. to an increase of . For we need . The resolution scale of the direct cannot be reached in S-U collisions, therefore only one stop pattern suppression is obtained for this case.
For Au-Au collision at RHIC, the increase parton density shift the onset of percolation to a higher resolution scale, so that from the threshold on, all charmonium states including are supressed, starting at , i.e. a single step suppression pattern occurs.
For the case In-In collisions at SPS energies, the threshold for directly produced is not reached even for the most central collisions, and again a single step suppression patterm is expected.
3 String percolation
Multiparticle production is currently described in terms of color strings stretched between partons of the projectile and target, which decay into new strings through production and subsequently hadronize to produce observed hadrons. Color strings may be viewed as small discs in the transverse space, , , filled with the color field created by the colliding partons. Particles are produced by the Schwinger mechanisms Ref10 emitting pairs in this field. With growing energy and/or atomic number of colliding particles, the number of strings grows and they start to overlap, forming clusters. At a critical density a macroscopic cluster appears that marks the percolation phase transition.
The percolation theory governs the geometrical pattern of the string clustering. Its observable implications, however, require introduction of some dynamics to describe string interaction, i.e, the behaviour of a cluster formed by several overlapping strings.
It is assumed that a cluster behaves as a single string with a higher color field corresponding to the vectorial sum of the color charge of each individual string. The resulting color field covers the area of the cluster. As , and the individual string colors may be oriented in an arbitrary manner respective to one another, the average is zero, and .
Knowing the charge color , one can compute the particle spectra produced by a single cluster of such color charge and area using the Schwinger formula. For the multiplicity and average of particles, , produced by a cluster of strings one finds Ref11 -Ref12
| (3) |
where and are the mean multiplicity and mean of particles produced by a single string with a transverse area . For strings just touching each other and hence as expected (simple fragmentation of independent strings). In the opposite case of maximum overlapping, and therefore ,, so that the multiplicity results maximally supressed. Notice that a certain conservation rule holds
| (4) |
and also the scaling low
| (5) |
In the limit of high density
| (6) |
Thus
| (7) |
The universal scaling law (5) is valid for all projectiles and targets, different energies and centralities, being in reasonable agreement with experimental data Ref13 . A similar scaling is found in the color glass condensate approach Ref14 .
Notice that at central rapidity (at the fragmentation region ). As .
Therefore, the multiplicity per participant does not depend on the number of participants, there is saturation. Numerical studies show a good agreement with SPS and RHIC data [12]. The prediction for central collisions () at LHC is and the total charged multiplicity per unit rapidity (at central rapidity) is 1800. This numbers are very similar to the ones obtained from Hera data, assuming scaling, using PQCD and the BK equation Ref16 -Ref17 .
4 Transverse momentum fluctuations
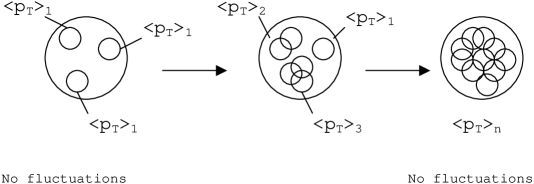
The behaviour of the transverse momentum fluctuations can be understood as follows: At low densities most of the particles are produced by individual strings with the same , so the fluctuations must be small. Similarly, at large density, above the percolation critical point, there is essentially one cluster formed by almost all the strings created in the collision and therefore fluctuations are not expected either. Indeed, the fluctuations are expected to be maximal when the number of different clusters becomes larger, just below the percolation critical density (see Fig. 2). In this case in addition to the normal fluctuations around the mean transverse momentum of a single string, there are more fluctuations due to the different average transverse momentum of each cluster.
Experimentally, it has been measured the quantity
| (8) |
where denotes the corresponding normalized fluctuations in the case of statistically independent particle emission.
In Fig. 3 our result Ref18 compared with the experimental data is shown. A reasonable agreement is obtained. There is an alternative explanation based on the occurrence at RHIC of minijets which will enhance the fluctuations. At high centrality, it is well established, the suppression of high particles at RHIC what can explain the suppression of fluctuations seen at lower centralities. According to this picture, at SPS where the production of minijets is negligible, this behaviour is not expected, contrary to the expectations of percolation of strings.

Instead of fluctuations, the NA49 Collaboration Ref19 has measured at SPS for Pb-Pb collisions, as a function of the centrality of the collision, showing a maximum at low centrality and being 1 at high centrality. This behaviour has nothing to do with minijets. On the contrary, it is explained naturally in our approach Ref20 .
5 Universal transverse momentum distributions
In order to know the transverse momentum distributions one needs the fragmentation function for each cluster, and the mean squared transverse momentum distribution of the clusters, W(x), which is related to the cluster size distribution through Eq. (3). For we assume the Schwinger formula, , used also for the fragmentation of a Lund string Ref21 , at first approximation is related to the string tension or equivalently to the inverse of the mean transverse momentum squared. For the weight function W(x) we choose the gamma distribution
| (9) |
The reason of this choice is the following: In peripheral heavy ion collisions there is almost not overlapping between the formed strings and therefore the cluster size distribution is peaked around low values. Most of the clusters are made of one single string. As the centrality increases the number of strings grows, so there are more and more overlapping among the strings and the cluster size distribution is strongly modified, according to Fig. 4 where three cluster distributions corresponding to three different centralities of the collision are shown. Each curve in Fig. 4 can be reproduced by gamma distributions with different values.

Moreover, the increase of centrality can be seen as a transformation of the cluster size distribution of the type
| (10) |
This kind of transformation were studied long time ago by Jona-Lasinio in connection to the renormalization group in probabilistic theory Ref22 . Actually an increase of the centralities is equivalent to a transformation which changes cells (single strings) by blocks (clusters) and the corresponding variables and of the cells by and . These transformations of the type of the chain (10) have been used also to study the probability associated to events which satisfy some requirements Ref23 .
The and parameters of the gamma distribution are related to the mean and dispersion of the distribution through
| (11) |
We use Eq (7) to take into account the effect of overlapping of strings, and hence . Therefore we obtain
| (12) |
and the normalized distribution is
| (13) |
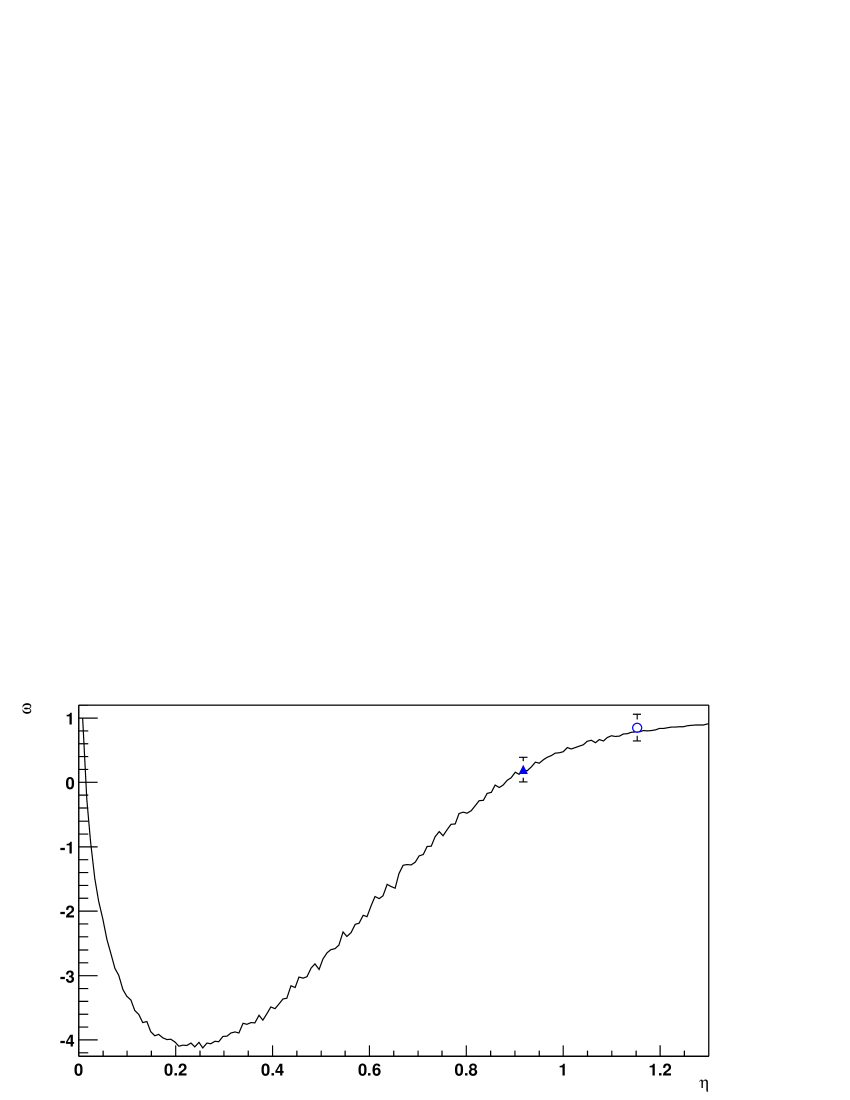
The equation (5) can be seen as a superposition of chaotic color sources (clusters) where fixes the transverse momentum fluctuations. At small density , the strings are isolated and there are not fluctuations, . When the density increases, there will be some overlapping of strings forming clusters, the fluctuations increase and decreases. The minimum of will be reached when the fluctuations in the number of strings per cluster reach its maximum. Above this point, increasing , these fluctuations decrease and increases. In the limit, when only one cluster of all strings is formed, there are not fluctuations and again .
The obtained power-like behaviour , with an exponent related to some intrinsic fluctuations, is common to many apparently different systems, as sociological, biological or informatic ones. Distributions like the citations of scientific works, or other complex networks Ref25 Ref26 where the probability of having a given node with links is described by the free scale power law with related to the fluctuations in the number of links obey the same behaviour. Also, it has been shown Ref27 -Ref28 that maximization of the non extensive information Tsallis entropy leads to the same distribution (12).
The universal behaviour indicates the importance of the common features present in those phenomena, namely, the cluster structure and the fluctuations in the number of objets per cluster.
¿From (13) one can calculate
| (14) |
where “i” refers to the different particle especies.
As this reduces to .
This behaviour has been confirmed by the PHOBOS Collaboration. As the absolute value is larger for pions than for kaons and than for protons.
Now, let us discuss the interplay between low and high . One defines the ration between central and peripheral collisions as
| (15) |
where the distribution in the numerator corresponds to higher densities . In the limit, taking into account that and that , we obtain
| (16) |
approximately independent of and . As increases, the ratio decreases, in agreement with experimental data.
As increases we have
| (17) |
and increases with (again, )
At large ,
| (18) |
which means that if we are in the low density regime and , and we reproduce the Cronin effect. As we increase the energy, the density increases and on reaches the high density regime where and suppression of occurs. The Cronin effect disappears at high energies and/or densities. The critical density at which the Cronin effect disappears is the same at which the transverse momentum fluctuations presents a maximum.
for two different particles, for instance and , becomes, at intermediate ,
| (19) |
As , in the high density limit (Au-Au collisions ) we expect a ratio larger than 1, as the experimental data show.
As far as we approach the low density limit, the ratio decreases, becoming closer to 1 or even lower.
A more detailed comparison with experimental data on Au-Au, d-Au collisions discussion of the forward rapidity region can be found in reference Ref24 . An overall reasonable agreement is obtained. It is very remarkable that such agreement is based on the universal behaviour of the distribution given by Equation (13).
6 Bose-Einstein Correlations
Most of the studies of two body Bose-Einstein (B.E) correlations have paid attention to the parameters , , and not to the strength of the correlation, defined by the chaoticity parameter
| (20) |
Experimentally, due to Coulomb interference and to the necessary extrapolations there are many uncertainties in its evaluation, however, some trend of the dependence of on the multiplicity can be established. First, SPS minimum bias data for O-C, O-Cu, O-Ag and O-Au collision show that decreases as the size of the target increases, from up to . However for S-Pb and Pb-Pb central collisions, where the values of are larger is also larger, .
This behaviour can easily explained in the percolation framework Ref29 . Each cluster can be considered as a chaotic source , and the production of particles from several clusters can be seen as the superposition of chaotic sources. In this schemce, , being the number of pairs produced in the same cluster and the total number of pairs. In this way, is proportional to the inverse of the number of independent sources (clusters), therefore it decreases with the density up to the critical percolation value. ¿From this critical value, it increases with density. This behaviour is shown in Fig. 5.
Similar considerations can be done concerning the strength of the three body B-E correlations, . NA44 Collaboration has obtained for S-Pb collisions, and for central Pb-Pb collisions . STAR collaboration obtains for central Au-Au collisions values of close to 1. This sharp variation from to in a small range of is easily explained in the framework of percolation of strings. Now becomes proportional to the inverse of the squared of the number of independent sources (clusters) what can acomodate stronger variation compared to the case of two body. In Fig. 6 our result is shown Ref30 .

7 Forward-Backward Correlations
An useful observable to check the percolation approach is the forward-backward correlation measured by the quantity
| (21) |
where denotes the multiplicity in a forward (backward) rapidity interval. In order to eliminate the short range correlations, the forward and backward o intervals should be separated by at least one unit of rapidity. On general grounds, one can see that is proportional to the fluctuations on the number of independent sources, (or clusters in our case)Ref31 -Ref32 . At very low density, should be very small, increasing with the density up to a maximum related to the largest number of clusters. At very high density, there is essentially only are cluster and hence becomes small again.
There are some experimental data measuring the parameter b, through
| (22) |
where . The data on and show on increase of with energy and density. Our prediction for high density is that will decrease. Measurements of or as function of centrality would be welcome.
8 Conclusion
The percolation of partons and strings can describe rightly several observables, namely suppression, multiplicities, transverse momentum fluctuations, transverse momentum distributions and B-E correlations. The behaviour of all of them has a common physical basis: the clustering of color sources and the dependence of the number of cluster on the density. In this way, the threshold of suppression, the maximum of transverse momentum fluctuations, the suppression of the Cronin effect and the turnover of the dependence of the strength of two and three body correlation with the energy are related to each other and all of them point out a percolation phase transition. Another test of this transition is the measurements of forward-backward correlations and also the multiplicity distributions not discussed here Ref33 .
Many of the results obtained in the framework of percolation of strings are very similar to the one obtained in the color glass condensate (CGC). In particular, very similar scaling lows are obtained for the product and the ratio of the multiplicities and transverse momentum. For this reason, it is very tempting to identify the momentum which established the scale in CGC with the corresponding are in percolation of string. In this way
| (23) |
The consequences of Eq. (23) are under study.
Acknowledgements. I thank the organizers for such a nice meeting and E.G. Ferreiro for a critical reading of the manuscript. This work has been done under contracts FPA2002-01161 of CICyT of Spain, and PGIDIT03PXIC-20612PN from Galicia.
References
- (1) N. Armesto, M.A. Braun, E.G. Ferreiro and C. Pajares, Phys. Rev. Lett. 77, (1996)3736.
- (2) M. Nardi and H. Satz, Phys. Lett. B 442, (1998) 14.
- (3) L.V. Gribov, E.M. Levin and M.G. Ryskin, Phys. Rep. 100 (1983) 1; J.P. Blaizot and A.H. Mueller, Nucl. Phys. B 289 (1987) 847.
- (4) L.D. McLerran and R. Venugopalan, Phys. Rev. D 49, (1994) 2233; D 49, (1994) 3352; D50, (1994) 2225.
- (5) E. Iancu, A. Leonidov and L.D. McLerran, Nucl. Phys. A 692, (2001) 583; E.G. Ferreiro, E. Iancu, A. Leonidov and L.D. McLerran, Nucl. Phys. A 710, (2002) 5414.
- (6) A. Rodrigues, R. Ugoccioni and J. Dias de Deus, Phys. Lett. B 458, (1999) 402.
- (7) S. Digal, S. Fortunato and H. Satz, Eur. Phys. J. C 32, (2004) 547; S. Digal, S. Fortunato, P. Petrezky and H. Satz, Phys. Lett. B 549, (2004) 547.
- (8) S. Digal, P. Petreczky and H. Satz, Phys. Rev. D 64, (2001) 094015; T. Matsui and H. Satz, Phys. Lett. B 178, (1986) 416.
- (9) M. Nardi, This volume.
- (10) J. Schwinger, Phys. Rev. D 82, (1951) 664, T.S. Biro, H.B. Nielsen and J. Knoll, Nucl. Phys. B 245, (1984) 449.
- (11) M.A. Braun and C. Pajares, Eur. Phys. J. C 16, (2000) 349.
- (12) M.A. Braun, F. del Moral and C. Pajares, Phys. Rev. C 65, (2002) 024907.
- (13) J. Dias de Deus, E.G. Ferreiro, C. Pajares and R. Ugoccioni, Phys. Lett. B 581 (2004) 156.
- (14) L.D. McLerran and J. Schaffner-Bielich, Phys. Lett. B 514, (2001) 29, J. Schaffer-Bielich, D. Kharzeev, L.D. McLerran and R. Venugopalan, Nucl. Phys. A 705, (2002) 494.
- (15) J. Dias de Deus, R. Ugoccioni and A. Rodrigues, Eur. Phys. J. C 16, (2000) 537; J. Dias de Deus, R. Ugoccioni, Phys. Lett. B 494, (2000) 53; 491, (2000) 253.
- (16) N. Armesto, C.A. Salgado and U.A. Wiedemann, hep-ph/0407018.
- (17) D. Kharzeev and M. Nardi, Phys. Lett. B 507, (2001) 121; D. Kharzeev, E. Levin and M. Nardi, hep-pha/0408050.
- (18) E.G. Ferreiro, F. del Moral and C. Pajares, Phys. Rev. C 69, (2004) 034901; J. Dias de Deus and A. Rodrigues, hep-ph/030811.
- (19) NA49 Collaboration, M. Rybczynski et al., nucl-ex/0409009.
- (20) J. Dias de Deus this volume.
- (21) B. Andersson, The Lund Model, Cambridge Univ. Press. (1998)
- (22) G. Jona-Lasinio, Nuovo Cimento B 26, (1975) 99.
- (23) J. Dias de Deus, C. Pajares and C.A. Salgado, Phys. Lett. B 408, (1997) 417; Phys. Lett. B 407, (1997) 335; Phys. Lett. B 409, (1997) 474; J. Dias de Deus and C. Pajares, Phys. Lett. B 442, (1998) 395.
- (24) J. Dias de Deus, E.G. Ferreiro, C. Pajares and R. Ugoccioni, hep-ph/030400, Submitted to Eur. Phys. J. C.
- (25) G. Koh and G. Laurent, Science 284, (1999) 96.
- (26) R. Albert and A.L. Barabasi, Rev. Modern Phys. 74, (2002) 47.
- (27) G. Wilk and Z. Wlodarczyk, Acta Phys. Pol. B35, (2004) 2141; Phys. Rev. Lett. 84, (2000) 2770.
- (28) C. Tsallis, J. Statist Phys. 52, (1988) 479.
- (29) M.A. Braun, F. del Moral and C. Pajares, Eur. Phys. J. C 21, (2001) 557.
- (30) M.A. Braun, F. del Moral and C. Pajares, Phys. Lett. B 551, (2003) 291.
- (31) N.S. Amelin, N. Armesto, M.A. Braun, E.G. Ferreiro and C. Pajares, Phys. Rev. Lett. 73, (1994) 2813.
- (32) M.A. Braun and C. Pajares, Phys. Rev. Lett. 85, (2000) 4864; M.A. Braun, R.S. Kolevatov, C. Pajares and V.V. Vechernin, Eur. Phys. J. C 32, (2004) 535.
- (33) J. Dias de Deus, E.G. Ferreiro, C. Pajares and R. Ugoccioni, Phys. Lett. B 601, (2004) 125.
- (34) M.A. Braun and C. Pajares, Phys. Lett. B 603, (2004) 21; C. Pajares, Acta. Phys. Pol. B 35, (2004) 153.