Strong phase shifts and color-suppressed tree amplitudes
in and , decays
C. S. Kim1,2111cskim@yonsei.ac.kr,
Sechul Oh2,3222scoh@phya.yonsei.ac.kr,
and
Chaehyun Yu1333chyu@cskim.yonsei.ac.kr1Department of Physics and IPAP, Yonsei University,
Seoul 120-479, Korea
2Physics Division, National Center for Theoretical Sciences,
Hsinchu 300, Taiwan
3Natural Science Research Institute, Yonsei University,
Seoul 120-479, Korea
Abstract
We analyze the decay processes , , , and
in a model-independent way.
Using the quark diagram approach, we determine the magnitudes
of the relevant amplitudes and the relative strong phase shifts.
In order to find the most likely values of the magnitudes and the relative
strong phases of the amplitudes in a statistically reliable way, we use
the minimization technique.
We find that the strong phase difference between the color-allowed and the
color-suppressed tree amplitude can be large and is non-zero at 1
level with the present data.
The color-suppressed tree contributions are found to be sizably enhanced.
We also examine the validity of factorization and estimate the breaking
effects of flavor SU(3) symmetry in , and in ,
.
I Introduction
A tremendous amount of experimental data on meson decays are being
collected from factory experiments, such as Belle and BaBar.
Experimentally plenty of two-body hadronic decays have been observed
and a lot of theoretical works on these decay processes have been done.
In particular, the first observation of the color-suppressed decay processes
and by the Belle
Collaboration Krokovny:2002ua has drawn special attentions, since it allows one
to do a complete isospin analysis of the modes together
with the previously observed charged modes of the type.
Two-body hadronic meson decays to and final states
have been of great interest. In these decay modes, there is no contribution
from penguin diagrams so that theoretical uncertainties involved in the
relevant QCD dynamics become much less.
Thus, these modes serve as a good testing ground for various theoretical
issues in hadronic decays, such as factorization hypothesis and final-state
interactions. These processes are also expected to be useful for a
determination of the CP violating phases, e.g.,
Atwood:1996ci ; Gronau:1998un ; Jang:1998iz ; Kim:2000ev .
It has been expected that in a heavy quark limit, certain two-body
charmed decays, such as [referred
to as the class-1 (color-allowed) topology], can be explained well
with the factorization hypothesis implying small final-state
interactions. It has been confirmed in the QCD factorization
approach Beneke:2000ry . However, in a recent work based on
the perturbative QCD (PQCD) approach Keum:2003js , it was pointed out that
in order to explain [referred to as the
class-2 (color-suppressed) topology] as well as [referred to as the class-3 (involving both color-allowed
and color-suppressed) topology], there must exist a sizable
relative strong phase between the class-1 and the
class-2 amplitudes: e.g., . This relative
strong phase arises from QCD dynamics through short-distance
strong interactions and differs from the final-state strong phases
through long-distance rescattering interactions.
Motivated by experimental measurements of the branching ratios (BRs) for
and decays, some phenomenological studies have been
performed to determine the possible final-state rescattering strong phases
in these processes Xing:2001nj ; Neubert:2001sj ; Chiang:2002tv ; Cheng:2001sc ; Xing:2003fe .
Especially, in Refs. Xing:2001nj ; Xing:2003fe the
and modes were studied through the isospin analysis.
However, in those works, the possibility of a sizable relative strong
phase between the color-allowed and the color-suppressed tree amplitudes was
completely ignored.
On the other hand, in Ref. Chiang:2002tv , the and
modes were analyzed in the topological quark diagram
approach and in that analysis flavor SU(3) symmetry was assumed to combine
the relevant amplitudes with each other.
In this work, we re-analyze the and modes
as well as and in the quark diagram
approach, focusing on the following interesting issues. (i) We
estimate, in a model-independent way, the magnitude of the
relative strong phases, taking into account the possibility
of a sizable relative strong phase between the color-allowed and
the color-suppressed tree amplitudes. This approach is different
from that by Xing Xing:2001nj ; Xing:2003fe , where the strong
phase difference between the color-allowed and the
color-suppressed tree amplitude was assumed to be zero. (ii) We
first study the and
independently, without using the flavor SU(3) symmetry, in
order to avoid the possibly large effect of SU(3) breaking. (In
fact, we shall see later that the SU(3) breaking effect can be
sizable.) (iii) To determine the most likely values of the
magnitudes of the relative strong phase shifts in a
statistically reliable way, we do the analysis (with the
flavor SU(3) and its breaking effect together) and explicitly show
that the relative final-state strong phases in and are non-zero at 1 level. (iv) We examine
the validity of factorization approximation in these type decay modes, and estimate the flavor SU(3) symmetry
breaking effects in a model-independent way.
The paper is organized as follows. The decay modes and
are studied in Sec. II and the modes and are
analyzed in Sec. III. In Sec. IV, the analysis using
, and , is presented. The breaking effects
of the flavor SU(3) symmetry are estimated in Sec. V.
We conclude the analysis in Sec. VI.
II and decay modes
First, let us consider the decay processes .
The decay amplitudes for two-body hadronic decays can be represented
in terms of the basis of topological quark diagram contributions gronau ,
such as (color-allowed tree amplitude), (color-suppressed tree amplitude),
(exchange amplitude), and so on.
The relevant decay amplitudes for can be written as
(1)
where the topological amplitudes and are defined as
(2)
with the real amplitudes and the strong phases
.
Note that no weak phase appears in the above amplitudes due to the
Cabibbo-Kobayashi-Maskawa (CKM) factor .
From (1), the magnitudes and
and strong phase difference of the
topological amplitudes can be determined in a model-independent way:
(3)
where is the life time of .
The magnitude of the momentum of the meson in the center
of mass frame is given by
(4)
Notice that is the relative strong phase of
the color-suppressed tree amplitude to the color-allowed tree
amplitude.
Since the same relations (1) also hold for the corresponding
modes, the above result in (3) can be used for
the relevant modes , and
by simply replacing by .
Table 1: The BRs of , , , and
modes in units of .
Mode
Experimental value
Mode
Experimental value
Table 2: The numerical results for , , , and
. The results shown in the last two columns
are obtained from the fit for .
Mode
()
()
The experimental results on the BRs of and as well as
and are shown in Table I.
Using the measured BRs for decays, we calculate the magnitudes
of the color-allowed and the color-suppressed tree amplitudes and present
the results in Table II.
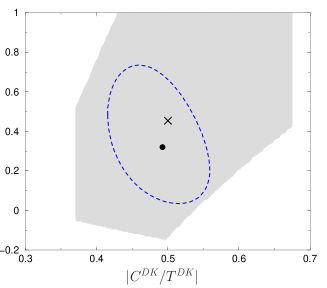
In Fig. 1, we show versus .
Due to the large uncertainty in the present data, it is still
possible that the phase difference
vanishes.
But, for the central values of the experimental data,
(5)
Further, the 1 region (whose boundary is shown as the ellipse in Fig. 1)
obtained from the analysis (See Sec. IV for more detailed discussion)
indicates that
(6)
where the possibility that is excluded.
We also note that the best fit values (shown as the black dot in Fig. 1)
with are
(7)
which are in good agreement with those obtained for the central values of the data
in Eq. (5).
Figure 1: For decays,
versus .
The mark “x” in the center denotes the result obtained from the central
values of the experimental data.
[The black dot is obtained from the fit with
(See Sec. IV).
The ellipse corresponds to the case.]
The strong phase difference is quite sizable.
It is also interesting to note that the contribution from the color-suppressed
tree diagram could be larger than the previously estimated one,
e.g., given in Ref. Xing:2003fe .
In other works, the large color-suppressed tree contribution is favored by
the present experimental data.
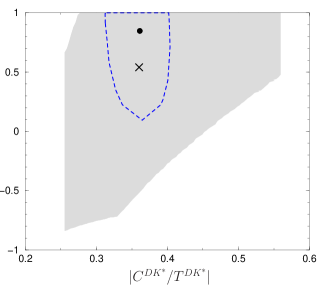
Figure 2: For decays,
versus .
The mark “x” in the center denotes the result obtained from the central
values of the experimental data.
[The black dot is obtained from the fit with
(See Sec. IV).
The half ellipse corresponds to the case.]
For modes, we present
versus in Fig. 2, and show the magnitudes of
and in Table II.
For the central values of the data,
(8)
As in the case of decays, we obtain a similar result for
decays: the phase difference is sizable and the large color-suppressed tree
contribution is favored.
Now let us examine the validity of the factorization approximation in
decays.
In the naive factorization approximation, the topological amplitudes
and are given by
(9)
where and are the relevant CKM matrix elements, and
and are the effective Wilson coefficients.
and denote the
decay constant of a meson and the hadronic form factor
for the transition at ,
respectively.
We obtain
(10)
where
(11)
For the central values of the data, and , which lead to
.
For the 1 range of the experimental values of the BRs, we find
(12)
For comparison, in the PQCD approach Keum:CKM2005 , it is estimated that
(13)
In QCD factorization, the effective Wilson coefficient for
modes is the same as that for modes, to a good approximation Beneke:2000ry .
The for is presented in next section.
It is known Beneke:2000ry that in this approach can not be reliably
calculated, because the mechanism of color transparency is not operative for the
class-2 decays, such as and ,
where the emission particle is a heavy charm meson. In next section, an illustrative
value of is shown.
Similarly, for decays, the amplitudes and
can be written as
(14)
We use the following parametrization Ball:2003rd :
(15)
where and denote the decay constant and the
polarization vector of the meson, respectively. and
() are the form factors for the
transition and given by the QCD sum rules on the light-cone Ball:2003rd .
With these form factors, we obtain
(16)
In the rest frame, is given by ,
where
(17)
Here is the Isgur-Wise function and
.
Using the central values of the data, we obtain and
, which give
.
For the range of the experimental data, the allowed value of
the ratio is in between 0.31 and 0.69.
From the above results, we see that if one assumes the
naive factorization in and decays, the
favored value of the ratio is much
larger than the usual estimate Xing:2003fe . This can be possibly understood if the
magnitude of the color-suppressed tree amplitude is
effectively enhanced due to non-factorizable contributions as in
the PQCD approach Keum:2003js or final-state interactions
Cheng:2004ru .
III and decay modes
Let us turn to decays.
The decay amplitudes can be represented in terms of the topological
amplitudes , and :
(18)
where the topological amplitudes , and
are defined as
(19)
with the real amplitude and the strong phases .
The above amplitudes involve no weak phase because of the CKM factor
.
In the above equations (18) and (19),
there are five unknown parameters
(one relative phase can be removed), while only three BRs have been measured from
experiments. To determine the unknown parameters, one needs more
information. For this purpose, one may invoke flavor SU(3) symmetry
to connect the amplitudes for to those for .
However, as we shall see later, the SU(3) breaking effect can be sizable.
Therefore, in our analysis, instead of using the SU(3) symmetry between
all the relevant amplitudes, we use the SU(3) symmetry only for the
exchange amplitude , because the exchange contribution
is expected to be small due to a suppression factor of .
From the measured BR for which involves only
the -exchange diagram, we obtain GeV Chiang:2002tv .
To be even more conservative, considering the SU(3)
breaking effect, we allow that lies within the 2
range, which leads to GeV.
Further, we allow that can vary
from 0 to .
The amplitudes and the phase differences can be written as
(20)
The above relations hold for the corresponding decay modes as well
and can be used for the relevant decays by simply replacing
by .
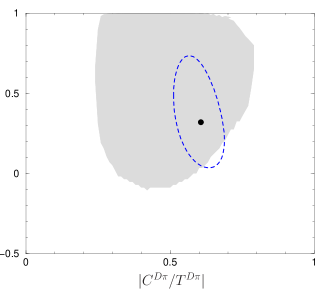
Figure 3: For decays,
versus .
[The black dot is obtained from the fit with
(See Sec. IV).
The ellipse corresponds to the case.]
Similarly to the case of decays, using the experimental result
for , we compute the magnitudes of the relevant amplitudes and
the phase differences.
Our numerical result is shown in Fig. 3 as a graph of
versus .
The magnitudes of and are shown in Table II.
The best fit values (shown as the black dot in Fig. 3) with
are (See Sec. IV)
(21)
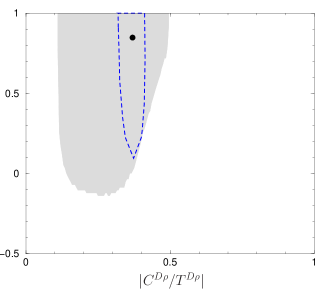
Figure 4: For decays,
versus .
[The black dot is obtained from the fit with
(See Sec. IV).
The half ellipse corresponds to the case.]
For decays, we also obtain similar results.
In this case, since only the upper bound for the BR of
(which involves only the annihilation contribution)
is known at present, we use GeV
as in the case of . As we shall see in Sec. IV this treatment turns
out to be reasonable.
We present the graph of versus
in Fig. 4.
The best fit values (shown as the black dot in Fig. 4) with
are (See Sec. IV)
(22)
Let us turn to examine the validity of the factorization in
and decays.
For decays, neglecting the small ,
(23)
where
(24)
For comparison, in PQCD calculation Keum:CKM2005 , it is predicted that
(25)
when the contribution from the exchange diagrams is neglected, and
(26)
when the contribution from the exchange diagrams is included.
In the QCD factorization approach Beneke:2000ry , is estimated
as . But, as commented in the previous section,
in this approach can not be reliably estimated.
For an illustration, a rough estimation Beneke:2000ry shows
(27)
For decays, neglecting the small ,
(28)
In the rest frame, is given by
,
where
(29)
As in the cases of and , the large values of
are favored for and
decays. It indicates that for and the
color-suppressed tree contributions to and are
effectively enhanced. The possible mechanism for this enhancement is
either the short-distance non-factorizable contribution Keum:2003js
or large final-state rescattering interactions Cheng:2004ru ,
or both of them.
IV The analysis using , , and ,
In order to find the most likely values of the magnitudes of the topological
amplitudes and the strong phase shifts in , , and , ,
we do the analysis using the BRs of these decay processes.
First we assume the flavor SU(3) symmetry between the topological amplitudes
for and (similarly for and ).
Then we will take into account the SU(3) breaking effect.
IV.1 The and case
Assuming the flavor SU(3) symmetry,
we have six observables (the measured BRs of and , as shown
in Table I) and five parameters [, , , ,
] so that the degrees of freedom () for the fit
is 1. Without considering the SU(3) breaking effect,
and are given by
and
, respectively.
In this case we find that indicating a poor fit.
Taking into account the SU(3) breaking at first order, such as
and , we find the best
fit with .
The corresponding parameter values are
(30)
The versus obtained from the above
ones for is depicted for in Fig. 2 and for
in Fig. 4. The result for is also shown as an ellipse
in the same figures and their numerical values are shown in Table II.
For the best fit, we find that ,
which indicates the relatively large color-suppressed tree contribution.
The best fit value for is in good agreement with
GeV used in Sec. III.
Our result indicates that the exchange contribution in decay
can be sizably enhanced as well, which is contrary to the usual estimate
in the QCD factorization.
Notice that within the flavor SU(3) symmetry with a reasonable SU(3) breaking
effect in the and decays,
the strong phase difference between the color-allowed and -suppressed
decay amplitudes does not vanish at the level of one standard deviation.
IV.2 The and case
Similarly to the and case, we have the six measured BRs of
and and the five parameters.
Assuming the flavor SU(3) symmetry [], we find that
.
The corresponding parameters are
(31)
Taking into account the SU(3) breaking effect [ and
], we find
another good fit with . The corresponding
parameters in this case are
(32)
The numerical values of and for
are shown in Table II.
Unlike the and case, good fits are obtained for both cases of
the SU(3) symmetry and the broken SU(3) symmetry.
This can be understood that in the and case the flavor
SU(3) breaking factor is almost equal to unity, while
in the and case the breaking factor is relatively
large.
Further, the parameters obtained in the case of the SU(3) symmetry are quite
similar to those obtained in the broken SU(3) symmetry, except the parameter
which shows a sizable difference in the two cases.
The black dots in Figs. 3 (for ) and 4 (for ) show
versus for .
Those values for are shown as a half ellipse in the
same figures.
We notice that the relatively large color-suppressed tree contribution is favored
in the and case as well:
for . The magnitude of is also
consistent with the one used in Sec. III.
It implies that the BR for would be similar to that
for . This will be tested with future experimental results
on the BRs for these decay modes.
V Flavor SU(3) symmetry breaking effect
Let us estimate the flavor SU(3)symmetry breaking effect in
and decays.
If flavor SU(3) were exact, one would get for and ,
(33)
and for and ,
(34)
To estimate the SU(3) breaking effect, let us take the central values
of the data as a typical example.
We find for and ,
(35)
and for and ,
(36)
The above result shows that the SU(3) breaking effect can be sizable: i.e.,
about at the amplitude level, except the color-allowed tree
amplitudes for and .
Our result for the color-allowed tree amplitudes in (35)
and (36) agrees with that of Ref. Xing:2001nj .
But, the result for the color-suppressed tree amplitudes
does not agree with the estimate in the naive factorization shown in
Xing:2001nj and shows about two or three times larger breaking effect.
It again indicates that the color-suppressed tree amplitudes can not
be reasonably estimated by the naive factorization, because they can be
effectively enhanced by non-factorizable effect and final-state interactions,
as discussed before.
VI Conclusion
We studied , and , decay processes in
a model-independent way. Using the quark diagram decomposition
of the decay amplitudes and the present experimental result on the relevant
BRs, we determined the magnitudes and the relative strong phase shifts of
the relevant amplitudes.
First we analyzed the and
modes separately from each other so that the flavor SU(3) symmetry is not needed
to combine the relevant amplitudes in and
with each other. As shown in Sec. V, the SU(3) breaking effect can be
sizable in these modes.
Further, in order to determine the most likely values for the relative strong
phases and the magnitudes of the amplitudes in a statistically reliable way, we used
the minimization technique. In this case, we used the flavor SU(3)
symmetry, but took its breaking effect into account as well.
Our results show that the strong phase differences between the
color-allowed and the color-suppressed tree amplitudes can be
large: for instance, for the mode, the best
fit value for is . It should
be emphasized that is non-zero at
1 level (Figs. 1 and 3). This result is obtained from the
statistical approach and clearly different from those of the
previous works, where was assumed to be
Xing:2001nj ; Xing:2003fe , or the vanishing
could not be excluded with the present data
Chiang:2002tv .
Another interesting result is that in , ,
decays, the color-suppressed tree contributions are
effectively enhanced, which is inconsistent with the naive
expectation in the factorization approximation. For example, the
best fit value is for , and for . These ratios are quite larger than
previously estimated ones as in Xing:2001nj ; Xing:2003fe ,
but are consistent with the recent results as in
Keum:2003js ; Cheng:2004ru ; Mantry:2003uz .
ACKNOWLEDGEMENTS
The work of C.S.K. was supported
in part by CHEP-SRC Program,
in part by Grant No. R02-2003-000-10050-0 from BRP of the KOSEF
and in part by 2004 Yonsei University Grant.
The work of S.O. was supported by Korea Research Foundation Grant
(KRF-2004-050-C00005).
The work of C.Y. was supported in part by Brain Korea 21 Program
and in part by Grant No. F01-2004-000-10292-0 of KOSEF-NSFC International
Collaborative Research Grant.
References
(1)
P. Krokovny et al. [Belle Collaboration],
Phys. Rev. Lett. 90, 141802 (2003)
[arXiv:hep-ex/0212066].
(2)
D. Atwood, I. Dunietz and A. Soni,
Phys. Rev. Lett. 78, 3257 (1997)
[arXiv:hep-ph/9612433];
Phys. Rev. D 63, 036005 (2001)
[arXiv:hep-ph/0008090].
(3)
M. Gronau and J. L. Rosner,
Phys. Lett. B 439, 171 (1998)
[arXiv:hep-ph/9807447].
(4)
J. H. Jang and P. Ko,
Phys. Rev. D 58, 111302 (1998)
[arXiv:hep-ph/9807496].
(5)
C. S. Kim and S. Oh,
Eur. Phys. J. C 21, 495 (2001)
[arXiv:hep-ph/0009082].
(6)
M. Beneke, G. Buchalla, M. Neubert and C. T. Sachrajda,
Nucl. Phys. B 591, 313 (2000)
[arXiv:hep-ph/0006124].
(7)
Y. Y. Keum, T. Kurimoto, H. N. Li, C. D. Lu and A. I. Sanda,
Phys. Rev. D 69, 094018 (2004)
[arXiv:hep-ph/0305335].
(8)
Z. z. Xing,
High Energy Phys. Nucl. Phys. 26, 100 (2002)
[arXiv:hep-ph/0107257].
(9)
M. Neubert and A. A. Petrov,
Phys. Lett. B 519, 50 (2001)
[arXiv:hep-ph/0108103].
(10)
C. W. Chiang and J. L. Rosner,
Phys. Rev. D 67, 074013 (2003)
[arXiv:hep-ph/0212274].
(11)
H. Y. Cheng,
Phys. Rev. D 65, 094012 (2002)
[arXiv:hep-ph/0108096].
(12)
Z. z. Xing,
Eur. Phys. J. C 28, 63 (2003)
[arXiv:hep-ph/0301024].
(13)
M. Gronau, O. F. Hernandez, D. London and J. L. Rosner,
Phys. Rev. D 50, 4529 (1994)
[arXiv:hep-ph/9404283];
ibid.52, 6356 (1995)
[arXiv:hep-ph/9504326];
ibid.52, 6374 (1995)
[arXiv:hep-ph/9504327].
(14)
Y. Y. Keum, 3rd Workshop On The Unitarity Triangle: CKM 2005,
15-18 March 2005, San Diego, California.
(15)
P. Ball,
eConf C0304052, WG101 (2003)
[arXiv:hep-ph/0306251].
(16)
H. Y. Cheng, C. K. Chua and A. Soni,
arXiv:hep-ph/0409317.
(17)
S. Mantry, D. Pirjol and I. W. Stewart,
Phys. Rev. D 68, 114009 (2003) [arXiv:hep-ph/0306254].