Probing supernova shock waves and neutrino flavor transitions
in next-generation water-Cherenkov detectors
Abstract
Several current projects aim at building a large water-Cherenkov detector, with a fiducial volume about 20 times larger than in the current Super-Kamiokande experiment. These projects include the Underground nucleon decay and Neutrino Observatory (UNO) in the Henderson Mine (Colorado), the Hyper-Kamiokande (HK) detector in the Tochibora Mine (Japan), and the MEgaton class PHYSics (MEMPHYS) detector in the Fréjus site (Europe). We study the physics potential of a reference next-generation detector (0.4 Mton of fiducial mass) in providing information on supernova neutrino flavor transitions with unprecedented statistics. After discussing the ingredients of our calculations, we compute neutrino event rates from inverse beta decay (), elastic scattering on electrons, and scattering on oxygen, with emphasis on their time spectra, which may encode combined information on neutrino oscillation parameters and on supernova forward (and possibly reverse) shock waves. In particular, we show that an appropriate ratio of low-to-high energy events can faithfully monitor the time evolution of the neutrino crossing probability along the shock-wave profile. We also discuss some background issues related to the detection of supernova relic neutrinos, with and without the addition of gadolinium.
pacs:
14.60.Pq, 97.60.Bw, 29.40.KaI Introduction
The successful operation and the great scientific impact of the Super-Kamiokande (SK) water-Cherenkov experiment Kosh ; SKde have motived several research groups to investigate in detail the feasibility of a Megaton-class detector Ko92 for nucleon decay and neutrino physics. Three main projects are currently being pursued: the Underground nucleon decay and Neutrino Observatory (UNO) project in the Henderson Mine (Colorado, U.S.) UNNO ; Jung , the Hyper-Kamiokande (HK) project in the Tochibora mine (Japan) HK03 , and the MEgaton class PHYSics (MEMPHYS) project in the Fréjus site (Europe) Vill . These next-generation detectors are characterized by a prospective fiducial mass of 0.4 Mton or higher, which will allow studies of neutrinos of astrophysical or terrestrial origin with unprecedented statistics and sensitivity Nu04 .
In particular, a new window would be opened on supernova neutrino physics: by naively rescaling the detector mass, it turns out that a 0.4 Mton experiment would observe a SN1987A-like signal with a statistics times higher than in Kamiokande (2.14 kton) Ko92 , and could promote the current SK upper limit on supernova relic neutrinos Male into a positive detection. In general, the observation of a large number of supernova neutrino events will allow statistically significant spectral analyses in the energy, angular, and time domain. In this context, the identification of relatively model-independent spectral features is important to disentangle, as far as possible, information related to supernova physics and neutrino emission from those related to neutrino flavor transitions. Recent spectral studies which refer to prospective Mton-class water-Cherenkov detectors include: analyses in the energy domain to probe neutrino mass-mixing parameters Luna , to perform multiparameter fits including neutrino emission parameters Barg ; Mina , and to identify Earth matter effects Eart ; analyses in the time domain to identify the neutronization burst Whit ; Appe or signatures of shock-wave propagation effects Luna ; Reve ; analyses in the angular domain to achieve supernova pointing Poin ; background reduction projects using gadolinium GADZ ; Ando .111We mention that large liquid argon detectors (not considered in this work) can also provide important information on supernova neutrinos; see. e.g., the recent works Arg1 ; Arg2 ; Arg3 ; Arg4 ; Arg5 .
In this work, we aim at studying some time dependent and independent observables related to (extra)galactic core collapse supernovae, assuming a prospective 0.4 Mton fiducial mass water-Cherenkov detector. In particular, we investigate the effects of the supernova shock propagation on the observable neutrino signal. We analyze the imprint of the shock wave on the time spectra of inverse beta decay events, and show that the ratio between the number of events in two suitably chosen energy ranges can actually monitor the time dependence of the neutrino crossing probability , thus opening a unique opportunity to study shock-induced flavor transitions in “real time”. Moreover, we also study the shock-wave imprint on the time spectra of events coming from scattering of neutrinos on oxygen and on electrons. We point out that the shock wave produces a characteristic distorsion of the oxygen event spectra in time domain. The elastic scattering spectrum is instead rather insensitive to the shock-wave propagation and might be thus used to track the overall decrease of neutrino luminosity.
We also study other observables that are basically insensitive to shock-wave effects. In particular, we discuss the sensitivity of a 0.4 Mton detector in detecting total event rates for various interaction processes, supernova relic neutrinos and neutrinos from silicon burning before core collapse.
The structure of this paper is as follows. In Sec. II we present the ingredients of our calculations. We discuss our choice for several input (supernova simulations, neutrino oscillation parameters, effective detection cross sections) needed to compute the SN signal. In Sec. III we discuss the results of our calculations for observables which are not sensitive to shock waves, i.e., the total number of events in the pre-supernova phase and after supernova explosion, and the energy spectra of the diffuse SN relic neutrino background with and without gadolinium loading. In Sec. IV we investigate in detail the shock-wave signature on the neutrino time spectra, and present a possible strategy to monitor the time evolution of the neutrino crossing probability along the shock wave profile, by means of an appropriate ratio of low-to-high energy events. Conclusions and prospects are given in Sec. V.
II Overview of Calculations
In this Section we describe the main aspects and ingredients of our calculations of supernova neutrino event rates. We remind that, in general, numerical simulations of supernova explosions provide the unoscillated double differential neutrino distribution in energy and time,
| (1) |
where , and in standard notation DiSm ; Digh ( indicating any non-electron flavor). Such initial distributions are in general modified by flavor transitions (see, e.g., Luna ; Digh ),
| (2) |
and must be convoluted with the differential interaction cross section for electron or positron production, as well as with the detector resolution function , and the efficiency , in order to finally get observable event rates Luna ,
| (3) |
II.1 Neutrino spectra in energy and time
To our knowledge, only the Lawrence Livermore (LL) group has published in detail LLLL a successful simulation of supernova explosion and neutrino emission for a time interval long enough ( s) to cover the phenomenon of shock propagation Reve ; Schi ; DaWi . Since we are particularly interested to shock-wave signatures on neutrino flavor transitions, we assume the LL simulation (which refers to a supernova progenitor mass of solar masses) as our reference input for (time after bounce).
For , Odrzywolek, Misiaszek and Kutschera (OMK) Sili have recently estimated that the silicon burning phase preceding supernova explosion can release an energy of about erg in neutrino-antineutrino pairs (with ) for about a couple of days, assuming a 20-solar mass progenitor (see, however, Woos for different time estimates). In the absence of more detailed information, we assume a uniform neutrino flux from silicon burning for two days before , with emission parameters taken from Sili .

In both cases ( and ) we factorize the differential distribution of Eq. (1) as:
| (4) |
for any flavor (, and ), where represents the neutrino emission rate (number of per unit time), while is the normalized () energy spectrum parametrized as in Keil
| (5) |
where is the average neutrino energy and is an energy shape parameter. In general, both and can be function of time. For simplicity, we have taken for all flavors for Poin , and (from a fit to the spectrum in Sili ) for . For , the average energies for each flavor are given as a function of time in the LL simulation LLLL , while for they are assumed nearly constant and equal to MeV for all flavors in the OMK evaluation Sili .
Figure 1 shows the main characteristics of our reference supernova emission model. The upper and lower panels show the neutrino emission rate and the average neutrino energy for different flavors. The left panels refer to the silicon burning phase from the OMK calculations Sili , while the right panels refer to the supernova neutrino burst from the LL group simulation LLLL . According to the LL simulation, all flavors have comparable emission rates (within a factor ) in the so-called cooling phase (). In the preceding phase the relative emission rate is higher, and shows a distinct neutronization peak at 0.04–0.05 s. For later purposes, we observe that the LL simulations predict limited variations () of the average neutrino energy in the time range ( s) relevant for shock-wave effects on neutrino flavor transitions.

Figure 2 shows the normalized neutrino spectra for each flavor, after a flux-weighted average over time, for both the silicon burning phase (left panel) and after supernova explosion (right panel). For later purposes, in the right panel we have restricted the integration interval to s, i.e., to the interval where shock-wave effects are relevant for flavor transitions. Note that, in the silicon burning phase, the spectra are equal for all flavors, and are peaked at relatively low energy ( MeV) Sili . During the supernova explosion, neutrinos have an order of magnitude higher average energy, and are peaked at different energy for each flavor LLLL . Of course, the detailed features of the reference emission model in Figs. 1 and 2 must be taken with a grain of salt, since the distribution of the total energy in flavor and time is currently subject to large uncertainties, which may be reduced in more advanced future simulations Bura .
II.2 Neutrino crossing probability and shock waves
Assuming standard three-neutrino mixing, the parameters relevant to flavor transitions in supernovae are the two independent squared mass difference and and the mixing angles and (see, e.g., Simp ). For eV2, as currently indicated by reactor and solar neutrino data KamL , the dependence on actually vanishes, while the dependence on and on can be essentially embedded in the so-called crossing probability (up to Earth matter effects that, for simplicity, we do not consider in this work). In general, takes the same form for both neutrinos and antineutrinos Simp ,
| (6) |
where is the neutrino potential profile Matt at radius and time ,
| (7) |
and is the electron density. When needed, we fix eV2 from atmospheric and accelerator data SKam , from reactor and solar data KamL , and take representative value of below current upper bounds CHOO .
Matter effects are potentially relevant when the potential equals the neutrino wavenumber ,
| (8) |
Indeed, it has been shown in Miri that, even for non-monotonic supernova density profiles, the evaluation of in Eq. (6) can be obtained with good approximation through a simple procedure involving the ordered product of matrices embedding the local crossing probabilities Petc , evaluated at all points where Eq. (8) is fulfilled. This approximation is particularly useful to study the effect of non trivial density profiles, such as those induced by shock waves.
In a seminal paper Schi , Schirato and Fuller noted that the propagation of the forward shock wave in the LL simulation DaWi could influence neutrino flavor transitions a few seconds after core bounce. In addition to forward shock effects, it has been recently pointed out Reve that a second (“reverse”) shock front, is also expected to propagate behind the forward one (at a lower velocity), although a detailed description is not yet possible within current numerical experiments.
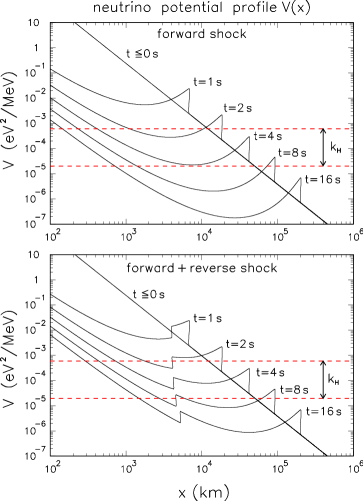
Figure 3 shows the simplified shock-wave profiles used in this work. The upper panel refers to the neutrino potential in the presence of forward shock only Schi , using the same parametrization as in Miri . The main features of the forward shock profile are a sharp discontinuity at the shock front (which can induce a strongly nonadiabatic transition) leaving behind an extended rarefaction zone. In the lower panel we have graphically adapted the results of the simulation in Reve to account for a reverse shock, characterized by a smaller discontinuity at the front. In both panels, we also show the band spanned by the neutrino wavenumber for MeV. The condition for large matter effects () implies then that at relatively early (late) times only the static profile (the rarefaction zone) is relevant, while for intermediate times (e.g., 2, 4 or 8 s in Fig. 3) the propagation of the shock front(s) must be accounted for.222Neutrinos from silicon burning may also experience flavor transitions along the static profile (not considered in Sili ). In fact, for a typical energy MeV (see Fig. 2, left panel), the condition is fulfilled at km for the static profile, i.e., below the estimated silicon core radius ( km).

Figure 4 shows our calculation of as a function of time for four representative values of , and for a relatively high neutrino energy ( MeV, useful for later purposes). The left panels refers to the case with forward shock only, where the strong variations induced by the passage of the front discontinuity and then by the rarefaction zone are marked by vertical dotted lines. We refer the reader to Miri for a thorough discussion of forward-shock effects on . The right panels refer to the case with forward plus reverse shock, where the effects of the reverse shock appear to change dramatically the crossing probability at intermediate times. Qualitatively, the nonadiabatic transition at the reverse shock front can partially “undo” the effect of the analogous transition at the forward shock front; this is particularly evident, e.g., in the two upper panels. We refer the reader to Reve for further discussions about the time dependence of in the presence of a reverse shock. Despite its complexity, such time dependence might be monitored surprisingly well in future water-Cherenkov detectors, as we shall see in Sec. IV.
II.3 Neutrino spectra and “critical energy”
The neutrino fluxes at the supernova exit () are linear combinations of the initial fluxes (), with coefficients governed by and by the mixing angle , as well as by the mass spectrum hierarchy (normal or inverted). In particular, for normal mass hierarchy it is (see, e.g., Digh )
| (9) | |||||
| (10) |
while, for inverted hierarchy,
| (11) | |||||
| (12) |
Notice that, for , the case of inverted hierarchy with is indistinguishable from the case of normal hierarchy; similarly, for , the case of normal hierarchy with is indistinguishable from the case of inverted hierarchy.
For later purposes, it is useful to introduce the concept of “critical energy” Luna , defined as the energy where the initial and fluxes are approximately equal,
| (13) |
At the critical energy, flavor transitions are not effective in the antineutrino channel, and the flux at supernova exit equals the initial one,
| (14) |
for both normal and inverted hierarchy.
In the LL simulation LLLL , the critical energy is relatively well defined and stable for s (the range relevant for shock-wave effects); in this time interval, the and emission rates are comparable, and their average energies do not vary too much in time (see Fig. 1). Within the LL simulation, the critical energy is then approximately defined by the crossing point of the time-averaged and spectra in Fig. 2, i.e., MeV. This energy provides a sort of “no oscillation benchmark”, in comparison with higher energies (say, –50 MeV), where (see Fig. 2) and flavor oscillation effects do not cancel. Of course, the next real supernova explosion might be characterized by a “critical energy” different from this or other simulations.333A remark is in order. The concept of “critical energy” is well defined only if the and energy spectra turn out to have different shapes and thus a crossing energy point, as is the case for the LL simulation LLLL at MeV. Recent simulations Bura predict and spectrum differences which, although smaller than in the LL case, in general still allow a meaningful definition of the critical energy. We shall discuss in Sec. IV A a possible way to circumvent our “a priori” ignorance of the real value of , when seeking signatures of shock-wave effects.
II.4 Neutrino interactions and detection
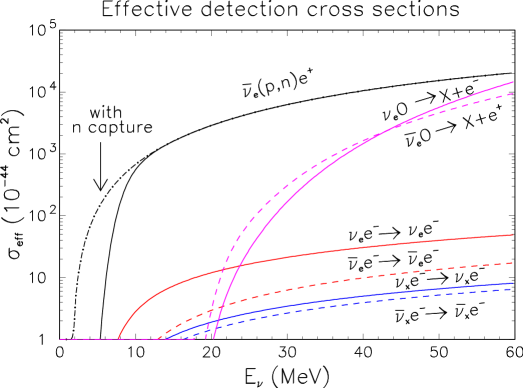
In large water-Cherenkov detectors, the interaction processes which can provide observable supernova neutrino event rates are: (i) inverse beta decay (possibly with neutron capture in Gd GADZ ); (ii) (anti)neutrino scattering on oxygen; and (iii) (anti)neutrino scattering on electrons. For the process (i), we take the differential cross section from Stru (we recall that the positron energy closely tracks the neutrino energy Stru ). For the process (ii), we take the total cross section from Kolb , where we have assumed the same energy distribution for all the channels. The differential cross sections for the processes in (iii) are well-known (see, e.g., Poin ).
For any interaction process, we fold the differential cross sections for production with a Gaussian energy resolution function of width , and apply a sharp cut to events with measured energy below a threshold value . The value of is determined by the photocatode coverage. For a coverage comparable to the current one in Super-Kamiokande II ( of the area Suzu ), as envisaged in typical Mton-class projects Nu04 , we derive from the information in Suzu that
| (15) |
We also adopt the conservative value MeV from Vill . The detection efficiency is assumed to be 1 above threshold. Unless otherwise noticed, the fiducial volume for supernova neutrino detection is assumed to be 0.4 Mton UNNO ; Vill .
Figure 5 shows the effective cross sections as a function of neutrino energy for the various processes discussed before, including resolution and threshold effects. Notice that, by adding Gd GADZ , the neutron capture signature allows to detect sub-threshold inverse beta decay events.
III Observables not probing shock waves
In this Section we discuss the results of our calculations for time-integrated observables, such as the total number of events from a single supernova explosion or from the diffuse supernova neutrino background, which are basically insensitive to shock-wave effects. Oscillation effects are simply accounted for by varying in its full range for both normal and inverted hierarchy (for a static profile, this is equivalent to vary in the currently allowed range, few%, see e.g., Luna ).
III.1 Total number of events
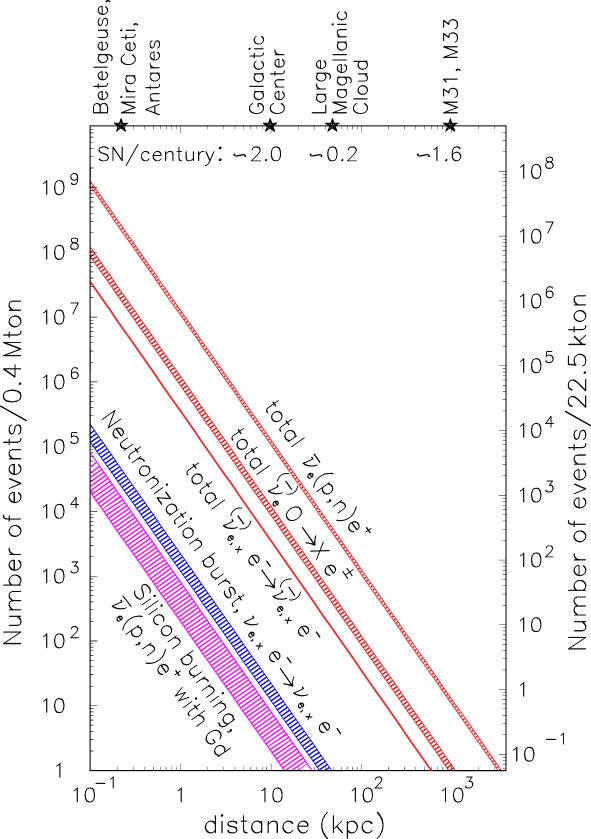
Figure 6 shows the total number of events expected in a 0.4 Mton detector for various interaction processes, as a function of the supernova distance in kpc. (For the sake of comparison, the vertical axis on the right refers to the number of events for a SK-like volume of 22.5 kton). Relatively close stars which might evolve into core-collapse supernovae at unpredictable future times include Betelgeuse, Mira Ceti, and Antares. For close galaxies Tull , the rate of core-collapse supernovae may be inferred from their luminosity and morphology Capp ; representative estimates based on Tull ; Capp (to be taken within a factor of two) are reported in the upper part of the figure for: the galactic center, the Large Magellanic Cloud (LMC), and the M31+M33 spiral galaxies. For each interaction process, the uncertainty due to our ignorance of the hierarchy and of is accounted for by the vertical spread of the bands. The relatively different spreads reflect different sensitivities to neutrino flavor transitions. Let us now discuss the various classes of events from bottom to top.
Inverse beta decay events from silicon burning have very low (sub-threshold) positron energies, and can only be detected through neutron capture by adding gadolinium GADZ , provided that they can be statistically distinguished from background fluctuations. At a distance of 1 kpc, we estimate to Si burning events over about two days. This large variation is due to the large ratio (see Sec IA), which implies –, where the lowest value is obtained for inverted hierarchy and , while the highest value is obtained for either inverted hierarchy with or for normal hierarchy. The estimated signal rate of – events/day at 1 kpc should be compared with the background rate from spallation neutrinos (e.g., 1780 events/day at the Kamioka site), reactor neutrinos (e.g., events/day at the Kamioka site), and from minor contributions (natural radioactivity). We have taken such backgrounds from GADZ and rescaled them to a 0.4 Mton mass. Assuming a typical total background rate of events per day (statistical errors only), the silicon burning signal should then be seen with a statistical significance of 2–8 standard deviations at a reference distance of 1 kpc. Unfortunately, at the galactic center ( kpc) the estimated silicon burning signal would be 100 times smaller and thus unobservable.
There are better prospects to observe the neutronization burst from a galactic supernova by means of elastic scattering on electrons, including contributions from all flavors. The contribution of antineutrinos can be neglected, being suppressed both by the original flux and by the cross section (see Figs. 1 and 5). The contribution of non-electron neutrino flavors can be derived by using Eq. (10) or Eq. (12) plus the unitarity condition . In general, the dominant contribution comes from (with either in normal hierarchy with or in inverted hierarchy), except for the case of normal hierarchy with , where dominates. Therefore, we expect a signal variation by a factor (where is the elastic cross section), due to our ignorance of the hierarchy and of . Indeed, at 10 kpc we estimate from to events during the time interval of the neutronization peak ( ms in the SN simulation, see Fig. 1). The smallness of this time interval and the forward-peak signature of elastic events make this event sample basically background-free. In conclusion, a 0.4 Mton detector might observe the neutronization signal from a galactic supernova with a typical statistical significance of 3.5–4.7 standard deviations, assuming the emission model in Fig. 1. At the distance of the Large Magellanic Cloud, however, the sensitivity drops dramatically [ event, see Fig. 6].
Let us now consider the (total) contributions from elastic scattering, absorption on oxygen, and inverse beta decay, integrated over the time interval s. For elastic scattering, the slanted band in Fig. 6 is characterized by the smallest vertical spread, since the contributions from all flavors tend to partly cancel flavor transition effects. In a sense, the elastic scattering event sample ( events at 10 kpc, easily separable through forward-direction cuts) could be used as a reference value to estimate the original, unoscillated neutrino flux. The cross section for and absorption on oxygen becomes rapidly larger than the elastic scattering cross sections above MeV (see Fig. 5), where the adopted energy spectra are still sizeable (see Fig. 2). At kpc, we obtain about events ( uncertainty from ignorance of the hierarchy and of ), with a significant contribution from . If the case of normal hierarchy, the contribution might provide a handle to flavor transitions not observable in the “canonical” channel (inverse beta decay), as we shall discuss in the context of shock-wave signatures. We remind that events from (anti)neutrino absorption on oxygen are slightly backward peaked Kolb .
Finally, the inverse beta decay channel will provide, in general, such a large statistics in a 0.4 Mton Cherenkov detector ( events at 10 kpc) that a handful of events might be seen even at a distance as large as Mpc. The high statistics available for a galactic supernova explosion will allow many possible spectral analysis, examples of which will be given in Sec. IV in the context of shock-wave effects. Here we simply notice that, since the angular distribution of from inverse beta decay is slightly forward peaked (see, e.g., Stru ), a statistical separation from oxygen absorption events appears quite feasible, not only for the total event sample, but also for subsamples (e.g., time or energy bins). For instance, we have checked that, for an inverse beta decay event sample, the slope of the positron distribution in (where is the scattering angle between and ) changes significantly—with respect to the very small statistical errors—when oxygen events are added (not shown); further studies are needed, however, to make quantitative statements in this sense.
III.2 Supernova relic neutrinos
In this section we study the flux of neutrinos coming from all past core-collapse supernovae (so-called Supernova Relic Neutrinos, SRN). Since the Super-Kamiokande SRN upper limit is only a factor of a few above typical flux estimates Male , the SRN detection through inverse beta decay appears a feasible goal in Mton-class detectors, especially if the background can be suppressed by capturing the neutron with gadolinium GADZ . SRN detection might be even closer Stri in view of recent experimental data from the Galaxy Evolution Explorer (GALEX) mission GALE , which suggest an increase of the estimated star formation rate (SFR) and thus of the SRN flux Stri . In the following, we present quantitative estimates of the SRN signal (for a 0.4 Mton detector), based on the emission model discussed in Sec. II A and on the same astrophysical input as we used in Deca , except that we adopt here the lowest SFR function allowed by the (dust-corrected) GALEX and other data (i.e., the curve labeled as “” in Fig. 5 of GALE ), consistently with the “concordance SFR” advocated in Stri . Our background estimates refer to the Kamioka site, for definiteness.
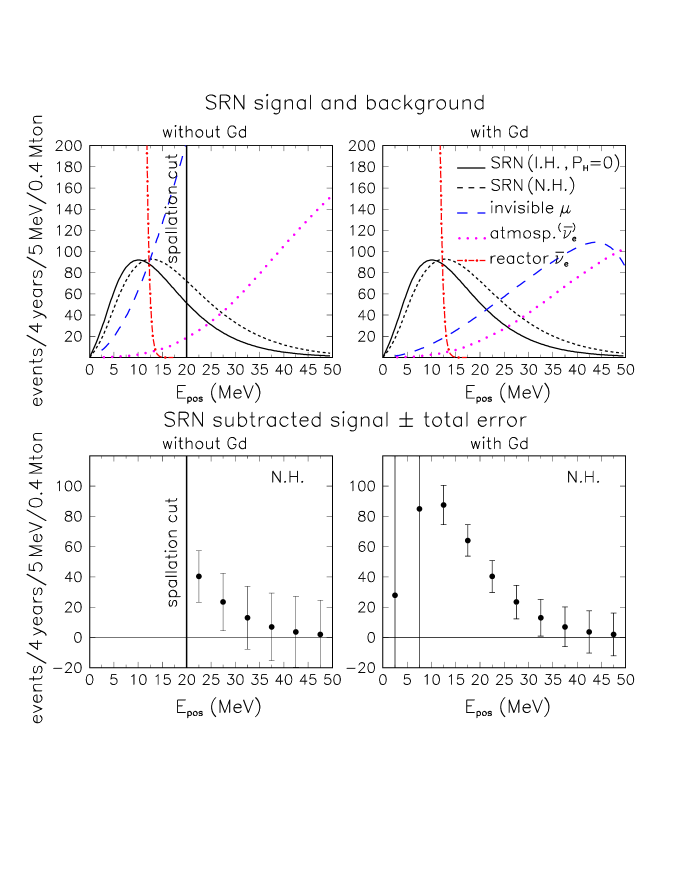
Figure 7 shows, in the upper left panel, the absolute relic neutrino spectrum expected in the two extreme cases of normal hierarchy and of inverted hierarchy with , the latter being the most favorable in term of event rates. The abscissa is labelled by the measured positron energy. The vertical scale gives the number of events in 5 MeV bin of the measured positron energy, for an exposure of (0.4 Mton)(4 years); for the sake of clarify, however, are shown as continuous curves rather than as 5-MeV bin histograms. In the upper left panel, we also show the background from invisible muons (with normalization taken from the SK measurement Male , rescaled to 0.4 Mton), and the background from low-energy atmospheric and , which we have calculated using the recent FLUKA fluxes FLUK . We remind that in the SRN energy range, the ’s interact dominantly through inverse beta decay and subdominantly through absorption on oxygen, while ’s dominantly scatter on oxygen. For simplicity, we have assumed no atmospheric or oscillations; however, as also remarked in Deca , we stress that oscillation effects induced by the “solar” squared mass difference cannot be totally neglected in this context, since in the energy range of Fig. 7. The reactor neutrino background has been estimated on the basis of the spectrum shape in Reac (appropriate to parametrize the high-energy tail of the reactor spectrum), with total normalization provided by the observed flux in the KamLAND experiment KamL . Finally, a MeV hard cut to reject spallation events Male is also shown. In the upper right panel (as compared to the upper left one) we assume that inverse beta decay events can be tagged by neutron capture in gadolinium. In this case, although the reactor background cannot be reduced (having the same signature as SRN events), spallation events are fully rejected. Concerning atmospheric neutrinos, it is estimated that invisible muon events and oxygen absorption events can be reduced by a factor of with gadolinium Priv .
From the comparison of the upper panels in Fig. 7 we learn that, even with gadolinium, the extraction of the SRN signal requires a careful subtraction of (supposedly known) backgrounds from the total signal. Therefore, it is important to improve as much as possible the knowledge of both the shape and the normalization of the background. In all cases, the shape is partly controlled by the energy resolution, which must be known very well; in fact, any increase or uncertainty in the resolution width (due, e.g., to variation in the phototube coverage) will make some background event “leak” in the SRN sample, especially from the reactor neutrino sample, characterized by a steeply falling spectrum. Further studies of atmospheric neutrino fluxes FLUK and of their interactions in oxygen Kolb in the low-energy regime will also be beneficial to the reduce systematic uncertainties in the extraction of the SRN signal.
If we neglect systematics, the SRN number of event (derived from , where is the estimated number of background events) is affected by an error . Figure 7 shows, in the lower panel, the prospective values of , for the less favorable case of normal hierarchy. The impact of gadolinium is evident both as a reduction of the error bars and as a reduction of the energy threshold for SRN detectability. However, even without gadolinium, a – SRN signal could emerge after an exposure of 4 years with 0.4 Mton. The situation would be more favorable in the case of inverted hierarchy with (not shown in the lower panels of Fig. 2).
In conclusion, there are good prospects to reveal a SRN signal with an exposure of a few years in a 0.4 Mton detector, especially (but not necessarily) with the addition of gadolinium. Further studies are needed, however, for a better characterization of the background. In particular, in the SRN energy range, the tails of the reactor and atmospheric spectra, and of the energy resolution function, need to be under control to avoid migration of events.
IV Observables probing shock waves
In this Section we study possible signatures of shock-wave effects that might be seen in a 0.4 Mton detector. We assume a galactic supernova ( kpc) and consider first the shock signatures in the absolute spectra of inverse beta decay events. We show then that a specific spectral ratio can actually monitor the time dependence of the crossing probability , thus providing real-time information about the density profile. Finally, we show how events from elastic scattering and absorption on oxygen can further help the discrimination of shock-wave effects.
IV.1 Absolute time spectra from inverse beta decay
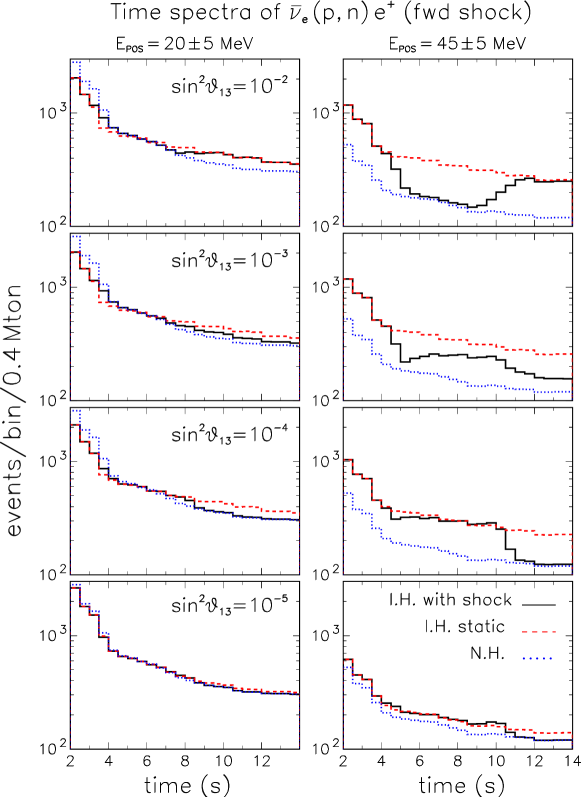
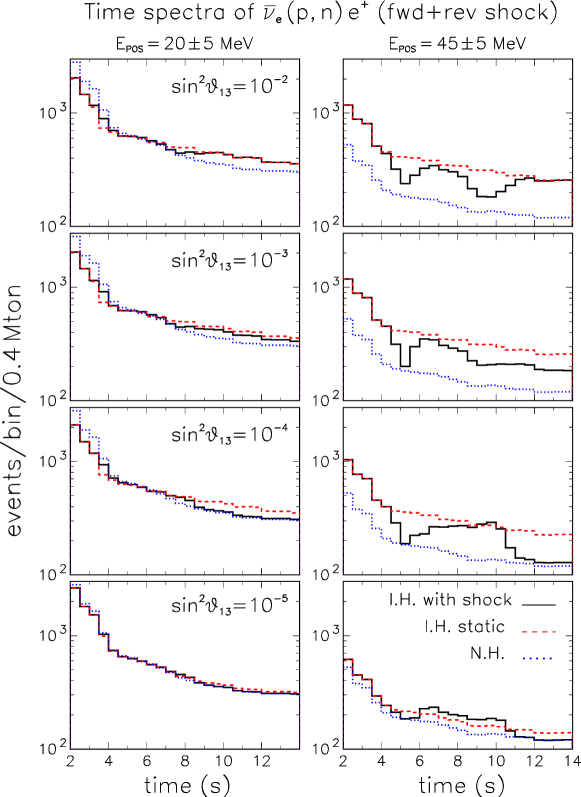
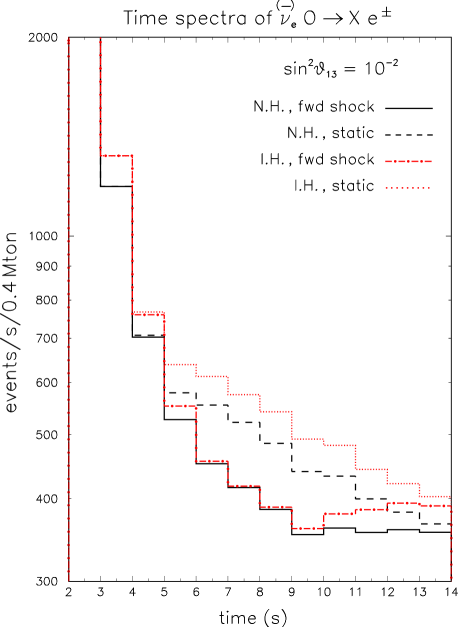
Inverse beta decay events can be sensitive to shock-wave effects on only in the case of inverted hierarchy [see Eqs. (9) and (11)]. However, inverted hierarchy is a necessary but not sufficient condition. For ’s with , where is the critical energy introduced in Sec. II C ( MeV for the our adopted emission model), flavor transition effects will be largely cancelled, including matter effects along the shock profile. No such cancellation is expected, however, at higher energy (say, 45 MeV). Therefore, it makes sense to compare the expected time spectra of events generated by neutrinos of relatively “low” energy ( MeV) and relatively “high” energy ( MeV) for both normal and inverted hierarchy, with and without shock in the latter case.
Figures 8 and 9 show absolute time spectra of events for the cases of forward shock only and of forward plus reverse shock, respectively, for the same representative values of used in Fig. 4. In both Fig. 8 and 9, the left (right) panels represent the time evolution of the number of events within the positron energy bin MeV, ( MeV) for the cases of normal hierarchy, inverted hierarchy with static profile, and inverted hierarchy with dynamical shock profile. The number of events in the bin MeV is generally smaller than for MeV. The time spectra in the bin MeV show strong signatures of shock-wave effects for inverted hierarchy, in the form of non-monotonic time variations of the event rate, especially at relatively high values of and in the case of forward plus reverse shock. The amplitude of such variations is approximately contained within the two extreme cases of inverted hierarchy with no shock and of normal hierarchy. Conversely, the shock-induced time variations in the bin MeV are significantly smaller, and could be hardly characterized a priori as non-monotonic. This feature can provide a sort of “postdiction” of the critical energy , should real shock-wave effects be seen in a future supernova explosion: could be identified as the energy where nonmonotonic time variations of the observed signal are most suppressed (as compared with variations at higher energies). This empirical definition of is sufficient for our purposes and, in any case, cannot be made more precise, both because may fluctuate with time and because the detector energy resolution function has a nonnegligible width. Finally, we observe that the high number of events in each time bin of Figs. 8 and 9 excludes that the spectral variations (or their absence) can be obscured by statistical fluctuations.
IV.2 Low-to-high energy ratio of time spectra
The results discussed in the previous section suggest that the signatures of shock wave effects can be enhanced by comparing time spectra at the critical energy , where, one has by construction
| (16) |
at any [see Eqs. (13) and (14)], with time spectra at significantly higher energy , where one expects (see Figs. 1 and 2) and thus
| (17) |
for normal hierarchy [Eq. (9)] and
| (18) |
for inverted hierarchy [Eq. (10)]. It is convenient to choose so that the flux reduction from to [] is roughly compensated by the increase of the inverse beta decay cross section [],
| (19) |
With such choice for , one can derive from the previous equations the following approximate ratio of inverse beta decay events at and :
| (20) |
for normal hierarchy and
| (21) |
for inverted hierarchy.
For our adopted emission model, the condition in Eq. (19) is fulfilled at MeV, which explains a posteriori our choice for the “high” energy bin in Figs. 8 and 9. Other choices for around 45 MeV would simply provide an overall factor on the right hand side of Eqs. (20) and (21), with no substantial change in the following discussion.
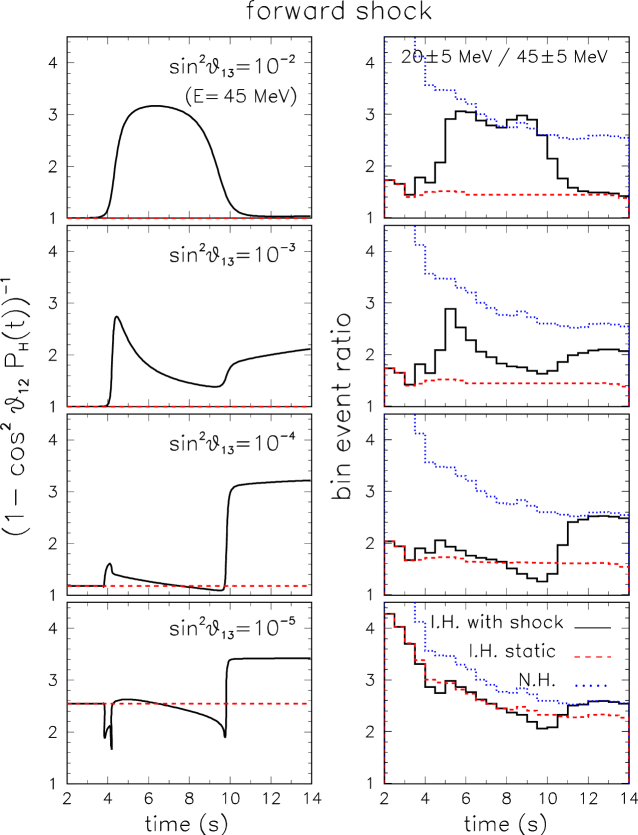
Figure 10 shows the ratio of events in the MeV bin with respect to events in the MeV bin, as compared with the function . Notice that this function has the same qualitative behavior as itself (see Fig. 4). It can be seen that, in inverted hierarchy, shock effects are faithfully monitored by the chosen ratio of events, i.e., there is a striking correspondence (even in absolute values, within a factor of 2 or better) between the solid histograms on the right and the solid curves on the left in Fig. 10, up to smearing effects due to the detector resolution. For inverted hierarchy with no shock (dashed curves and histograms) there is also a reasonable correspondence of the event ratio on the right with the constant value on the left. For normal hierarchy, as expected, any information on is lost. Therefore, in the case of inverted hierarchy, the ratio of events at “high energy” and “critical energy” appears as a useful tool to track the main variations (and possibly the absolute value) of the crossing probability , from which one could get precious information about the density gradient along the shock profile.
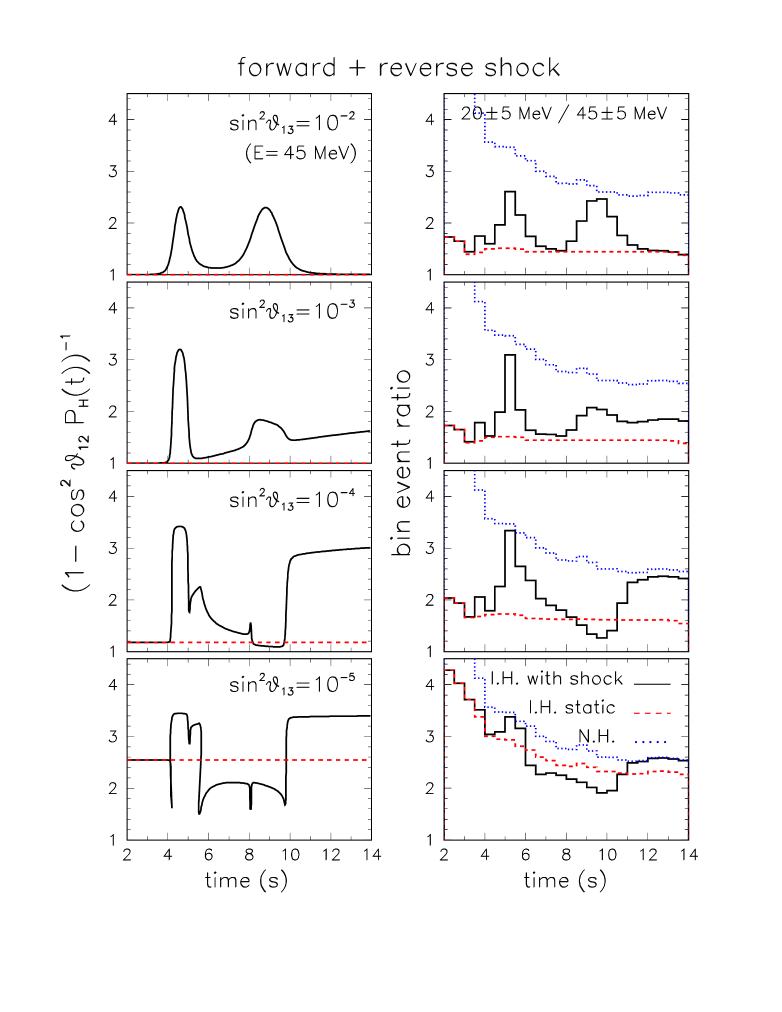
Figure 11 is analogous to Fig. 10, but for the the case of forward plus reverse shock. Despite the more complex structure of the crossing probability function, its behavior is faithfully tracked by the ratio of events shown on the right (for inverted hierarchy), except perhaps at the lowest value of shown. In any case, the main spikes and valleys of the function are clearly reproduced by the MeV event ratio, and cannot be mimicked by the very small statistical fluctuations (not shown). Of course, relations in Eqs. (19), (20), and (21) are only approximated, and this is the reason why, for example, in the case of normal hierarchy (dotted line in Figs. 10 and 11) or inverted hierarchy with static profile and (dashed line in the lower right panels of Figs. 10 and 11) the ratio does not appear constant in time.
Of course, when the next observable supernova will explode, we will not know a priori the values of and of fulfilling Eqs. (16) and (19). However, if an imprint of shock waves is seen in the absolute spectra through nonmonotonic time variations, can be found by seeking the (low) energy range where such variations are suppressed, as already mentioned. Concerning , its ignorance is not crucial to track the qualitative behavior of : histograms very similar to those shown in the right panels of Figs. 10 and 11 would be obtained by using, e.g., the MeV or MeV bin instead of MeV, up to an overall rescaling of the y-axis (not shown).
IV.3 Time spectra from interactions on oxygen and on electrons
Both and contribute to oxygen absorption events. Therefore, shock wave imprints are expected for both inverted and normal hierarchy. Figure 12 shows the time spectra of such events for both normal and inverted hierarchy, using either the static or the forward shock-wave profile for . It can be seen that, in the presence of the shock, the event decrease in time is first steepened and then flattened for both hierarchies; in the case of inverted hierarchy, there is even a small dip at 9–10 seconds. Therefore, if the time decrease of the event rate is understood from simulations or from independent experimental information, the identification of a steepening+flattening behavior in oxygen events might be taken as a signal of shock passage (in the absence of alternative explanations).
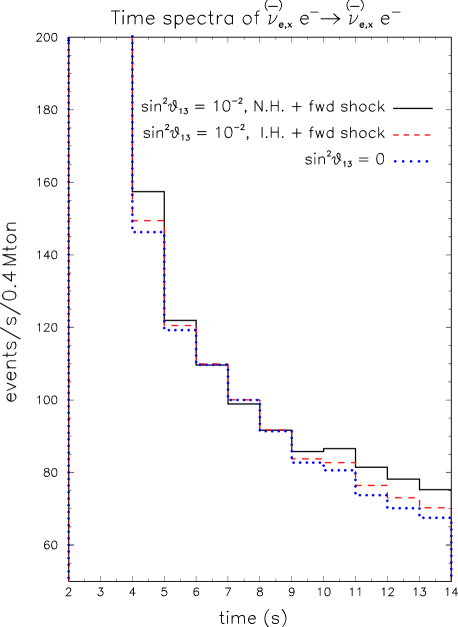
Independent experimental information on the time decrease of the (anti)neutrino flux can be gained through elastic scattering events. Since neutrinos of all flavors contribute to this sample, partial cancellation of oscillation effects occurs, as remarked in Sec. III A for the total rate in this class of events. Figure 13 shows that the partial cancellation persists also in the time spectra, i.e., there are no large variations between normal and inverted hierarchy and with or without crossing probability effects ( or 0). Therefore, the elastic scattering sample is expected to track the overall decrease of flux in time, rather independently of flavor transition effects. This “standard candle” will be useful for comparison with the oxygen and inverse beta decay sample, where shock-wave effects can instead range from moderate to strong.
V Summary and Conclusions
In this work we have analyzed the discovery potential of a 0.4 Mton water-Cherenkov detector in providing information on several time dependent and independent observables related to (extra)galactic core-collapse supernovae. We have considered elastic scattering on electrons as well as inelastic scattering on protons and on oxygen in the detector.
Concerning time independent observables, we have calculated the total number of events as a function of the distance of the exploding star for each detection channel during: a) the last pre-supernova (silicon burning) phase; b) the neutronization burst; and c) the core collapse phase. We have shown that the low energy ( MeV) thermal neutrinos emitted during the Si burning phase a couple of days before the explosion can be identified at level over typical backgrounds if the supernova is not too far ( kpc) and the detector is loaded with gadolinium. The neutronization burst ’s can be identified with a significance standard deviations if kpc. From core collapse supernovae located near to the galactic center we expect up to events from inverse beta decay events, and events coming from elastic scattering and and oxygen absorption events. At the larger distance of, e.g., the Andromeda galaxy (M31), we expect events, thus opening a possible window for near extragalactic supernova surveys.
We have shown that with the addition of gadolinium, the energy range MeV can be fully exploited to detect the supernova relic neutrino flux at the level of several standard deviations in a few years. However, even without gadolinium, the SRN background could emerge at – level after an exposure of years, if the atmospheric background is under control.
We have then studied the time spectra of events in the range s, in order to extract information on the neutrino crossing probability induced by the shock wave propagation in the stellar envelope during the cooling phase. In particular, we have considered the high statistic sample of inverse beta decay events. In this context, it is useful to introduce the concept of “critical energy” ( MeV for our reference model), where oscillation effect cancel to a large extent. In this way, the time dependence of the rate of the events in a bin around the critical energy is mainly affected by the overall decrease of the neutrino luminosity, and is almost independent from the time dependence of the probability. We have shown that the ratio between the number of events in a bin close to the critical energy ( MeV) and those in a bin centered at a significantly higher energy (e.g., MeV) can faithfully track the neutrino crossing probability (if the mass hierarchy is inverted), thus providing a “real-time” movie of shock wave effects into the stellar envelope. In particular, the case of forward shock only Schi and of forward+reverse shock Reve leave significantly different signatures in the time domain, and can thus be discriminated.
We have completed our work by considering the time dependence of the neutrino event rates from oxygen absorption and from elastic scattering. The latter are almost independent from shock and flavor transition effects, and can thus be used to monitor the overall decay of neutrino luminosity. The former (oxygen) event rate is instead sensitive to the shock wave also in the case of normal hierarchy (due to the contribution). If a “steepening-flattening” behavior is observed in the oxygen event time spectrum, it could be interpreted as an imprint of the shock wave passage, in both cases of normal and inverted hierarchy.
In conclusion, Megaton-class detectors offer unprecedented opportunities to study supernova and neutrino properties through high-statistics studies of energy and time spectra of supernova neutrino events from different interaction channels. Directions for further studies may include detector simulations of the statistical separation between such channels, more refined calculations of the oxygen absorption differential cross section, improved numerical simulations of supernova explosion and shock-wave behavior, a better understanding of the unoscillated neutrino spectra in time and energy (and of their associated uncertainties), and an accurate characterization of the atmospheric and reactor background in supernova relic neutrino searches.
Acknowledgements.
We wish to thank J. Beacom and M. Vagins for very useful discussions about the “GADZOOKS!” proposal for gadolinium loaded water-Cherenkov detectors; T. Montaruli and G. Battistoni for providing us the low energy fluxes of atmospheric neutrinos; P. Hernandez and M. Mezzetto for discussions about the Fréjus project; and M. Nakahata and R. Tomàs for useful comments on the manuscript. A.M. thanks C. Volpe for the kind invitation to the International Workshop on “Exploring the Impact of New Neutrino Beams” (Trento, Italy, 2004). We also acknowledge fruitful discussions with several participants at the conference Neutrino 2004 (Paris, France, 2004) and at the Neutrino Oscillation Workshop (Otranto, Italy, 2004). This work is supported in part by the Italian “Istituto Nazionale di Fisica Nucleare” (INFN) and by the “Ministero dell’Istruzione, Università e Ricerca” (MIUR) through the “Astroparticle Physics” research project.References
- (1) M. Koshiba, “Birth of neutrino astrophysics,” Rev. Mod. Phys. 75, 1011 (2003).
- (2) Super-Kamiokande Collaboration, Y. Fukuda et al., Nucl. Instr. Meth. A 501, 418 (2003).
- (3) M. Koshiba, Phys. Rept. 220, 229 (1992).
- (4) UNO official homepage: ale.physics.sunysb.edu
- (5) C.K. Jung, in the Proceedings of NNN’99, International Workshop on Next generation Nucleon decay and Neutrino detector (SUNY at Stony Brook, NY, 1999), edited by M.V. Diwan and C.K. Jung (AIP Conference Proceedings, Melville NY, 2000), Vol. 533; hep-ex/0005046.
- (6) K. Nakamura, Int. J. Mod. Phys. A 18, 4053 (2003).
- (7) L. Mosca, talk at the Villars CERN/SPSC Meeting (Villars, Switzerland, 2004), available at nuspp.in2p3.fr/Frejus
- (8) C.K. Jung, talk at Neutrino 2004, 21st International Conference on Neutrino Physics and Astrophysics. Website: neutrino2004.in2p3.fr
- (9) Super-Kamiokande Collaboration, M. Malek et al., Phys. Rev. Lett. 90, 061101 (2003).
- (10) C. Lunardini and A.Yu. Smirnov, J. Cosmol. Astropart. Phys. 06, 009 (2003).
- (11) V. Barger, D. Marfatia, and B.P. Wood, Phys. Lett. B 547, 37 (2002).
- (12) H. Minakata, H. Nunokawa, R. Tomàs, and J.W.F. Valle, Phys. Lett. B 542, 239 (1992).
- (13) A.S. Dighe, M. Kachelrieß, G.G. Raffelt, and R. Tomàs, J. Cosmol. Astropart. Phys. 01, 004 (2004).
- (14) UNO White Paper, available at UNNO .
- (15) S. Ando, Phys. Rev. D 70, 033004 (2004).
- (16) R. Tomàs, M. Kachelrieß, G. Raffelt, A. Dighe, H.T. Janka, and L. Scheck, J. Cosmol. Astropart. Phys. 09, 015 (2004).
- (17) R. Tomàs, D. Semikoz, G.G. Raffelt, M. Kachelrieß, and A.S. Dighe, Phys. Rev. D 68, 093013 (2003).
- (18) J.F. Beacom and M.R. Vagins, Phys. Rev. Lett. 93, 171101 (2004).
- (19) S. Ando and K. Sato, New J. Phys. 6, 170 (2004).
- (20) D.B. Cline, F. Sergiampietri, J.G. Learned, K. McDonald, Nucl. Instr. Meth. A 503, 136 (2003).
- (21) I. Gil-Botella and A. Rubbia, J. Cosmol. Astropart. Phys. 10, 009 (2003); ibidem 08, 001 (2004).
- (22) A.G. Cocco, A. Ereditato, G. Fiorillo, G. Mangano, and V. Pettorino, J. Cosmol. Astropart. Phys. 12, 002 (2004).
- (23) L. Bartoszek et al., Letter of Intent for Fermilab Liquid ARgon Experiments (FLARE), hep-ex/0408121.
- (24) V. Barger, P. Huber, and D. Marfatia, hep-ph/0501184.
- (25) A.S. Dighe and A.Yu. Smirnov, Phys. Rev. D 62, 033007 (2000).
- (26) A. Dighe, talk at Neutrino 2004 Nu04 .
- (27) T. Totani, K. Sato, H.E. Dalhed, and J.R. Wilson, Astrophys. J. 496, 216 (1998).
- (28) R.C. Schirato and G.M. Fuller, astro-ph/0205390.
- (29) Shock-wave simulations by J.R. Wilson and H.E. Dahled, as quoted in Schi .
- (30) A. Odrzywolek, M. Misiaszek, and M. Kutschera, Astropart. Phys. 21, 303 (2004); Acta Phys. Polon. B 35, 1981 (2004).
- (31) S.E. Woosley, A. Heger, and T.A. Weaver, Rev. Mod. Phys. 74, 1015 (2002).
- (32) M.T. Keil, G.G. Raffelt, and H.T. Janka, Astrophys. J. 590 (2003), 971.
- (33) R. Buras, H.T. Janka, M.T. Keil, G.G. Raffelt and M. Rampp, Astrophys. J. 587 (2003) 320.
- (34) G.L. Fogli, E. Lisi, D. Montanino, and A. Palazzo, Phys. Rev. D 65, 073008 (2002); Erratum 66, 039901 (2002).
- (35) KamLAND Collaboration, T. Araki et al., hep-ex/0406035, to appear in Phys. Rev. Lett. (2005).
- (36) L. Wolfenstein, Phys. Rev. D 17, 2369 (1978); S.P. Mikheev and A.Yu. Smirnov, Yad. Fiz. 42, 1441 (1985) [Sov. J. Nucl. Phys. 42, 913 (1985)].
- (37) Super-Kamiokande Collaboration, Y. Ashie et al., Phys. Rev. Lett. 93, 101801 (2004); K2K Collaboration, M.H. Ahn et al., Phys. Rev. Lett. 90, 041801 (2003).
- (38) CHOOZ Collaboration, M. Apollonio et al., Eur. Phys. J. C 27, 331 (2003).
- (39) G.L. Fogli, E. Lisi, A. Mirizzi, and D. Montanino, Phys. Rev. D 68, 033005 (2003).
- (40) S.T. Petcov, Phys. Lett. B 200, 373 (1988).
- (41) A. Strumia and F. Vissani, Phys. Lett. B 564, 42 (2003). Their cross-section calculation improves upon earlier results by P. Vogel and J.F. Beacom, Phys. Rev. D 60, 053003 (1999); P. Vogel, Prog. Part. Nucl. Phys. 48, 29 (2002).
- (42) E. Kolbe, K. Langanke, and P. Vogel, Phys. Rev. D 66, 013007 (2002); see also W.C. Haxton, Phys. Rev. D 36, 2283 (1987).
- (43) Y. Suzuki, Talk at the 2004 Nobel Symposium on Neutrino Physics (Enköping, Sweden, 2004). Website: www.physics.kth.se/nobel2004
- (44) R.B. Tully, Nearby Galaxy Catalog (Cambridge University Press, Cambridge, UK, 1988).
- (45) E. Cappellaro, R. Evans, and M. Turatto, Astron. Astrophys. 351, 459 (1999); V. Pavlidou and B.D. Fields, Astrophys. J. 558, 63 (2001) (see Table I and related references therein); F. Mannucci et al., astro-ph/0411450, to appear in Astron. Astrophys. (2005).
- (46) L.E. Strigari, J.F. Beacom, T.P. Walker, and P. Zhang, astro-ph/0502150.
- (47) GALEX Collaboration, D. Schiminovic et al., Astrophys. J. 619, L47 (2005).
- (48) G.L. Fogli, E. Lisi, A. Mirizzi, and D. Montanino, Phys. Rev. D 70, 013001 (2004).
- (49) FLUKA Atmospheric Neutrino Fluxes, available at: www.mi.infn.it/∼battist/neutrino.html
- (50) V.I. Kopeikin, L.A. Mikaelian, and V.V. Sinev, Yad. Fiz. 60, 230 (1997) [Phys. Atom. Nucl. 60, 172 (1997)].
- (51) J. Beacom, private communication.