Scenarios for multiplicity distributions in collisions in the TeV energy region
Abstract
Possible scenarios based on available experimental data and phenomenological knowledge of the GeV energy region are extended to the TeV energy region in the framework of the weighted superposition mechanism of soft and semi-hard events. KNO scaling violations, forward-backward multiplicity correlations, vs. oscillations and shoulder structures are discussed.
1 Introduction
Given the current difficulty of performing QCD calculations in the realm of multiparticle dynamics, one possible alternative path consists in studying the features of hadronic final states as obtained in collision experiments. The main motivation is the conviction that the complex structures which we observe might very well be simple at the origin, and that such initial simplicity manifests itself in terms of regularities in final particle multiplicity distributions (MD’s).
Indeed, the Pascal regularity [1] appeared very soon: that final charged particle MD’s were well described by the negative binomial (NB), also known as Pascal, distribution was discovered first in cosmic rays observations [2] in the ’60, and later confirmed in the 5–100 GeV energy range in collisions and up to 40 GeV in annihilations, as well as in other types of collisions (see, e.g., [3].)
The NB (Pascal) distribution is a two-parameter distribution:
| (1) |
where is the average multiplicity and measures the deviation of the variance from the Poisson shape:
| (2) |
In fact, for the Poisson distribution , i.e., , and for the geometric distribution , i.e., .
That different reactions showed the same, approximate, regularity was worth of interpretation attempts. Probably the most successful of such attempt has been clan structure analysis [4]. ‘Clan’ (recalling the Scottish sense of the word) refers to a group of particles of common ancestry: clans are by definition independently produced in a number which follows the Poisson MD, each clan contains at least one particle by assumption and all correlations are exhausted within each clan. Clan ancestors, after their production, generate additional particles via cascading, according to a logarithmic multiplicity distribution.
The two relevant parameters in clan structure analysis are the average number of clans, , and the average number of particles per clan, . They are linked to the standard NB (Pascal) parameters and by the following non-trivial relations
| (3) |
Clan structure analysis reveals new interesting properties when applied to above mentioned collisions. In particular it is shown that in there are more clans than collisions, whereas each clan is much smaller. In addition, clans in central rapidity intervals are larger than in more peripheral intervals. The deep inelastic case is intermediate between the previous ones: clans are less numerous than in annihilation and hadronic in character, but the clan size tends to be leptonic.

As soon as the c.m. energy increased, more detailed structures appeared in the data: the MD was seen to have a ‘shoulder structure’ in the intermediate multiplicity range, first in collisions [6] and later also in annihilation [7]. In both cases an explanation was found in terms of the weighted superposition of different classes of events: events with and without mini-jets in the case of collisions (called ‘semi-hard’ and ‘soft’, respectively; see Figure 1), events with a fixed number of jets in annihilation [8]. It should be stressed here that the MD of each class was again well described by the Pascal distribution (which could not, of course, by itself alone reproduce the shoulder structure). The degree of precision of such a description is witnessed by the fact that not only the overall shape is visibly reproduced, but also the quasi-oscillatory behaviour of the so-called moments (defined as the ratio of factorial cumulant moments of order to factorial moments of the same order, ), which show sign changes when plotted as a function of the order [9].
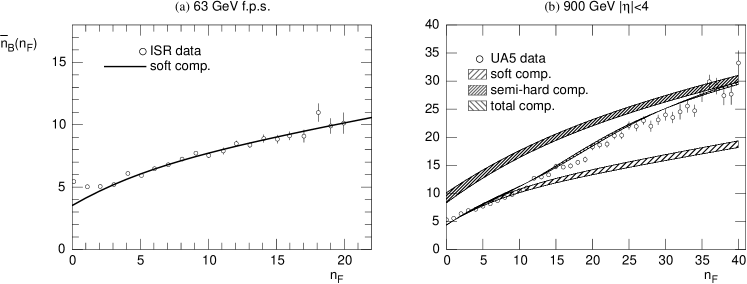
Finally, a third observable was brought into play, with different characteristic behaviour in annihilation and collisions, but which can be understood in terms of the Pascal regularity and clan structure analysis: the strength of forward-backward multiplicity correlations [10]. In particular, it was shown that in annihilation the superposition mechanism is sufficient by itself to account for the small amount of forward-backward multiplicity correlations (FBMC) present in the data, consistently with the idea of a large number of small clans; on the other hand, the superposition was not enough in collisions (Figure 2): it is required that particle be produced in sizeable groups (clans!) which are not localised in phase-space, i.e., clans must produce particles in both hemispheres (in other words, there must be a non-zero ‘leakage’: there are particles going backwards from forward-emitted clans, and vice versa.)
2 Extrapolations to higher energies
We will now abandon the parallelism with annihilation, and in the following concentrate on and collisions. The knowledge from the GeV energy range, summarised briefly in the previous section, will now be employed to extrapolate the MD’s in the TeV energy region [11, 12], i.e., the region covered by Tevatron and LHC colliders.
The main equation of the extrapolation is the following:
| (4) |
where is the fraction of ‘soft’ events in the total sample. An event is declared ‘soft’ if it contains no mini-jets: there is some ambiguity as to the threshold which defines a mini-jet, e.g., a calorimetric tower of a few GeV, but a small variation of this threshold does not result in a wild variation of each class’ parameters. On the other hand, a proper definition of what is “hard” and what is “soft” is an extremely interesting task on itself, but it goes well beyond the scope of this paper.
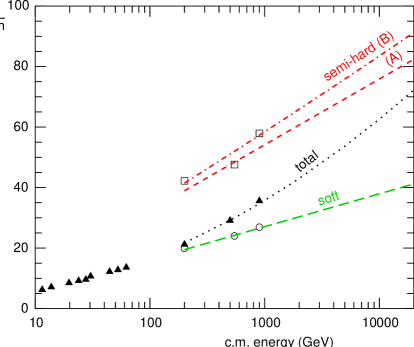
The basic assumptions to be used in the extrapolation are as follows (see Figure 4):
-
1.
the average charged multiplicity in the total sample grows with the logarithm of the c.m. energy (best fit to available data);
-
2.
in agreement with the findings at ISR, where one component gives an adequate description of the data, the growth of the average charged multiplicity in the soft sample is proportional to .
-
3.
in agreement with UA1 findings at SpS, the average multiplicity in the semi-hard sample is twice as large as in the soft one, but a very small term quadratic in could be added as a correction (the two possibilities are called A and B in the figures). Accordingly, most, if not all, of the behaviour of comes from the increase in the mini-jet production cross section.
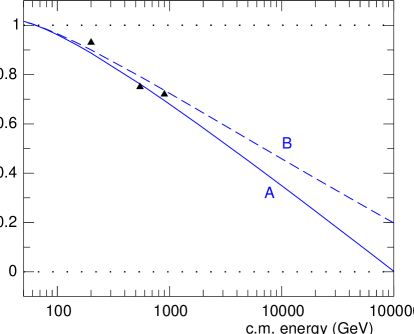
One now has enough information to compute the expected energy dependence of the weight :
| (5) |
which is shown in Figure 4.
We come now to the behaviour of . was found to be constant in the GeV region by the UA5 collaboration; together with the mentioned behaviour of this implies that KNO scaling behaviour is valid for the soft component in the TeV region:
| (6) |
We stay with this assumption on .
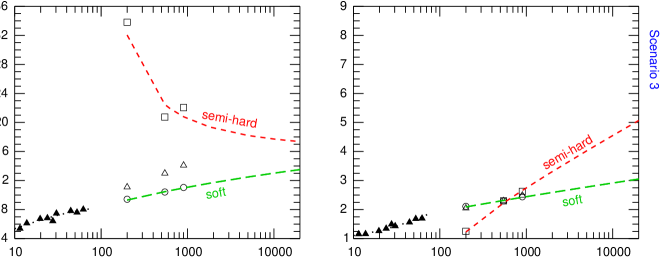
As the data on the semi-hard component are scarce, it was decided to explore three different scenarios for the energy behaviour of , summarised, together with the average number of clans and the average number of particles per clan, in Figures 5-7.
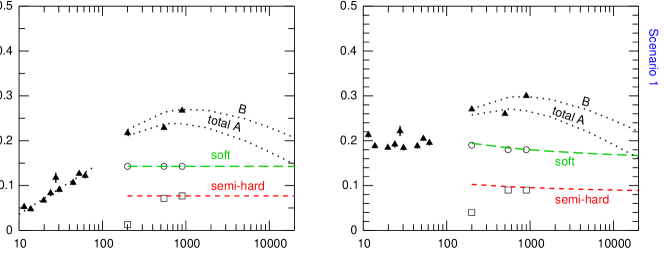
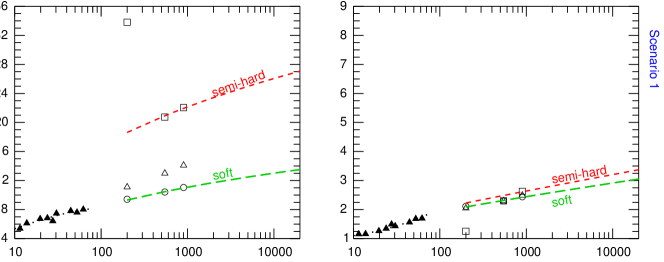
Scenario 1 (Figure 5)
In this scenario we assume that KNO scaling holds also for the semi-hard component, i.e., that is constant. This leads to a slow increase of the average number of clans and of the average number of particles per clan.
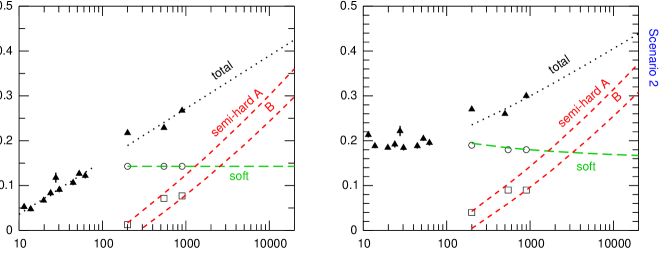
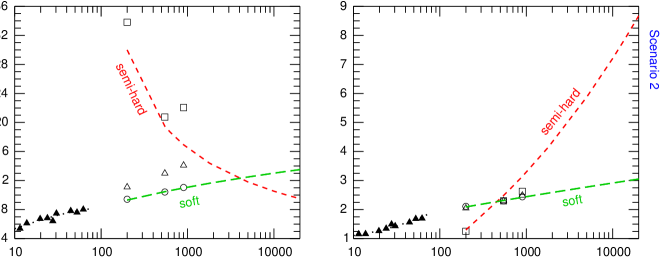
Scenario 2 (Figure 6)
Here we test the assumption of maximum KNO scaling violation, by assuming that the growth continues in the TeV region. One notices that this scenario implies a fast decrease with increasing energy of the average number of clans, a fact which is quite unusual and interesting, and is explored further in these proceedings [13].
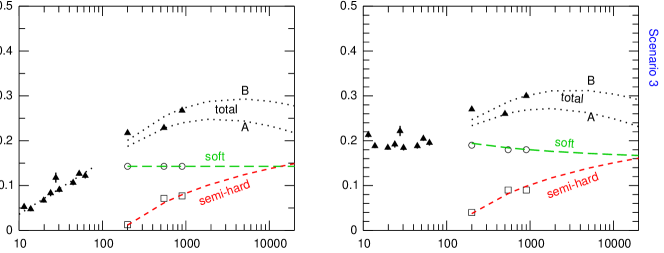
Scenario 3 (Figure 7)
In this scenario we transport the QCD-predicted (at leading log level) behaviour to fit the low energy data: . It corresponds to an increase, slower than in scenario 2, toward an asymptotic constant value, i.e., toward a MD which is asymptotically KNO scaling. From the point of view of clan analysis, this scenario is intermediate between 1 and 2, and shows again a decrease in with increasing ( will start to increase again in the KNO scaling regime, due to the increase of .)
3 Extension to small rapidity intervals
In going from full phase-space (FPS) to pseudo-rapidity () intervals, our main concern is to be consistent with the scenarios explored in FPS and extend them. It should be pointed out that by assuming only a longitudinal growth of phase space and constant height of the rapidity plateau with c.m. energy for semi-hard events, as done in Ref. [12], CDF data [14] in pseudo-rapidity intervals are underestimated. These data are well described by allowing a growth of the total rapidity plateau: from this consideration one deduces a more appropriate growth of the semi-hard plateau height; the constraint is that in full phase space follows a logarithmic growth with as discussed above (curves B). Predicted charged particle multiplicity distributions in the three scenarios of the two-component model for the interval at Tevatron and LHC energies, calculated for the last mentioned case, are shown in Fig. 9 (notice that a direct comparison with CDF data, in view of the relatively large value of their resolution GeV/, is questionable). If this behaviour for the semi-hard component will be confirmed by data one should conclude that semi-hard events populate mainly the central rapidity region giving an important contribution to the increase of charged particle density in central rapidity intervals.


| \br | FPS | % | ||||
| \mr | soft | 42 | 40 | 7 | 13.3 | 3.0 |
| semi-hard | 58 | 87 | 3.7 | 11.8 | 7.4 | |
| \br | % | |||||
| \mr | soft | 42 | \04.9 | 3.4 | 3.0 | 1.6 |
| semi-hard | 58 | 14 | 2.0 | 4.2 | 3.4 | |
| \br |
| \br | FB corr. strength | FPS | |
|---|---|---|---|
| \mr | soft | 0.41 | 0.25 |
| semi-hard | 0.51 | 0.45 | |
| total (weighted) | 0.98 | 0.92 | |
| \br |
4 Fermilab results
Two sets of data are available from Tevatron: the E735 Collaboration [15] gives full phase-space results, from data measured in and GeV/ and then extended via a Monte Carlo program, which do not completely agree with those obtained at comparable energies at the SpS collider, as shown in Figure 8 (left panel); Tevatron data are more precise than SpS data at larger multiplicities (they have larger statistics and extend to larger multiplicities than UA5 data), but much less precise at low multiplicity. Both sets of data show a shoulder structure, but the Tevatron MD is somewhat wider. As seen from the same Figure 8 (right panel), scenario 2 is the one that come closer to these data.
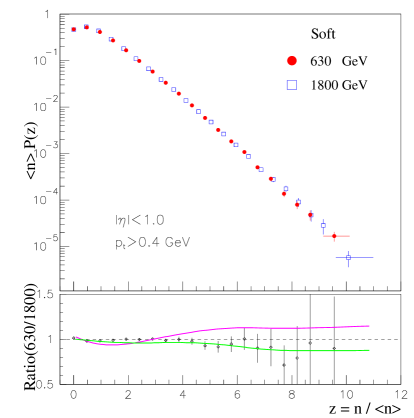
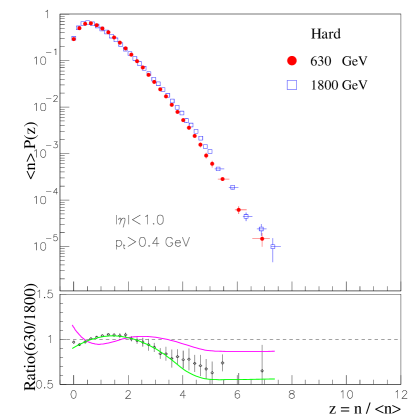
The second set of data comes from CDF [16] for charged particles in and GeV/: it was found that by subdividing the minimum bias sample into two groups, characterised respectively by the absence (‘soft’ events) or the presence (‘hard’ events) of mini-jets, interesting features of the reaction can be investigated. More precisely, a ‘hard’ event has been defined as an event with at least one calorimeter cluster in , a cluster being defined as a seed calorimeter tower with at least 1 GeV transverse energy plus at least one contiguous tower with GeV. A subdivision which is interesting per se and can be tested at 14 TeV. In summary, the soft component is found to satisfy KNO scaling (as expected in our scenarios), while the hard one does not (in disagreement with scenario 1, but in agreement with scenarios 2 and 3); also the distribution scales at fixed multiplicity in the soft component and not in the hard one; the dispersion of vs. the inverse of the multiplicity is compatible with an extrapolation to 0 as in the soft component but not in the hard one, indicating in this limit a lack of correlations in the soft component.
5 Conclusions
The weighted superposition mechanism of two NB (Pascal) MD’s describes not only MD and oscillations, but also forward-backward multiplicity correlations in and collisions and annihilations. In hadronic collisions, the two components were found to correspond to soft events (without mini-jets) and to semi-hard events (with mini-jets) respectively. Based on this mechanism, the knowledge of the features of MD’s up to 900 GeV c.m. energy has been used to predict the characteristic behaviour expected in the TeV energy range: the soft component satisfies KNO scaling, while the semi-hard one violates it strongly. These predictions do not disagree with the successive findings at Tevatron. In terms of clan structure analysis, a peculiar behaviour was found: particles in the semi-hard component tend to aggregate forming few, large clans. This behaviour, and its consequences for the LHC experiments, will be investigated further in A. Giovannini’s contribution to these proceedings [13].
References
References
- [1] Giovannini A and Ugoccioni R 2004 Clan structure analysis and qcd parton showers in multiparticle dynamics. An intriguing dialog between theory and experiment Preprint DFTT 12/2004, hep-ph/0405251
- [2] MacKeown P K and Wolfendale A W 1966 Proc. Phys. Soc. 89 553
- [3] Giacomelli G and Jacob M 1979 Physics Reports 55 1 \nonumAdamus M et al 1986 Phys. Lett. B 177 239 \nonumDerrick M et al 1986 Phys. Lett. B 168 299 \nonumArneodo M et al 1987 Z. Phys. C 35 335
- [4] Van Hove L and Giovannini A 1987 XVII International Symposium on Multiparticle Dynamics ed M Markitan et al (Singapore: World Scientific) p 561 \nonumGiovannini A and Van Hove L 1988 Acta Phys. Pol. B 19 495
- [5] Fuglesang C 1990 Multiparticle Dynamics: Festschrift for Léon Van Hove ed A Giovannini and W Kittel (Singapore: World Scientific) p 193
- [6] Ansorge R E et al 1989 Z. Phys. C 43 357
- [7] Abreu P et al 1991 Z. Phys. C 50 185
- [8] Abreu P et al 1991 Z. Phys. C 52 271
- [9] Ugoccioni R, Giovannini A and Lupia S 1995 Phys. Lett. B 342 387
- [10] Giovannini A and Ugoccioni R 2002 Phys. Rev. D 66 034001
- [11] Giovannini A and Ugoccioni R 1999 Phys. Rev. D 59 094020
- [12] Giovannini A and Ugoccioni R 1999 Phys. Rev. D 60 074027
- [13] Giovannini A these proceedings
- [14] Abe F et al Phys. Rev. D 41 2330
- [15] Alexopoulos T et al 1998 Phys. Lett. B 435 453
- [16] Acosta D et al 2002 Phys. Rev. D 65 072005