Evidence for Dark Matter Annihilation from Galactic Gamma Rays?
Abstract
The diffuse galactic EGRET gamma ray data show a clear excess for energies above 1 GeV in comparison with the expectations from conventional galactic models. The excess is seen with the same spectrum in all sky directions, as expected for Dark Matter (DM) annihilation. This hypothesis is investigated in detail. The energy spectrum of the excess is used to limit the WIMP mass to the 50-100 GeV range, while the skymaps are used to determine the halo structure, which is consistent with a triaxial isothermal halo with additional enhancement of Dark Matter in the disc. The latter is strongly correlated with the ring of stars around our galaxy at a distance of 14 kpc, thought to originate from the tidal disruption of a dwarf galaxy. It is shown that this ring of DM with a mass of causes the mysterious change of slope in the rotation curve at and the large local surface density of the disc. The total mass of the halo is determined to be . A cuspy profile is definitely excluded to describe the gamma ray data. These signals of Dark Matter Annihilation are compatible with Supersymmetry for boost factors of 20 upwards and have a statistical significance of more than in comparison with the conventional galactic model. The latter combined with all features mentioned above provides an intriguing hint that the EGRET excess is indeed a signal from Dark Matter Annihilation.
keywords:
Cold Dark Matter , Indirect Dark Matter Detection , Galactic Gamma Rays , Neutralinos , Supersymmetry , Halo Profile , EGRET Diffuse Gamma Rays1 Introduction
Cold Dark Matter (CDM) makes up 23% of the energy of the universe, as deduced from the WMAP measurements of the temperature anisotropies in the Cosmic Microwave Background, in combination with data on the Hubble expansion and the density fluctuations in the universe [1]. The nature of the CDM is unknown, but one of the most popular explanation for it is the neutralino, a stable neutral particle predicted by Supersymmetry [2, 3]. The neutralinos are spin 1/2 Majorana particles, which can annihilate into pairs of Standard Model (SM) particles. The stable decay and fragmentation products are neutrinos, photons, protons, antiprotons, electrons and positrons. From these, the protons and electrons disappear in the sea of many matter particles in the universe, but the photons and antimatter particles may be detectable above the background, generated by particle interactions. Such searches for indirect Dark Matter detection have been actively pursued, see e.g the review by Bergstrm[4] or more recently by Bertone, Hooper and Silk [5]. In a previous paper we studied the Dark Matter Annihilation (DMA) yield of positrons, antiprotons and gamma rays from the center of the Galaxy using the cuspy NFW halo profile expected from N-body simulations[6]. It was found that the DMA contribution to all three channels could be well described by the data for an annihilation cross section determined from the WMAP measurement of the relic density and using a simple propagation model. In this paper we extend this analysis to include gamma rays from all sky directions. Gamma rays have the advantage that they point back to the source and do not suffer energy losses, so they are the ideal candidates to trace the dark matter density, if one assumes the boost factor, representing local density fluctuations of the DM, to be similar in all directions. The charged components interact with galactic matter and scatter on magnetic turbulences, so they do not point back to the source. They can only be studied by including the DM as a source function in the standard galactic propagation model as implemented in the GALPROP code[7]. This has been done, but its discussion is outside the scope of the present paper. The present analysis on diffuse galactic gamma rays differs from previous ones (see e.g. [8]) by considering simultaneously the complete sky map and the energy spectrum, which allows us to constrain both the halo distribution and the WIMP mass. The constraint on the WIMP annihilation cross section from WMAP is discussed in Section 2, while the constraints on the mass and the DM halo profile from the EGRET excess are discussed in Sections 3 and 4. The compatibility of the results with Supersymmetry is discussed in Section 5 and the summary is given in Section 6.
2 Annihilation Cross section Constraints from WMAP
In the early universe all particles were produced abundantly and were in thermal equilibrium through annihilation and production processes. The time evolution of the number density of the particles is given by the Boltzmann equation, which can be written for WIMPS, denoted by , as:
| (1) |
where H is the Hubble expansion rate, is the actual number density, is the thermal equilibrium number density, is thermally averaged value of the total annihilation cross section times the relative velocity of the annihilating neutralinos. The Hubble term takes care of the decrease in number density because of the expansion, while the first term on the right hand side represents the decrease due to annihilation and the second term represents the increase through creation by the inverse reactions.
At temperatures below the mass of the WIMP’s the number density drops exponentially. The annihilation rate drops exponentially as well, and if it drops below the expansion rate, the WIMP’s cease to annihilate. They fall out of equilibrium (freeze-out) at a temperature of about [9] and a relic cosmic abundance remains.
For the case that is energy independent, which is a good approximation in case there is no coannihilation, the present mass density in units of the critical density is given by [3]:
| (2) |
One observes that the present relic density is inversely proportional to the annihilation cross section at the time of freeze out, a result independent of the WIMP mass (except for logarithmic corrections). For the present value of the thermally averaged total cross section at the freeze-out temperature of must have been around . All possible enhancements (boost factors) of the annihilation rate will be calculated with respect to this generic cross section, which basically only depends on the value of the Hubble constant in absence of resonances and if coannihilation with other particles can be neglected.
| Region | Longitude | Latitude | Description |
|---|---|---|---|
| A | 330-30 | 0-5 | Inner Galaxy |
| B | 30-330 | 0-5 | Galactic disc without inner Galaxy |
| C | 90-270 | 0-10 | Outer Galaxy |
| D | 0-360 | 10-20 | low longitude |
| E | 0-360 | 20-60 | high longitude |
| F | 0-360 | 60-90 | Galactic Poles |

3 Global Fits to the spectral shape of the diffuse gamma rays
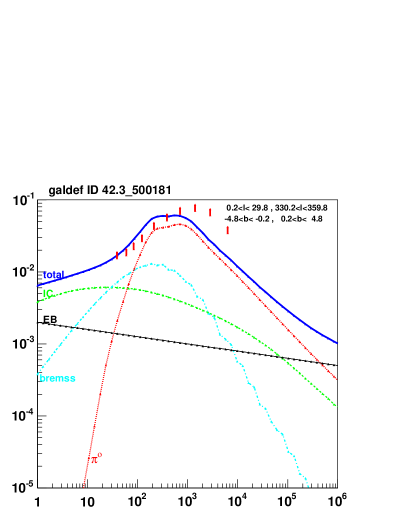
Galactic gamma ray have been extensively studied during the nine years of data taking by the EGRET satellite on the Compton Gamma Ray Observatory. These data show a clear excess of diffuse gamma rays above the background from conventional galactic sources for energies above 1 GeV[10], as shown on the left hand side of Fig. 1.
Of course there are also many sources of diffuse gamma rays in the galaxy, so disentangling the annihilation signal is at first glance not easy. The main sources of conventional background are: a) decays from mesons produced in nuclear interactions (mainly inelastic proton-proton or p-He collisions); b) inverse Compton scattering of electrons on photons (e.g. from star light or cosmic microwave background); c) Bremsstrahlung from electrons. WIMP’s are expected to annihilate in fermion-antifermion pairs, so a large fraction will annihilate into quark pairs, which produce typically 30-40 photons per annihilation in the fragmentation process (mainly from decays as in nuclear interactions). However, the photons from DMA are expected to have a significantly different spectrum than the ones from nuclear interactions. This can be easily seen as follows: the WIMP’s are strongly non-relativistic, so they annihilate almost at rest. Therefore the quarks from DMA are almost mono-energetic with an energy approximately equal to the WIMP mass. This results in a rather energetic spectrum with a sharp cut-off of the photons at twice the WIMP mass. Such a spectrum deviates considerably from the photons from nuclear interactions, which peaks at 70 MeV and falls off according to a power law. This difference allows one to fit simultaneously only the shapes of the spectra from background and DMA, thus treating the absolute normalizations as free parameters, which is an advantage, since the shapes of the spectra are much better known than the absolute fluxes.
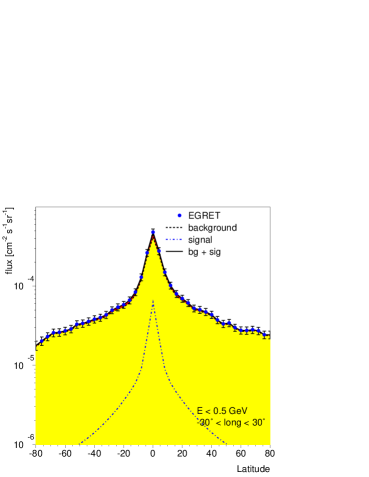
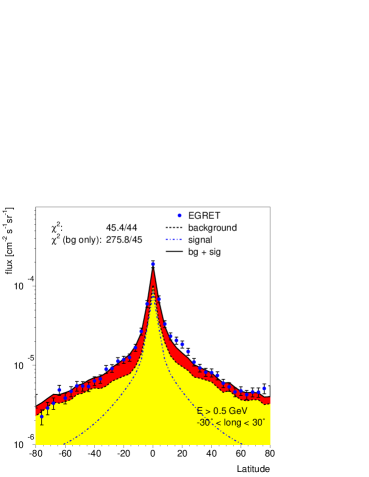
The left hand side of Fig. 1 shows the diffuse gamma ray data in region A together with the data from the background processes. The sum of these contributions is shown by the solid line and clearly fails to describe the EGRET data, shown by the points with vertical error bars. Providing a better fit to the data without assuming DMA requires a harder proton spectrum. However, this is constrained by the number of antiprotons. Leaving both the electron spectrum and proton spectrum free, i.e. assuming that the averaged spectra in our Galaxy can be different from the locally measured spectra, allows a reasonable description of all data[10]. In this so-called optimized model the locally measured proton (electron) spectrum is about a factor 2(4) below the averaged galactic one. As an alternative, we have been investigating if Dark Matter annihilation can be responsible for the excess. The fit to the EGRET data including DMA is shown on the right hand side of Fig. 1 for a WIMP mass of 90 GeV. The shape of the background is taken from the GALPROP program, which provides a detailed simulation of our galaxy[7]. The shape of the DMA curve was taken from the DarkSusy program[11], which uses the Pythia program[12] for the fragmentation of the quarks. Although DarkSusy uses the supersymmetric neutralinos as WIMP’s, the shape of the curve is generic for any WIMP annihilating at rest into quark pairs, which fragment according to the LUND string model[12]. This model has been well tested in many reactions and the small differences between different quark flavours can be compensated by a different WIMP mass. The EGRET excess up to 120 GeV is well described by the contribution from DMA. Here data for energies between 10 and 120 GeV (last three data points) were included[10]. The EGRET data have only been calibrated up to 10 GeV in a test beam and the extrapolation to higher energies would require a detailed Monte Carlo simulation for the backsplash between calorimeter and veto counters, which has not yet been done. The more reliable data below 10 GeV yields a slightly lower WIMP mass of 50 GeV. The range 50 to 90 GeV is acceptable for all fits and can be used to estimate the uncertainty in the WIMP mass, for which 70 GeV is used. It should be noted that in Supersymmetry the dominant annihilation mode is into quarks pairs[6], which are known to have a hard fragmentation function. Annihilation e.g. into yields a softer gamma spectrum, which can be compensated by a heavier WIMP mass (about 30 GeV heavier), so the WIMP mass range given above should be considered a lower limit.
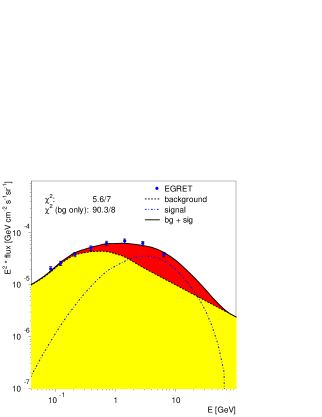
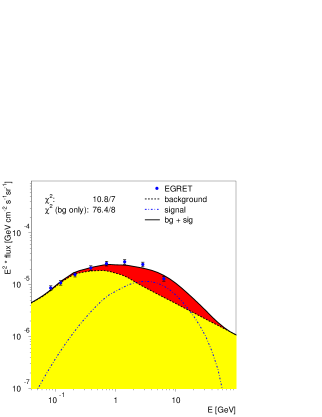
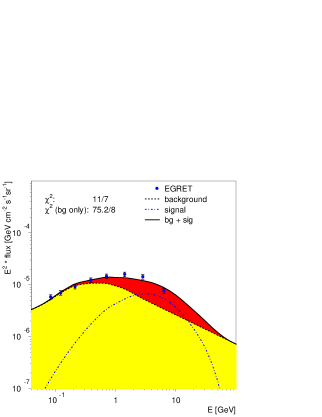
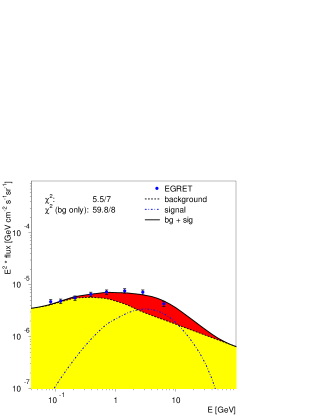
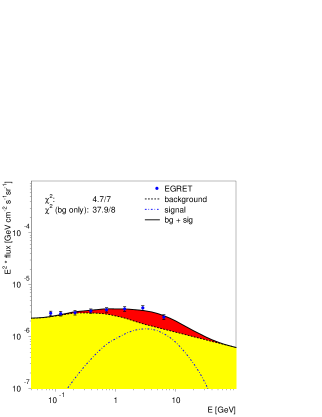
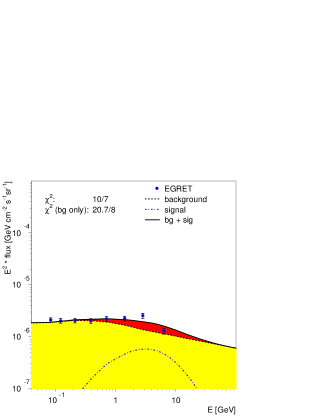
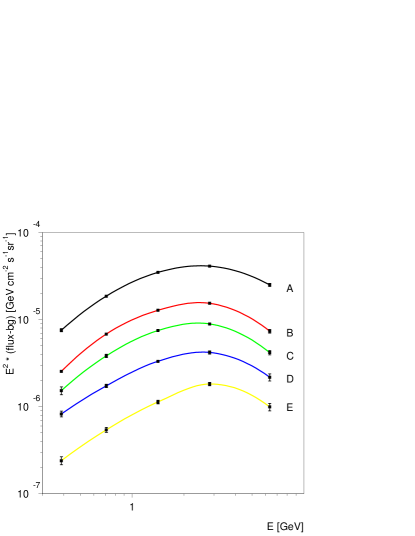
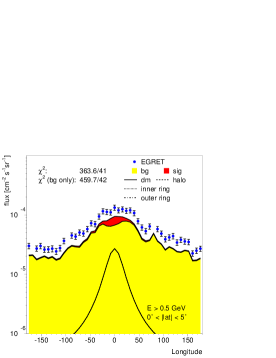
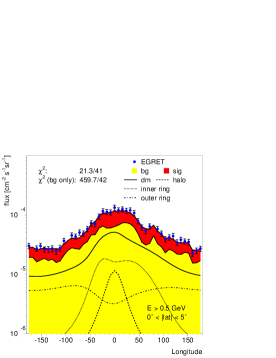
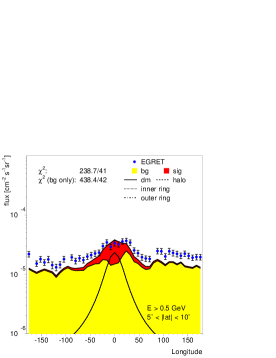
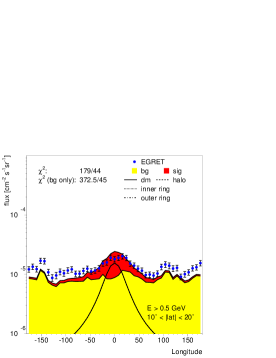
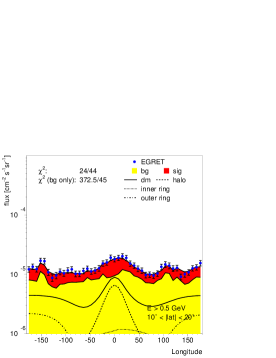
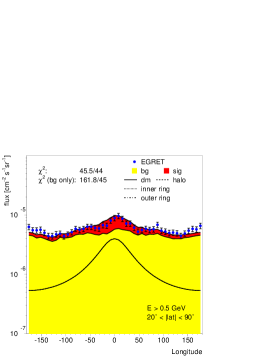
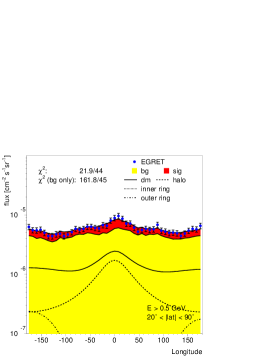
The excess is observed in all sky directions with the same spectral shape, as shown in Fig. 2 for the sky regions tabulated in Table 1). The same spectrum in all sky directions is the hall mark of DMA and practically excludes the possibility that the excess originates from unknown point sources, especially since most point sources have a much softer spectrum than the observed high energy excess. Including all the known point sources in the analysis does not change the results in any significant way. E.g. the many sources in the direction of the galactic center increase the gamma ray flux in that direction by less than 20%, which only changes the normalization factor somewhat, but the shape of the spectrum is hardly changed for the large angular regions considered here. Only the statistical errors have been plotted in Fig. 2, since the common normalization error would only shift the whole curve without changing its shape. The largest excess comes from the galactic centre (region A), but at large latitudes (regions D and E) there exists still a strong signal, as expected from DMA. The contributions from background and signal in the various regions are shown in Fig. 3. Excellent fits with free normalizations of DMA signal and background are obtained for all regions. The DMA signal contributes differently for the different sky directions, as expected from the fact that the halo profile has a maximum towards the centre and the annihilation rate is proportional to the DM density squared. Various proposed shapes of halo profiles will be discussed in the next section followed by a determination of the halo parameters.
4 Halo Profiles
A survey of the optical rotation curves of 400 galaxies shows that the halo distributions of most of them can be fitted either with the Navarro-Frank-White (NFW) or the pseudo-isothermal profile[13]. The halo profiles can be parametrized as follows:
where is a scale radius and the slopes , and can be thought of as the radial dependence at , and , respectively. The spherical profile can be somewhat flattened in two directions to form a triaxial halo. N-body simulations suggest that the ratio of the short (intermediate) axis to the major axis is typically above 0.5 (0.7)[14, 15].
The cuspy NFW profile[16] is defined by =(1,3,1) for a scale kpc, while the Moore profile with is even more cuspy[17]. The isothermal profile with =(2,2,0) has no cusp (), but a core which is taken to be the size of the inner galaxy, i.e. kpc and implies a flat rotation curve. There are several issues concerning the distribution of dark matter in the galaxies:
-
•
The NFW profile shows a strong increase in density near the center of the universe (). However, the density profile in the inner parts of dwarf galaxies and the rotation curves of low surface brightness galaxies (LSB), which presumably consists largely of dark matter, point to a flat density profile near the center[18], although cuspy NFW profiles in triaxial haloes may simulate a cored profile[19]. A summary of the present discussions can be found e.g. in Ref. [20, 21, 22]. Resonant interactions between a rotating bar of visible matter and the dark matter may modify the cusp in barred galaxies and even cause a “halo” bar[23, 24].
-
•
It is not clear if the dark matter is homogeneously distributed or has a clumpy character. In N-body simulations the structure of the universe unfolds in a hierarchical manner, starting with the growing of the random initial density fluctuations in the cosmic microwave background and building up larger structure through mergers of smaller clusters. This can lead to many streams of dark matter and an enhancement in the annihilation rate as compared to a homogeneous distribution, since DMA . This enhancement (boostfactor) can be determined from a fit to the data.
-
•
It is usually assumed that DM does not interact with the visible matter, so many N-body simulation only consider the DM contribution. However, at the center of a spiral galaxy the gravitational potential is completely dominated by the visible matter and the DM halo will adjust to it. This adiabatic compression can lead to an enhancement of the DM density by factors of a few near the center of the galaxy[25], which in turn might be distributed to larger radii by the resonant interactions mentioned above.
-
•
The DM usually forms sheets and filaments by gravitational collapse. Galaxies are formed along these topological structures in the hierarchical manner discussed before, which leads to correlations in the orientation of galaxy clusters[26, 27], but can lead to anisotropic infall at the galactic scale as well, as shown by N-body simulations by Aubert et al. [28, 29]. An anisotropic infall along a filamentary structure can increase the density in the plane, preferentially at large radii, up to 100% but is on average more like 15% [28]. In our galaxy the observed ring of stars at a radius of about 15 kpc might be an example of such an anisotropic infall[30, 31, 32].
The mechanisms above all lead to an enhancement of the Dark Matter density in the plane of the disc, but N-body simulations do not have enough resolution to predict the actual distribution. Therefore the possible enhancement of DM density in the disc was parametrized by a set of Gaussian shaped rings in the galactic plane in addition to the expected triaxial profile for the DM halo. At least two rings should be envisaged: one “outer” ring for the enhancement from anisotropic infall at larger radii and one “inner” ring from the adiabatic compression by the gravitational potential of the visible matter. The actual parameters of the Gaussian rings can be determined from a fit to the data. The n-th ring is parametrized by a radius with a Gaussian width in radius and in height above the plane. So the total halo profile can be written as:
| (3) |
with
| (4) |
and ()are the principal axis of the triaxial halo profile (ring). The maximal neutralino density of a ring is reached in the galactic plane () at a distance from the galactic center . At present only two rings are fitted, i.e. N=2. The radius of the ring can be determined from the longitude profile in the plane of the galaxy, i.e. at low latitudes, because the solar system is not at the center, so if the density is constant along the ring, the different longitudes yield different fluxes, which depend on the radius, orientation and ellipticity of the ring. The extent of the ring above the plane can be obtained from the longitude distribution for higher latitudes.


5 Determination of Halo Profile Parameters
The differential gamma flux in a direction forming an angle with the direction of the galactic center is given by:
| (5) |
where is the branching ratio into the tree-level annihilation final state, while is the differential photon yield for the final state . The WIMP mass density along the line of sight, , enters critically in the prediction for the flux, since the number of WIMP pairs is equal to . The factor is the boostfactor, which represents the local enhancement of the number density with respect to the average by the expected clustering of DM. Since the average of can be significantly larger than the boost factor can enhance the flux by one or two orders of magnitude. The cross section is taken from Eq. 2 with the WMAP value for .
If one assumes that the clustering is similar in all directions, i.e. the same boostfactors everywhere, then the excess of diffuse gamma rays is just proportional to the square of the DM column density along the line of sight. The averaged density is determined by the halo profile, which is normalized to the local DM density. The latter can be estimated from the rotation curve of our galaxy to be for a spherical profile and a distance between the sun and the galactic center kpc. For a non-spherical profile this density has to be rescaled by integrating the total mass inside and assuming .
The halo parameters are fitted from the data in the following way: the longitude distributions are determined in bins of 8∘ for four different latitude ranges (0-5∘, 5-10∘, 10-20∘, 20-90∘), so one has 4x45=180 angular bins. The data in each bin is split in two energy ranges: data between 0.1 and 0.5 GeV and data above 0.5 GeV, where only the high energy data has a significant contribution from DMA, as can be seen from Fig. 1, so the low energy data can be used for the normalization of the background. The normalization of the background was around 0.8 in the plane of the galaxy and 1.1 for larger latitudes, indicating small systematic errors in the column densities. After correcting for these systematic shifts, which are within the quoted errors, the remaining systematic errors are about 10%, as estimated from fitting the energy spectrum e.g. at 0.1 and 0.5 GeV and determining the at 0.3 GeV. This was repeated for various energy bins and a below one was obtained for a systematic uncertainty of 10%. This uncertainty will be used in all fits and added in quadrature to the statistical error, which is usually much smaller. Such a rescaling implies that we only rely on the shape of the background distribution, as discussed before.
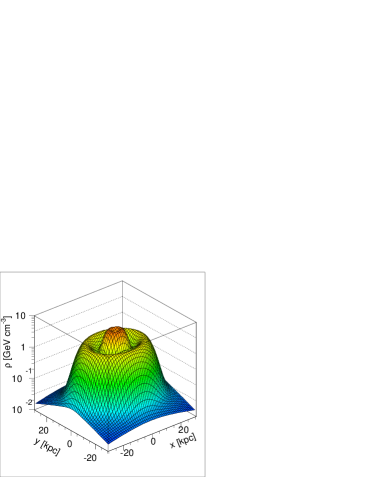
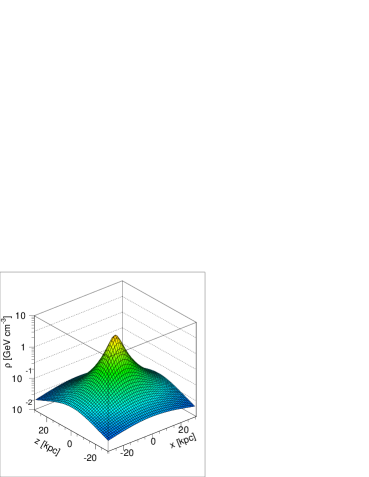
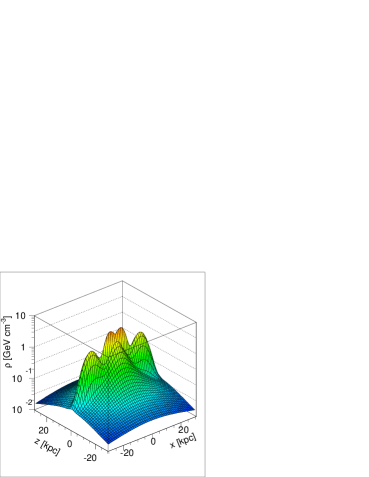
The fits to the 6 regions shown in Fig. 3 were repeated for all the 180 intervals mentioned above. The resulting distributions are shown in Fig. 4 for the energies above 0.5 GeV and an isothermal halo profile with and without rings. An isothermal profile without rings cannot describe the data, but adding two rings yields a good fit with a reduced for systematic errors of 10%. The fitted parameters are given in Table 2. The density profiles with and without rings are displayed in Fig. 5 and will be discussed below. The boost factor for the profile with rings is around 40, but can be changed easily by a factor two up and down by either modifying the shape of the background within errors and/or by changing the ellipticity and normalization of the halo profile. Remember that the gamma flux is proportional to , so increasing the contribution from the DM halo to the rotation velocity by 20% lowers the boost factor already by a factor two.
The assumption of a constant boost factor for all directions is not necessarily true, since the tidal forces and merger history are a function of radius. A radial dependence of the boostfactor would change the halo profile correspondingly. With a constant boost factor and the fitted profile one obtains a reasonable . Leaving the boost factors free for the fitted profile yields a boost factor variation of about 20% for the 6 regions of Table 1, indicating that this procedure at least is self consistent.
The NFW profile does not fit the data, neither with or without rings, since the longitudinal profile does not show the strong cusp at the center. In order to be sure that the cusp is not subtracted as a point source, the whole analysis was repeated by using the complete EGRET sky map, i.e. the one including all the points sources. This does not change the results, since most points sources have a soft spectrum and even the many point sources near the center of the galaxy increase the diffuse spectrum by less than 20%. Three nearby sources in the disc (i.e. latitude ) show a strong increase in the spectrum, namely at longitudes of +85∘, -170∘ and -95∘. There seem to be several sources in these regions, so the subtraction is not straight forward. Therefore these 3 points have been excluded in all analysis discussed before. The following sections discuss the properties of the halo in more detail.
5.1 Ring structure
Fig. 4 displays the contributions from the inner and outer rings at radii of 4.3 and 14 kpc, respectively. The maximum density of the outer ring is at a radius of 14 kpc with a one sigma spread of 2.1 kpc in radius and 1.3 kpc perpendicular to the plane. Its peak density is 2.3 GeV/cm3, which corresponds to a factor 8 enhancement over the density from the isothermal profile. These coordinates coincide with the ring of stars observed in the plane of the galaxy at a distance of 12-18 kpc from the galactic center[30, 31]. These stars show a much smaller velocity dispersion (30 km/s) and larger z-distribution than the thick disc, so it cannot be considered an extension of the disc. A viable alternative is the infall of a dwarf galaxy[30, 32], for which one expects in addition to the visible stars a DM component. From the size of the ring and its peak density one can estimate the amount of DM in the outer ring to be approximately solar masses. Since the gamma ray excess covers the full 360∘ of the sky, one can extrapolate the observed of visible stars to obtain a total mass of solar masses[30], so the baryonic matter is only a small fraction of the total mass, which may explain the stability and the small velocity dispersion of the observed stars. The outer ring of the gamma rays excess shows an ellipticity with an axis ratio of about 0.850.1 with the major axis close to the direction of the galactic anticenter.
The inner ring at 4.3 kpc with a width of 3.4 kpc in radius and 0.3 kpc in is more difficult to interpret, since the density of the inner region is modified by adiabatic compression and interactions between the bar and the halo, as discussed before. Furthermore, its parameters are strongly correlated with the parameters of the isothermal profile, so the sum of the two is an effective parametrization of the density near the centre. The ellipticity of the inner ring is quite strong (0.65 0.15) with its major axis approximately in the direction of the bar, which suggests a strong influence of the adiabatic compression by the bar. The enhancement of the density in the ring by a factor 2.8 over the density of the isothermal profile is the right order of magnitude[25].
It is interesting to note that the coordinates of the inner ring coincide with the ring of cold dense molecular hydrogen gas, which reaches a maximum density at 4.5 kpc and has a width of 3 kpc as well (see e.g. Ref. [33]). This suggests that just like the ring of stars at 14 kpc is stabilized by the ring of DM, this ring is stabilized by DM as well and the higher hydrogen density in the DM ring increases the binding of the atoms into molecules.
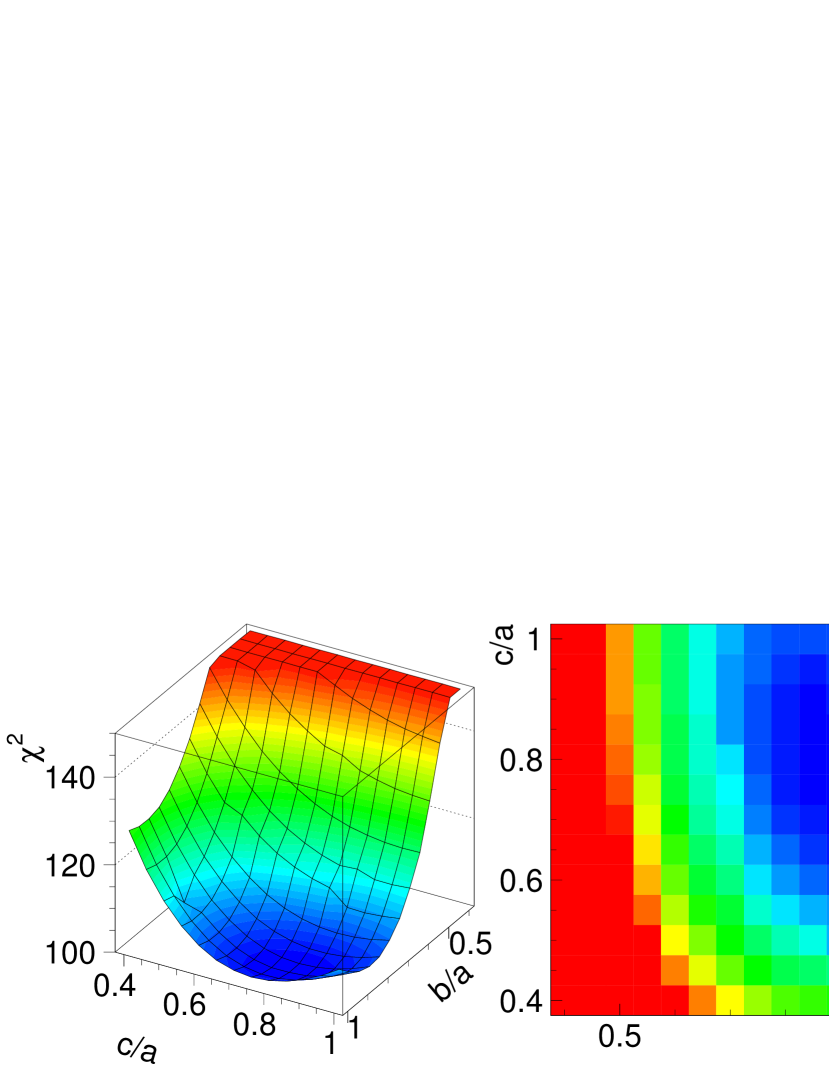
5.2 Halo ellipticity
The axis ratios of the basic halo profile turn out to be similar to the ellipticity of the outer ring, i.e. and are around 0.8-0.9 in both directions. The errors of these ratios are about 0.1, as can be estimated from the distribution shown in Fig. 7. For a ratio of 0.8 the most probably value from N-body simulations for is 0.9[15] in agreement with the values found. The halo is prolate instead of oblate. Oblate haloes are often assumed in discussions on the rotation curves[34] or stability of the ring of stars from the tidal disruption of the Sagittarius dwarf[35, 36, 37, 21]. It would be interesting to study the stability of this ring in the proposed halo, especially since the ring of stars is seen in a plane almost perpendicular to the major axis of the prolate halo. The alignment between the angular momentum and the minor axis in a prolate halo is a preferred structure, as found in recent high resolution N-body simulations by Bailin & Steinmetz[29].
5.3 Comparison with rotation curve
| Parameter | Value | Parameter | Value |
|---|---|---|---|
| 2 | 4.3 kpc | ||
| 2 | 3.4 kpc | ||
| 0 | 0.3 kpc | ||
| 8.5 kpc | 2.3 GeV cm-3 | ||
| 4 kpc | 14 kpc | ||
| 0.47 GeV cm-3 | 2.1 kpc | ||
| 3.3 GeV cm-3 | 1.3 kpc | ||
| 0.9 | 0.8 |
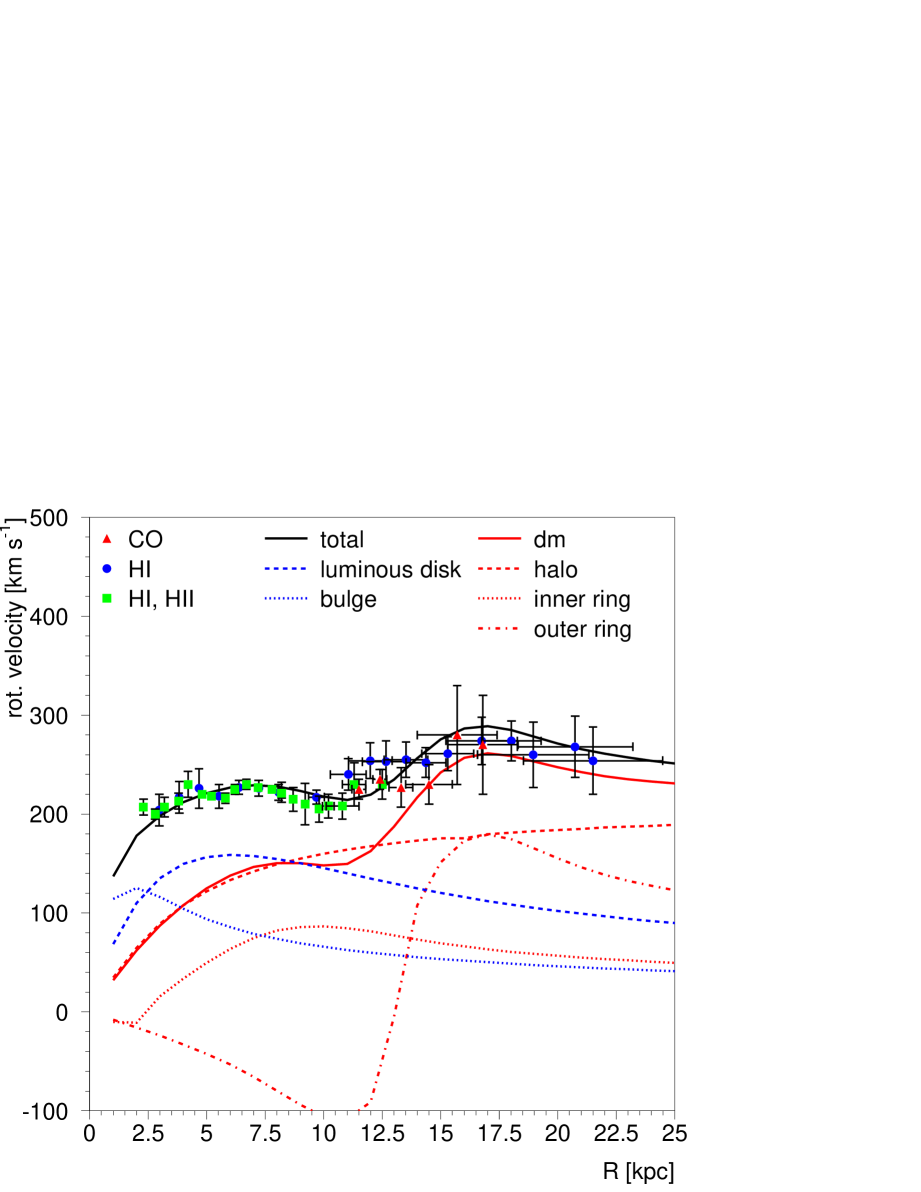
The rotation curve of our galaxy shows a peculiar non-flat structure near our solar system, namely at kpc the slope changes sign[38, 39, 40, 41]. The two ring model describes this structure well, as shown in Fig. 8. The contributions from each of the mass terms have been shown separately. The basic explanation for the negative contribution from the outer ring is that a tracer star at the inside of the ring at 14 kpc feels an outward force from the ring, thus a negative contribution to the rotation velocity. In order to calculate this more quantitatively one needs the complete distribution of both the visible and DM mass. The contributions from the baryonic matter to the rotation curve were modeled as in Ref. [34], while the DM density was taken from Eq. 3. The solution for the gravitational potential of the Poisson equation can be written in spherical coordinates () as:
| (6) |
or in the plane in the direction :
| (7) |
Note that includes all masses. The rotation velocity for a circular orbit at a radius can then be calculated by requiring that the resulting gravitational force on a tracer star equals the centrifugal force, i.e. or
| (8) |
This threefold integral was integrated numerically to obtain the contribution from all mass elements in the halo. The contributions of the bulge, halo and DM are shown separately in Fig. 8. The negative contributions from the rings originate from the fact that the derivative of the gravitational potential changes its sign, when crossing the maximum of the ring and so does the contribution to (see term in numerator of Eq. 8). This implies an outward gravitational force exerted by the ring for a tracer inside the ring and an inward force for a tracer outside the ring111The gravitational force is only zero in a spherical , not inside a .. The explanation for the hitherto mysterious change of sign of the slope near finds then its natural explanation in the large ring of DM at kpc, whose mass is determined by the excess of energetic gamma rays.
5.4 Comparison with the surface density
The gravitational potential near our solar system is strongly constrained by the height distribution and velocity dispersion of the stars in the disc. From these measurements the surface density can be determined for a given interval in , which was found to be in the range 70-90 [42, 43]. However, here the density includes all the mass. In order to obtain the contributions of DM and baryonic matter separately one has to assume a height distribution for each of them. For the visible matter density one usually assumes an exponential decrease with height and for the DM a constant density, but the results still vary widely depending e.g. on the value of scale height for the exponential decrease or the DM density profile. A consensus value for the baryonic surface density is suggested by Olling and Merrifield: [34]. The assumption of a constant DM density is not valid in our halo model with rings in the disc. Integrating the mass density distributions we find for the baryonic surface density and for the DM surface density . The visible part is within the “consensus” range, but the total is above the value quoted by Kuijken and Gilmore[42], however compatible with the more recent values from Siebert, Bienaym and Soubiran[43]. It should be noted that the surface density of the DM is rather sensitive to the width of the inner ring, since the solar system is located on the falling outer slope of this ring, so these numbers should be taken as indicative.
5.5 Galactic parameters
From the DM halo profile and visible density, as derived from the rotation curve for the given DM profile one can determine the following basic properties of our galaxy: 1) The radius containing an average density 200 times the critical density equals 2) The total DM mass inside this radius is 3.0 solar masses to be compared with a visible mass of 5.5 3) The inner (outer) ring contribute 0.6 (2.7) % to the total DM mass 4) The fraction 5) The concentration parameter . All these parameters are well inside the range expected from N-body simulations for an isothermal profile[13] and independent mass estimates of the galaxy[44].
6 Is the WIMP signal compatible with Supersymmetry?
Supersymmetry [45] presupposes a symmetry between fermions and bosons, which can be realized in nature only if one assumes each particle with spin j has a supersymmetric partner with spin ( for the Higgs bosons). This leads to a doubling of the particle spectrum. Obviously SUSY cannot be an exact symmetry of nature; or else the supersymmetric partners would have the same mass as the normal particles. The mSUGRA model, i.e. the Minimal Supersymmetric Standard Model (MSSM) with supergravity inspired breaking terms, is characterized by only 5 parameters: . Here and are the common masses for the gauginos and scalars at the GUT scale, which is determined by the unification of the gauge couplings. Gauge unification is still possible with the precisely measured couplings at LEP [46]. The ratio of the vacuum expectation values of the two Higgs doublets is called and is the trilinear coupling at the GUT scale. We only consider the dominant trilinear couplings of the third generation of quarks and leptons and assume also to be unified at the GUT scale. The absolute value of the Higgs mixing parameter is determined by electroweak symmetry breaking, while its sign is taken to be positive, as preferred by the anomalous magnetic moment of the muon [46].
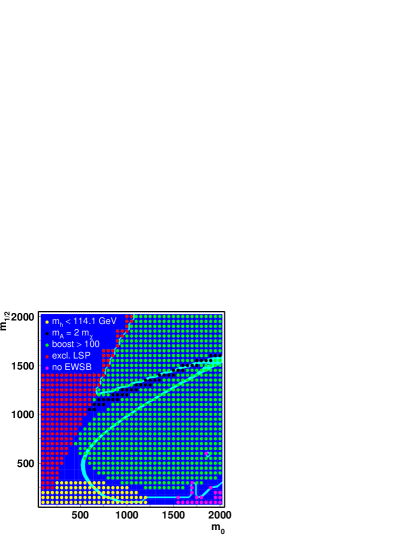
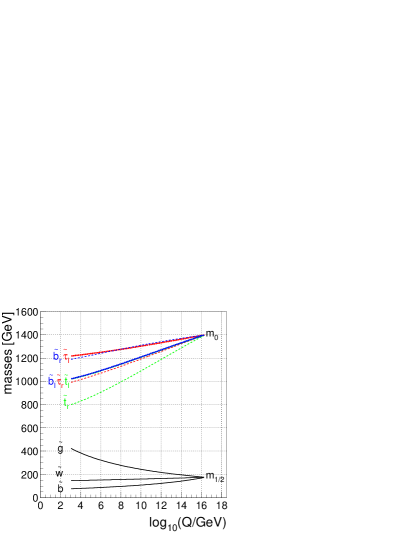
The Lightest Supersymmetric Particle (LSP) in the mSUGRA scenario is one of the four neutralinos, which are mixtures of the four spin 1/2 partners of the photon, Z-boson and two Higgs particles. If R-parity is conserved the LSP is stable. In a large region of parameter space it has a large gaugino component, so the couplings to other particles are similar to the photon coupling, but R-parity conservation forbids electromagnetic couplings to normal matter. Therefore the LSP can have only weak couplings, thus being a perfect candidate for DM. The neutralino annihilation cross section depends on the SUSY parameters. For the neutralino annihilation cross section from the precise relic density from the WMAP data only a small range of SUSY masses is allowed, as shown by the thin line in Fig. 9 for , and ; the latter values turn out to be good parameters if one requires relatively low boost factors for the mass ranges preferred by WMAP and EGRET simultaneously. The relic density has been calculated as function of the SUSY parameters with the program microMegas[47] after interfacing it to the Suspect program[48] to calculate the SUSY mass spectrum from the Renormalization Group Equations (see e.g. [45]) and to the FeynHiggs program[49] to calculate the Higgs mass in Supersymmetry. Several regions are excluded in this plane. The corner at the bottom left is excluded because the Higgs mass is predicted to be below the experimental lower limit of 114.4 GeV, as measured at LEP[50]. In the corner at the bottom right the radiative corrections from the gauginos, which are light there, are too small to induce electroweak symmetry breaking. In the corner at the top left the Lightest Supersymmetric Particle (LSP) would be charged, as expected, since here the GUT scale values of the neutralinos are high (large ) and the squarks and sleptons are light (small ). Since the DM is known to be neutral, this region has to be excluded. In the adjacent region the stau cannot decay fast into a neutralino and tau (because the mass difference between neutralino and stau is less than the tau mass), but a stau and neutralino can annihilate into a tau plus photon. This coannihilation reduces the relic density to values required by the WMAP data, but these regions require large boost factors, since in the present galaxy the next heavier LSP’s (NLSP) have decayed and only the self annihilation contributes. The regions, where the boost factors are less than 100 are shown in Fig. 9 as well. For boost factors below 100 only two regions are allowed by the WMAP data (blue line): one around GeV and one around GeV. The latter region is strongly preferred by the EGRET spectrum. The evolution of the sparticle masses from the GUT scale values towards lower energies is shown in the right panel of Fig. 9. The large value of yields squark and slepton masses around 1 TeV, but the gluinos and charginos are relatively light, which would have interesting consequences for searches at future colliders. The compatibility with Supersymmetry implies the possibility that the Dark Matter is the supersymmetric partner of the Cosmic Microwave Background. Future experiments from 2007 onwards at the Large Hadron Collider under construction at CERN will tell, since the predicted sparticle masses from the present analysis are within the range of this accelerator with a centre of mass energy of 14000 GeV.
7 Summary
In this analysis the diffuse gamma rays from dark matter annihilation and background are separated by the difference in the shape of the energy spectra, thus eliminating the need to rely on absolute fluxes. The normalization of the background comes out to be close to the absolute prediction of the GALPROP conventional propagation model of our galaxy, while the normalization of the DM signal corresponds to a boost factor from 20 upwards, if the annihilation cross section is taken from WMAP data. Larger boost factors are always possible, if in addition to self annihilation the coannihilation between WIMP and other particles is allowed.
It is shown that the gamma ray excess shows features expected from Dark Matter annihilation:
-
•
The excess shows the same spectrum in all sky directions
-
•
The intensity of the excess is compatible with a prolate triaxial halo with the major axis in the plane of the galaxy close to the direction of the galactic anticenter and axis ratios and .
-
•
There is additional excess in the galactic plane located at two radii. The excess at r=14 kpc coincides with the ghostly ring of stars, thought to originate from the tidal disruption of a dwarf galaxy. Since such a dwarf galaxy usually carries a large amount of DM, the excess of the diffuse gamma rays in this region is naturally explained by DMA. The inner ring at a radius of 4.3 kpc coincides with the ring of high density molecular hydrogen gas, so its existence and stability can be explained by the potential well from the DM. The higher density of atomic gas in such a well will increase the binding into molecules. The inner ring has a small axis ratio of 0.66 with the long axis in the direction of the bar, which suggests that this enhancement is connected with adiabatic compression and/or additional remnants of the merger history. The enhancement of the inner ring density over the isothermal halo is 2.7, which is the right order of magnitude for adiabatic compression.
-
•
Additional evidence that the ring of stars is associated with a large amount of DM is provided by the rotation curve: the hitherto mysterious change of slope at a radius of 1.1 finds its natural explanation in the ring of DM, whose mass is calculated from the excess of gamma rays to be , which is two orders of magnitude larger than the estimated visible mass.
-
•
The local surface density is dominated by Dark Matter in our model, but compatible with the local gravitational potential, as determined from the height distribution and velocity dispersion of nearby older stars.
-
•
The most probable WIMP mass is determined from the spectrum of the excess to be in the range 50-100 GeV, assuming the gamma rays in DMA originate from decays.
Alternative models trying to explain the EGRET excess have to assume that the locally measured fluxes of protons and electrons are not representative for our galaxy, in which case these spectra outside our local bubble can be tuned to obtain the more energetic gamma rays needed for the EGRET excess[10]. Of course such models cannot explain simultaneously the stability of the ring of stars at 14 kpc and the change of slope in the rotation curve at .
The results mentioned above make no assumption on the nature of the Dark Matter, except that its annihilation produces hard gamma rays with a spectrum given by the EGRET excess. A WIMP mass of 50-100 GeV is consistent with the Lightest Supersymmetric Particle predicted in the Minimal Supersymmetric Model with supergravity inspired symmetry breaking. Scalar masses of squarks and sleptons are expected to be in the TeV range for the parameters consistent with the EGRET, WMAP and electroweak data.
It should be emphasized that the excess of diffuse gamma rays has a statistical significance of at least 10 if fitted to the shape of the diffuse gamma ray background obtained from the conventional propagation model of our galaxy using the GALPROP code. This combined with all features mentioned above provides an intriguing hint that this excess is indeed indirect evidence for Dark Matter Annihilation.
8 Acknowledgements
I thank my close collaborators A. Gladyshev, M. Herold, D. Kazakov, C. Sander and V. Zhukov for their contributions to this interesting project. Furthermore I thank V. Moskalenko and A. Strong for sharing with us all their knowledge about our Galaxy and help in running their GALPROP code, O. Reimer for numerous discussions on EGRET data and to provide us with the unpublished data up to 120 GeV and D. Aubert, L. Bergstrm, O. Bienaym, R. Ibata, A. Phukov, J. Primack, P. Sikivie and V. Springel for useful discussions. This work was supported by the DLR (Deutsches Zentrum für Luft- und Raumfahrt) and a grant from the DFG (Deutsche Forschungsgemeinschaft, Grant 436 RUS 113/626/0-1).
References
-
[1]
D.N. Spergel et al, 2003, ApJS, 148, 175;
C.L. Bennett et al., 2003, ApJS, 148, 1;
Further results of the first year of operation of the WMAP satellite can be found on the Web: http://map.gsfc.nasa.gov/m_mm/pub_papers/firstyear.html - [2] J. Ellis et al., Nucl. Phys. B238 (1984) 453.
- [3] G. Jungman, M. Kamionkowski and K. Griest, Phys. Rep. 267 (1996) 195.
- [4] L. Bergstrm, Rept. Prog. Phys. 63 (2000) 793 [arXiv:hep-ph/0002126].
- [5] G. Bertone, D. Hooper and J. Silk, arXiv:hep-ph/0404175.
- [6] W. de Boer, M. Herold, C. Sander and V. Zhukov, arXiv:hep-ph/0312037.
-
[7]
A. W. Strong and I. V. Moskalenko,
Astrophys. J. 509 (1998) 212,
[arXiv:astro-ph/9807150];
I. V. Moskalenko, A. W. Strong and O. Reimer, Astron. Astrophys. 338 (1998) L75 [arXiv:astro-ph/9808084];
A. W. Strong, I. V. Moskalenko and O. Reimer, Astrophys. J. 537 (2000) 763 [Erratum-ibid. 541 (2000) 1109] [arXiv:astro-ph/9811296]; Details on the latest versions can be found at: www.mpe.mpg.de/~aws/propagate.html -
[8]
A. Cesarini, F. Fucito, A. Lionetto, A. Morselli and P. Ullio,
Astropart. Phys. 21 (2004) 267
[arXiv:astro-ph/0305075];
J. Edsjo, arXiv:astro-ph/0211354. P. Ullio, L. Bergstrom, J. Edsjo and C. G. Lacey, Phys. Rev. D 66 (2002) 123502 [arXiv:astro-ph/0207125];
A. Morselli, Int. J. Mod. Phys. A 17 (2002) 1829;
D. Hooper and B. Dingus, arXiv:astro-ph/0212509. D. Elsaesser and K. Mannheim, arXiv:astro-ph/0405235;
L. Bergstrom, P. Ullio and J. H. Buckley, Astropart. Phys. 9 (1998) 137 [arXiv:astro-ph/9712318];
G. Jungman and M. Kamionkowski, Phys. Rev. D 51 (1995) 3121 [arXiv:hep-ph/9501365];
D. Fargion, R. Konoplich, M. Grossi and M.Yu.Khlopov Astropart. Phys. 12 (2000) 307 [astro-ph/9902327]. - [9] E. Kolb, M.S. Turner, The Early Universe, Frontiers in Physics, Addison Wesley, 1990.
- [10] A. W. Strong, I. V. Moskalenko and O. Reimer, arXiv:astro-ph/0406254.
- [11] P. Gondolo, J. Edsjo, P. Ullio, L. Bergstrom, M. Schelke and E. A. Baltz, JCAP 0407 (2004) 008 [arXiv:astro-ph/0406204] and http://www.physto.se/~edsjo/darksusy/.
- [12] T. Sjstrand, L. Lonnblad, S. Mrenna and P. Skands, arXiv:hep-ph/0308153.
- [13] R. Jimenez, L. Verde and S. P. Oh, MNRAS 339 (2003) 243 [arXiv:astro-ph/0201352].
- [14] J. Dubinski and R. G. Carlberg, Astrophys. J. 378 (1991) 496.
- [15] Y. P. Jing and Y. Suto, Astrophys. J. 574 (2002) 538 [arXiv:astro-ph/0202064].
- [16] J.F. Navarro, C.S. Frank and S.D. White, ApJ 490 (1997) 493, [arXiv:astro-ph/9611107].
- [17] C. Calcaneo-Roldan and B. Moore, Phys. Rev. D 62 (2000) 123005 [arXiv:astro-ph/0010056].
-
[18]
W. J. G. de Blok, S. McGaugh, A. Bosma, V.C. Rubin,
ApJ 552 (2001) L23;
W. J. G. de Blok, A. Bosma, S. McGaugh, MNRAS 340-2 (2003) 657-678;
A. Bosma, arXiv:astro-ph/0312154;
W. J. G. de Blok, arXiv:astro-ph/0311117; - [19] E. Hayashi et al., arXiv:astro-ph/0408132.
- [20] J. R. Primack, arXiv:astro-ph/0312549 and IAUS 220 (2004) 467 Sydney, Australia, Eds: S. D. Ryder, D. J. Pisano, M. A. Walker, and K. C. Freeman.
- [21] M. R. Merrifield, arXiv:astro-ph/0310497 and IAUS 220 (2004) 431 Sydney, Australia, Eds: S. D. Ryder, D. J. Pisano, M. A. Walker, and K. C. Freeman.
- [22] P. Mazzei, arXiv:astro-ph/0401509.
- [23] E. Athanassoula, arXiv:astro-ph/0312155 and IAUS 220 (2004) 255 Sydney, Australia, Eds: S. D. Ryder, D. J. Pisano, M. A. Walker, and K. C. Freeman.
- [24] K. Holley-Bockelmann, M. Weinberg and N. Katz, arXiv:astro-ph/0306374.
-
[25]
Wilson, G. and Kalnajs, A., 2001, ASP Conference Series, in press.
G. Wilson, thesis, Research School of Astronomy and Astrophysics, Australian National University, Canberra, August, 2003;
G. R. Blumenthal, S. M. Faber, R. Flores and J. R. Primack, Astrophys. J. 301 (1986) 27;
A. A. Dutton, S. Courteau, C. Carignan and R. de Jong, arXiv:astro-ph/0310001. - [26] A. Faltenbacher, M. Kerscher, S. Gottloeber and V. Mueller, Astron. Astrophys. 395 (2002) 1 [arXiv:astro-ph/0209029].
- [27] S. F. Kasun and A. E. Evrard, arXiv:astro-ph/0408056.
- [28] D. Aubert, C. Pichon and S. Colombi, MNRAS 352/2 (2004) 376, arXiv:astro-ph/0402405.
- [29] J. Bailin and M. Steinmetz, arXiv:astro-ph/0408163.
- [30] B. Yanny et al., Astrophys. J. 588 (2003) 824 [Erratum-ibid. 605 (2004) 575] [arXiv:astro-ph/0301029].
- [31] R. A. Ibata, M. J. Irwin, G. F. Lewis, A. M. N. Ferguson and N. Tanvir, Mon. Not. Roy. Astron. Soc. 340 (2003) L21 [arXiv:astro-ph/0301067].
- [32] A. Helmi, J. F. Navarro, A. Meza, M. Steinmetz and V. R. Eke, Astrophys. J. 592 (2003) L25 [arXiv:astro-ph/0303305].
- [33] L.S. Sparke and J.S. Gallagher, Galaxies in the Universe, Cambridge Universtiy Press, 2000.
- [34] R. P. Olling and M. R. Merrifield, Mon. Not. Roy. Astron. Soc. 326 (2001) 164 [arXiv:astro-ph/0104465].
- [35] S. R. Majewski, D. R. Law, K. V. Johnston, M. F. Skrutskie and M. D. Weinberg, arXiv:astro-ph/0311522.
- [36] R. Ibata, R. Wyse, G. Gilmore, M. Irwin and N. Suntzeff, arXiv:astro-ph/9612025.
- [37] Martínez-Delgado, D., G mez-Flechoso, M. A., Aparicio, A.; Carrera, R., Astrophys. J. 601) (2004) 242.
- [38] M. Honma and Y. Sofue, Publ. Astr. Soc. Japan 49 (1997) 453 and arXiv:astro-ph/9611156.
-
[39]
J. Brand and L. Blitz,
A&A. 275 (1993) 67;
M. Fich, L. Blitz and A.A. Stark, ApJ 342 (1989) 342;
L. Blitz, M. Fich and A.A. Stark, in Proc. IAU Symp. 87, (Ed. B.H. Andrew), Dordrecht, p. 213. - [40] S.E. Schneider and Y. Terzian, ApJ L61 (1983) 274
- [41] J. Binney and W. Dehnen, arXiv:astro-ph/9612060.
- [42] K.Kuijken and G. Gilmore, MNRAS 313 (1991) 209
- [43] A. Siebert, O. Bienaym and C. Soubiran, Astron. Astrophys. 399 (2003) 531 [arXiv:astro-ph/0211328].
- [44] M. I. Wilkinson and N. W. Evans, Mon. Not. Roy. Astron. Soc. 310 (1999) 645 [arXiv:astro-ph/9906197].
-
[45]
Reviews and original references can be found in:
W. de Boer,
Prog. Part. Nucl. Phys. 33 (1994) 201 [arXiv:hep-ph/9402266];
H.E. Haber, Lectures given at Theoretical Advanced Study Institute, University of Colorado, June 1992, Preprint Univ. of Sante Cruz, SCIPP 92/33; see also SCIPP 93/22;
Perspectives on Higgs Physics, G. Kane (Ed.), World Scientific, Singapore (1993);
A.B. Lahanus and D.V. Nanopoulos, Phys. Rep. 145 (1987) 1;
H.E. Haber and G.L. Kane, Phys. Rep. 117 (1985) 75;
M.F. Sohnius, Phys. Rep. 128 (1985) 39;
H.P. Nilles, Phys. Rep. 110 (1984) 1;
P. Fayet and S. Ferrara, Phys. Rep. 32 (1977) 249. - [46] W. de Boer and C. Sander, Phys. Lett. B 585 (2004) 276 [arXiv:hep-ph/0307049].
- [47] G. Blanger, F. Boudjema, A. Pukhov and A. Semenov, Comp. Phys. Commun. 149 (2002) 103 [arXiv:hep-ph/0112278]; arXiv:hep-ph/0210327 and http://wwwlap.in2p3.fr/lapth/micromegas.
- [48] A. Djouadi, J. L. Kneur and G. Moultaka, arXiv:hep-ph/0211331.
- [49] S. Heinemeyer, W. Hollik and G. Weiglein, arXiv:hep-ph/0002213.
- [50] R. Barate et al. [ALEPH Collaboration], Phys. Lett. B 565 (2003) 61 [arXiv:hep-ex/0306033].