CDF Forward Detectors and diffractive structure functions
at the Fermilab Tevatron
Abstract
The CDF Forward Detector upgrade project was designed to enhance the capabilities for diffractive physics at the Tevatron. It consists of a Roman Pot spectrometer to detect leading antiprotons, a set of counters near and around the beam-pipe to reject the non-diffractive event contamination to the data sample, and two Miniplug calorimeters to measure the event energy flow in the very forward rapidity region. In the novel design of the Miniplugs, a lead/liquid-scintillator is read out by wave-length shifting fibers arranged in a flexible tower geometry and relatively short depth allows calorimetric tracking. Performance of the Forward Detectors during the first two years of operation in Run II with colliding proton-antiproton beams at =1.96 TeV, as well as the first results obtained, are discussed. A measurement of the antiproton momentum loss using the Forward Detectors is also presented.
1 INTRODUCTION
Diffractive processes at the Tevatron have been studied by tagging events with either a rapidity gap or a leading nucleon [1]. In order to detect such events, forward regions in pseudorapidity [2] are extremely important. At the Fermilab Tevatron collider, proton-antiproton collisions provide the ground to study diffractive processes at high energies. Two experiments, CDF and DØ, collected data in the 1990’s at an energy of = 1.8 TeV and continue to do so in the first decade of this century with new upgraded detectors during the second phase of data-taking at = 1.96 TeV. These two periods are usually referred to as Run I and Run II, respectively. Diffractive physics topics to be addressed in Run II include studies of soft and hard diffraction, forward jet production, and exclusive production of dijet, low-mass and heavy flavor states.
The Run II physics program at the Tevatron Collider started in November 2001. Both the CDF and the DØ experiments underwent major upgrades to improve their detector capabilities. Among these, the Forward Detector [3] upgrade project at CDF will enhance the sensitivity for hard diffraction and very forward physics during Run II.
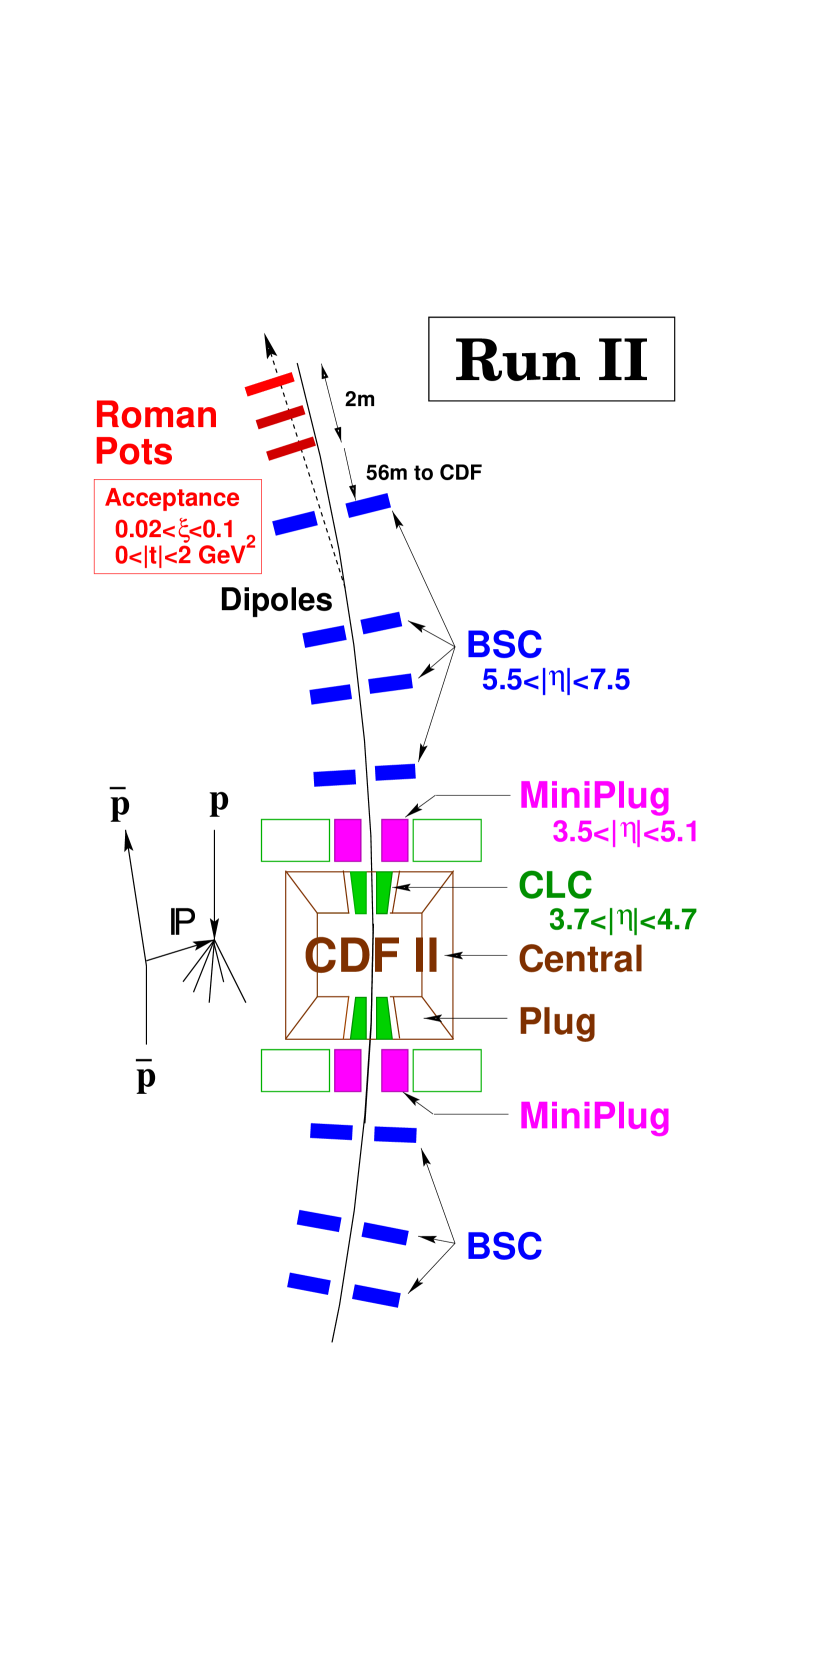
The Forward Detectors include the Roman Pot fiber tracker spectrometer (RPS) to detect leading antiprotons, a set of Beam Shower Counters (BSCs) installed around the beam-pipe at three (four) locations along the () direction to tag rapidity gaps at 5.5 7.5, and two forward MiniPlug (MP) calorimeters covering the pseudorapidity region 3.5 5.1. All these detectors have been installed and are now collecting data, fully integrated with the remainder of the CDF detector.
2 ROMAN POT FIBER TRACKER
The pomeron structure can be determined by using the kinematic variables in diffractive dijet events. During Run I, the momentum fraction of the carried by the pomeron was determined using the RPS to measure the momentum of the leading anti-proton. The RPS is a fiber detector spectrometer with a 2-m lever arm located approximately 56 m from the interaction point (IP), downstream of the anti-protons (Fig. 1). It consists of three stations, approximately 1 m apart from each other (Fig. 2).
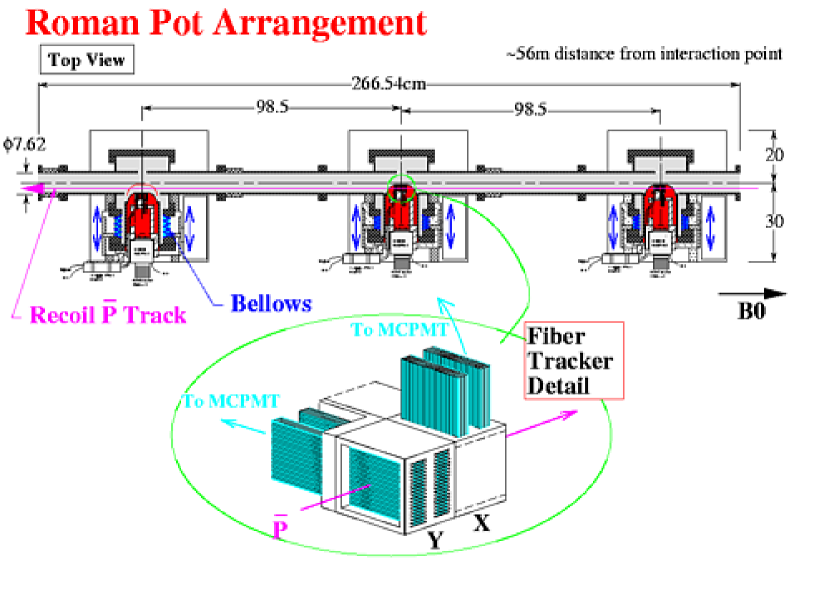
Each station comprises one trigger counter and one 80-channel scintillation fiber detector viewed by a Hamamatsu H5828 80-channel photo-multiplier tube (PMT). A coincidence of the three trigger counters selects events with an outgoing anti-proton at the RPS location.
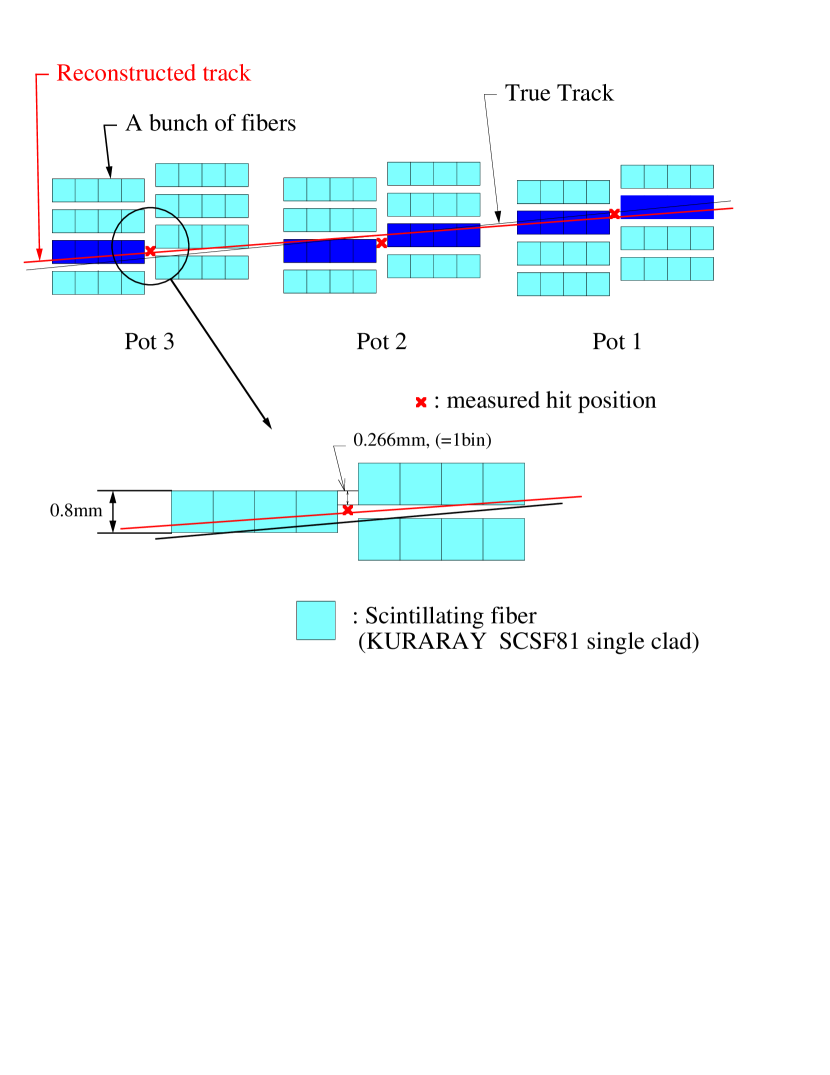
The fiber detector reads X (40 channels) and Y (40 channels) coordinates to identify the position of the tracks with a resolution of approximately m. The fibers are layered in bunches of four (Fig. 3) in order to increase the scintillating material traversed by the incoming particle. The fibers have a transversal section of 0.8 mm0.8 mm and are approximately 20 cm long. Each bunch has a total thickness of 3.2 mm and is read out by a single PMT channel. Each RPS station has four planes for reconstructing X and Y coordinates (two for X and two for Y). Both in the X and in the Y directions, the fibers of the two planes are shifted laterally relative to each other by one half of the fiber thickness for better spatial resolution and overlap by 266 m (approximately one third of their thickness). Figure 3 shows a section of the fiber tracker in one direction (either X or Y).
In preparation for Run II, the RPS was reinstalled as in Run I. In contrast, the readout electronics was completely redesigned to take into account the shorter (with respect to Run I) 396-nsec spacing between bunches. Moreover, the beam polarity at the RPS location was reversed with respect to that in Run I, so that the anti-proton beam travels now closer to the RPS detector. Typically, during data-taking, the sensitive detectors of the RPS are located at approximately 1 cm from the beam.
3 BEAM SHOWER COUNTERS
Single diffractive (SD) and double pomeron exchange (DPE) processes are characterized by forward rapidity gaps. A rapidity gap tagger at the trigger level would select these processes and can be accomplished with a set of scintillation counters around the beam-pipe at several locations along the and directions covering the forward pseudorapidity region.
The BSCs are used to identify diffractive events with a leading anti-proton by rejecting non-diffractive (ND) minimum bias events and events due to multiple interactions with at least one overlapping ND event. These counters are used to reduce ND background at the trigger level and thus make it possible to collect diffractive data at high luminosities.
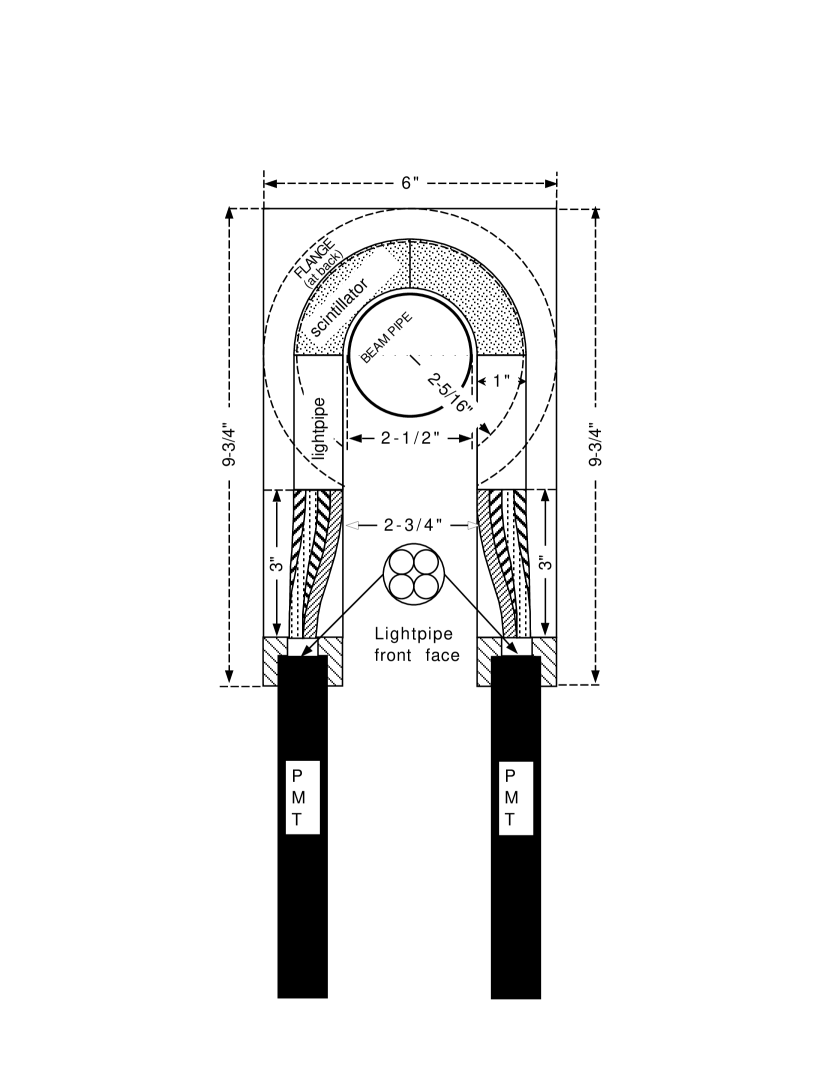
The BSCs detect particles traveling in either direction from the IP along and near the beam-pipe and cover the pseudorapidity region 5.5 7.5. There are four BSC stations on the west side and three on the east side of the IP (Fig. 1). All stations are located along the beam-pipe, at increasing distances from the IP as one goes from BSC-1 to BSC-4. BSC-1, 2 and 3 consist of two stations each, positioned symmetrically with respect to the IP, whereas BSC-4 consists of a single station on the west side. Stations are made of two scintillation counters, except for the BSC-1 stations, which have four counters (Fig. 4). Since each counter is connected to its own PMT, the entire system consists of 18 signal channels, 10 from the west and 8 from the east side.
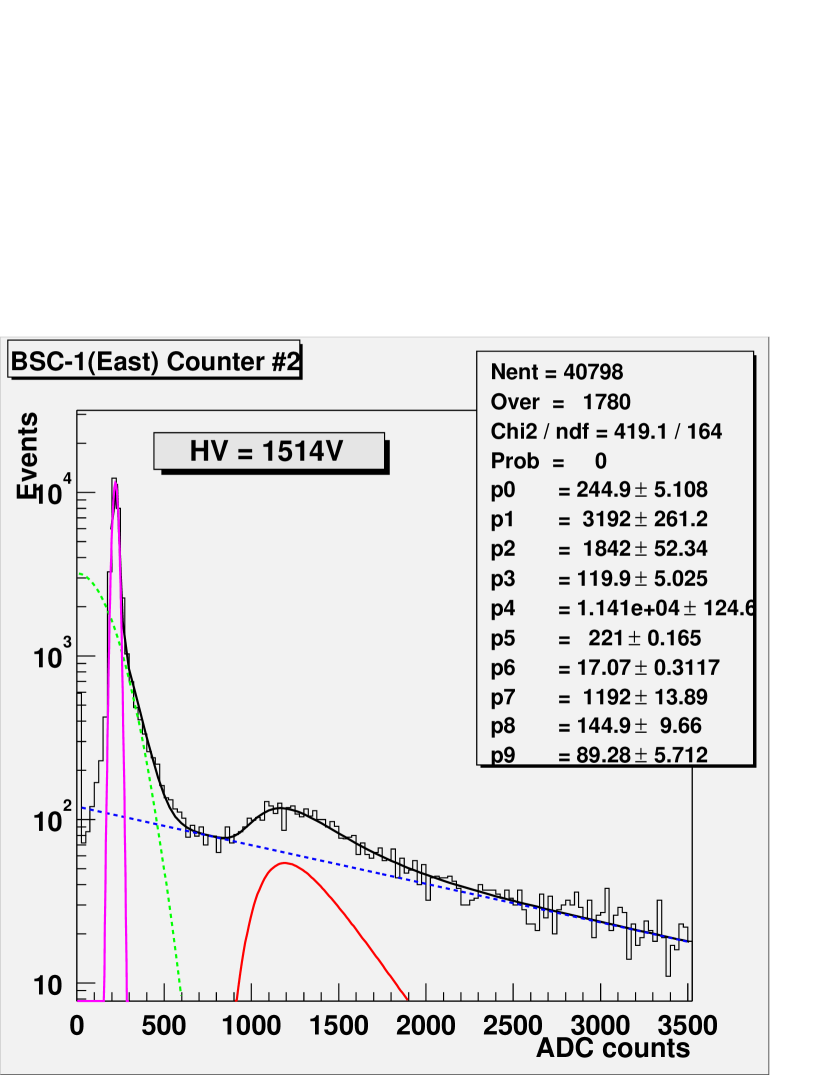
The distributions of ADC counts from the counters were compared in order to adjust the gains. The shapes of the distributions show good agreement and indicate that the gains are well equalized. Figure 5 shows the fit to a minimum ionizing particle (MIP) peak in the ADC distribution for one of the BSC-1 counters. As for the distributions for the other BSC-1 counters, the gains have been adjusted so that the MIP peaks measure approximately 1000 ADC counts.
The BSC-1 counters are also used to monitor Tevatron beam losses and collision rates. These counters cover the pseudo-rapidity region of . The beam loss rates provide a beam quality index to be used for selecting appropriate beam conditions. The signals from BSC-1 are referred to as “out-of-time” for particles hitting the counters nsec before the interaction time (also due to beam losses), and as “in-time” for particles coming from a collision and hitting the counters nsec after the interaction time (collision rate and diffractive physics measurements).
4 MINIPLUG DETECTORS
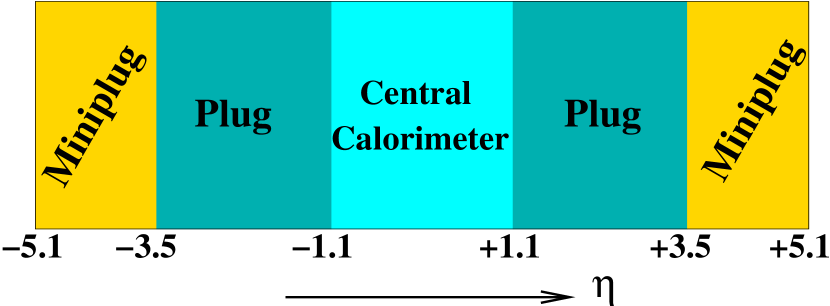
The event energy flow in the very forward direction is measured by the MP calorimeters. The diffractive physics and very forward physics program for Run II benefits from two forward MP calorimeters designed to measure the energy and lateral position of both electromagnetic and hadronic showers in the region . The MPs can detect both charged and neutral particles. They extend the pseudorapidity region covered by the Plug calorimeters, which is 1.1 3.5. It should be noted that the entire CDF detector, both in the central and in the forward rapidity regions, is essential to the analysis of diffractive processes. Figure 6 shows the calorimetry coverage of CDF in Run II.
The MP and Plug calorimeters can measure the width of the rapidity gap(s) produced in diffractive processes and will allow extending Run I studies of the diffractive structure function to much lower values of the fractions , where is the momentum of the proton carried by the pomeron.
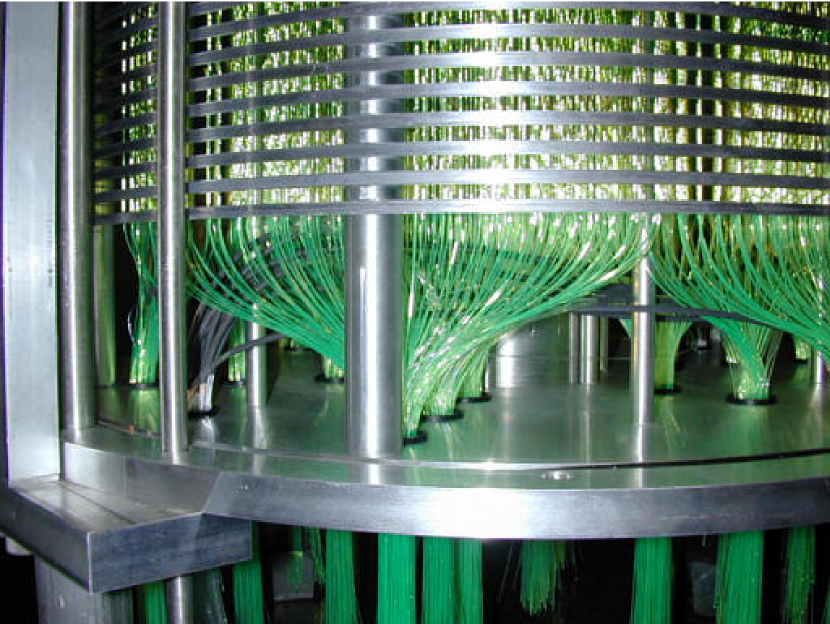
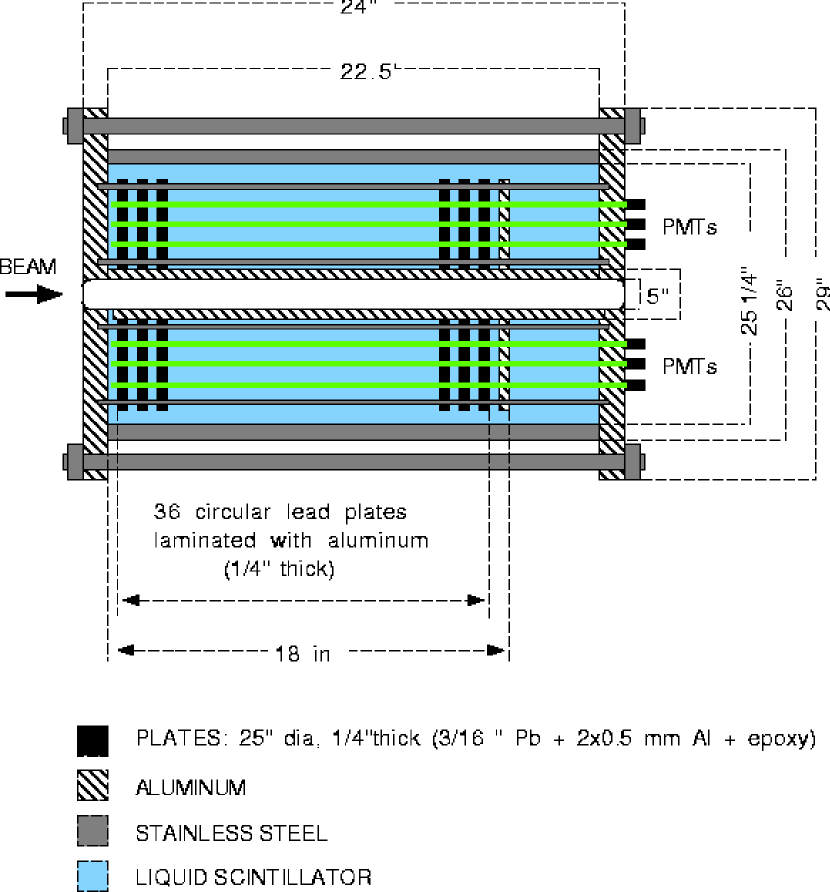
The MPs consist of alternating layers of lead plates and liquid scintillator read out by wave-length shifting (WLS) fibers (Fig. 7). The WLS fibers are perpendicular to the lead plates and parallel to the proton/anti-proton beams, in a geometry where towers are formed by combining the desired number of fibers and read out by multi-channel photomultipliers (MCPMTs). The 16-channel R5900 MCPMTs have been produced by Hamamatsu with a quartz window that significantly improves the radiation hardness. The MP has a “towerless” geometry and no dead regions due to the lack of internal mechanical boundaries. Each MP is housed in a cylindrical steel barrel in diameter and has a –hole concentric with the cylinder axis to accommodate the beam-pipe (Fig. 8). The active depth of each MP is 32 radiation lengths and 1.3 interaction lengths. The “short” hadronic depth confines the lateral spread of the showers, thereby facilitating the determination of the shower position and particle counting.
The design is based on a hexagon geometry. Uniformly distributed over each plate, holes are conceptually grouped in hexagons with each hexagon comprising six holes. A WLS fiber is inserted in each hole. The six fibers of one hexagon are grouped together and viewed by one MCPMT channel. The MCPMT outputs are added in groups of three to form 84 calorimeter towers in order to reduce the costs of the readout electronics. The tower geometry is organized in four concentric circles around the beam-pipe (Fig. 9).
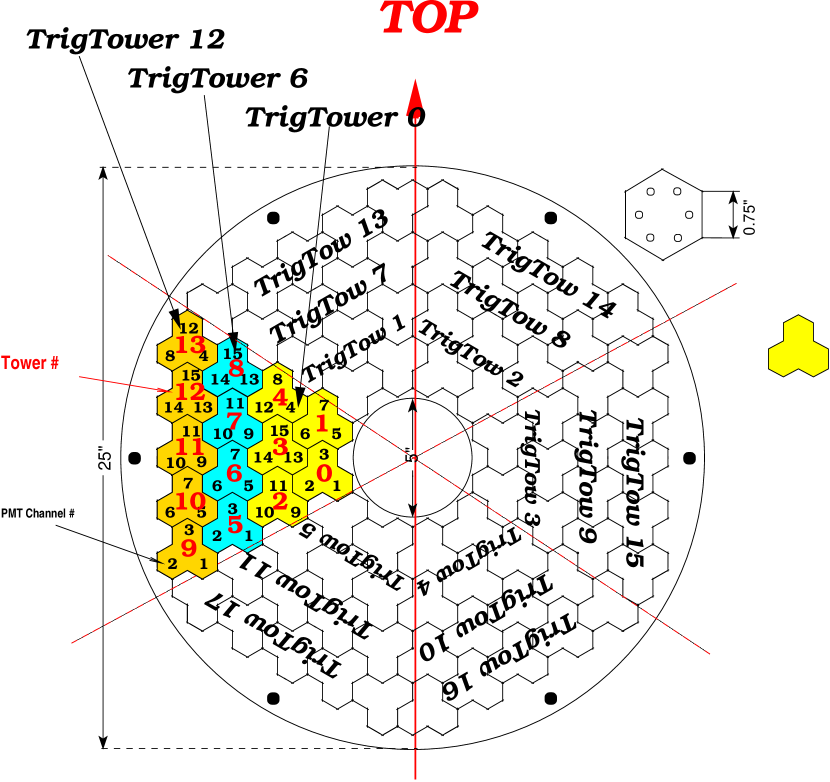
The sum of all MCPMT channels is also read out through the last dynode output, indicated as TrigTower in Figure 9, to provide triggering information. Each MP has a total of 18 trigger towers, arranged in three rings – the inner, the middle and the outer ring. This allows triggering on different pseudorapidity regions, either for events with a gap region or for events with large energy clusters. An additional clear fiber carries the light from a calibration light-emitting diode (LED) to each MCPMT pixel. The LED allows a relative gain calibration to equalize the MCPMT gains and also allows periodical monitoring of the MCPMT response.

Cosmic ray muons were used to test one 60∘-wedge of the East MP. In this test, the cosmic ray trigger fired on a 2-fold coincidence of scintillation counter paddles located on top and at the bottom of the MP vessel, placed with the towers pointing upward. The outputs from Towers #5, 6, 7 and 8 and from Trigger Towers #0, 6 and 12 (Fig. 9) were read out. An energy isolation cut selected only those muons which went through the entire length of the central Trigger Tower (#6) and vetoed on the signals from the neighboring Trigger Towers (#0 and 12). To calibrate the response to MIPs in photoelectrons, the single photoelectron response for Tower #7 was measured using a randomly gated signal from a 60Co source (Fig. 10). The single tower response to a MIP was found to be approximately 120 photoelectrons, exceeding design specifications.
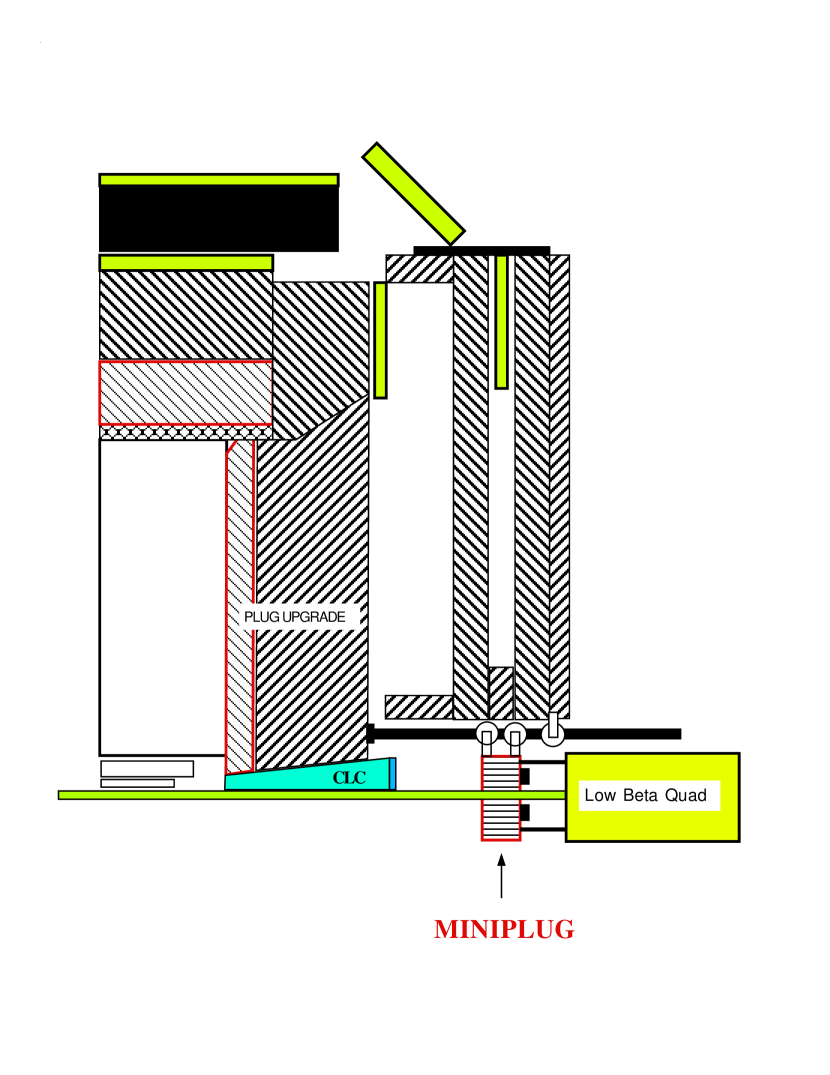
The MPs have been installed along the beam-pipe within the hole of the muon toroids at a distance of 5.8 m from the center of the CDF detector (Fig. 11). The MP detectors are now fully instrumented and have been collecting data since June 2002.
5 MINIPLUG CALIBRATION
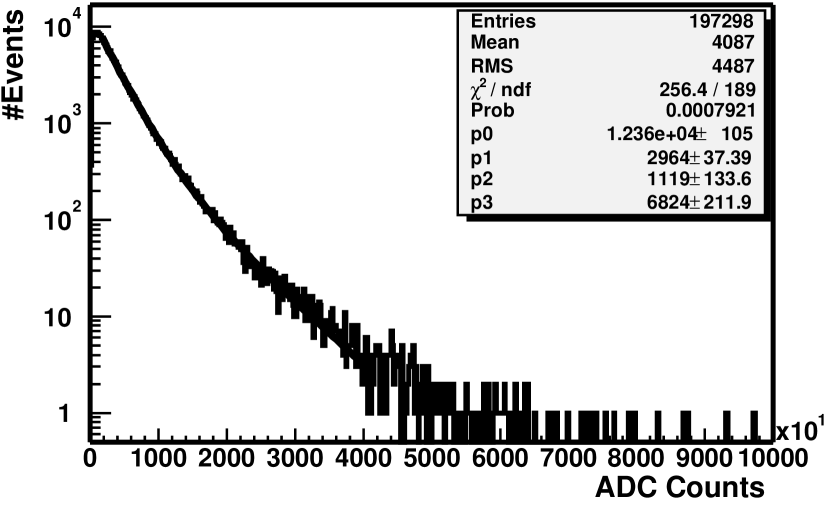
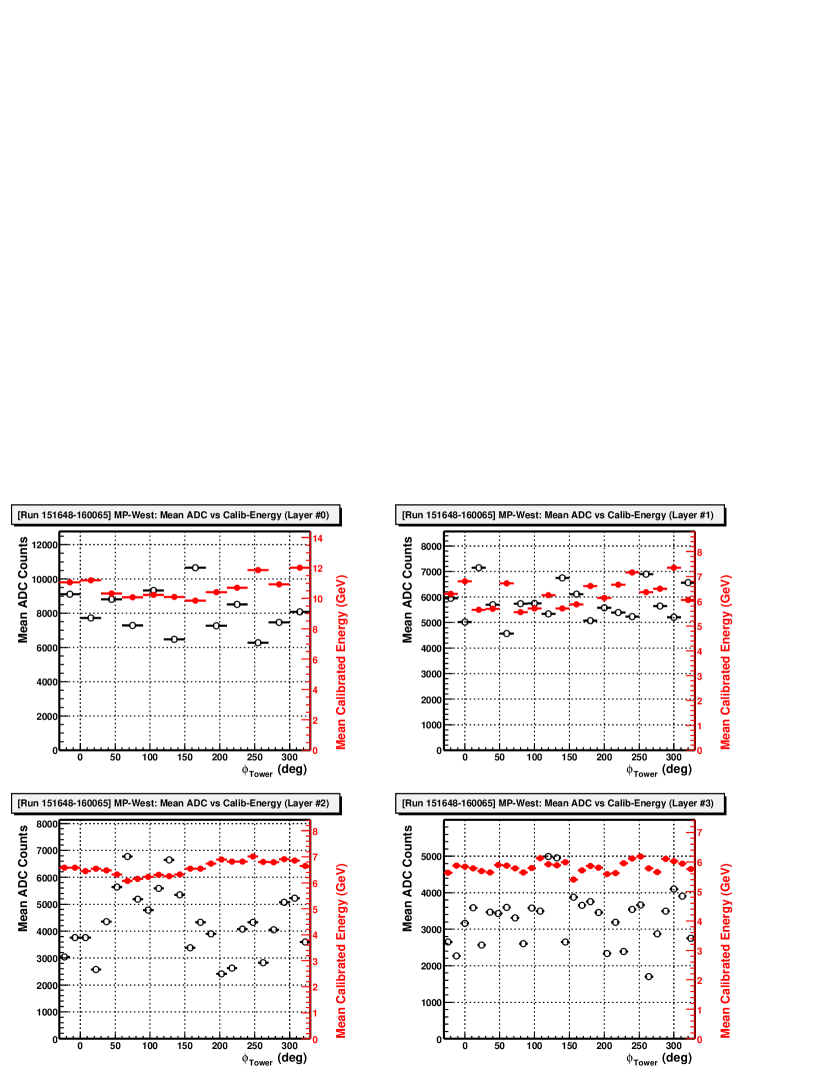
The first data from Run II have been used to calibrate and commission the MPs. Although a precise energy calibration of the MP is not crucial to the understanding of diffractive processes, an attempt was made to estimate the energy scale of jets and particles. To this end, a Monte Carlo simulation was used to calibrate the pseudorapidity dependence of the particles’ energies and thereby the tower-by-tower relative response. For each tower, the ADC count distribution of the data can be fitted well with a falling exponential curve, as shown in Figure 12, and is compared with a Monte Carlo simulation for a sample of minimum bias events. The slopes are first equalized separately in each ring and then adjusted to the slopes predicted from Monte Carlo for different pseudorapidity regions. Figure 13 shows the mean raw ADC counts values of all MP towers (open circles) in one of the four rapidity rings. The horizontal axis covers the entire range in azimuthal angle . MP tower response becomes flat within after energy calibration (full circles).
Due to the flexible tower geometry in the MP, the position of the particle initiating the shower is found as the center of the towers hit. The initiated shower also spreads to the neighboring towers (Fig. 14). In fact, about 25% of the energy of the shower is deposited in the seed tower, while the remainder is deposited in the surrounding towers. Particle multiplicity in the MP is calculated by counting the number of “peaks” above detector noise, using “seed” towers with a minimum transverse energy of MeV. The West MP multiplicity is depicted in Figure 15. The SD events have smaller multiplicity in comparison with ND events. Although the energy measured in the MP is not determined with the same accuracy as in the central calorimeter, the measurement and the selection of diffractive events are not appreciably affected.
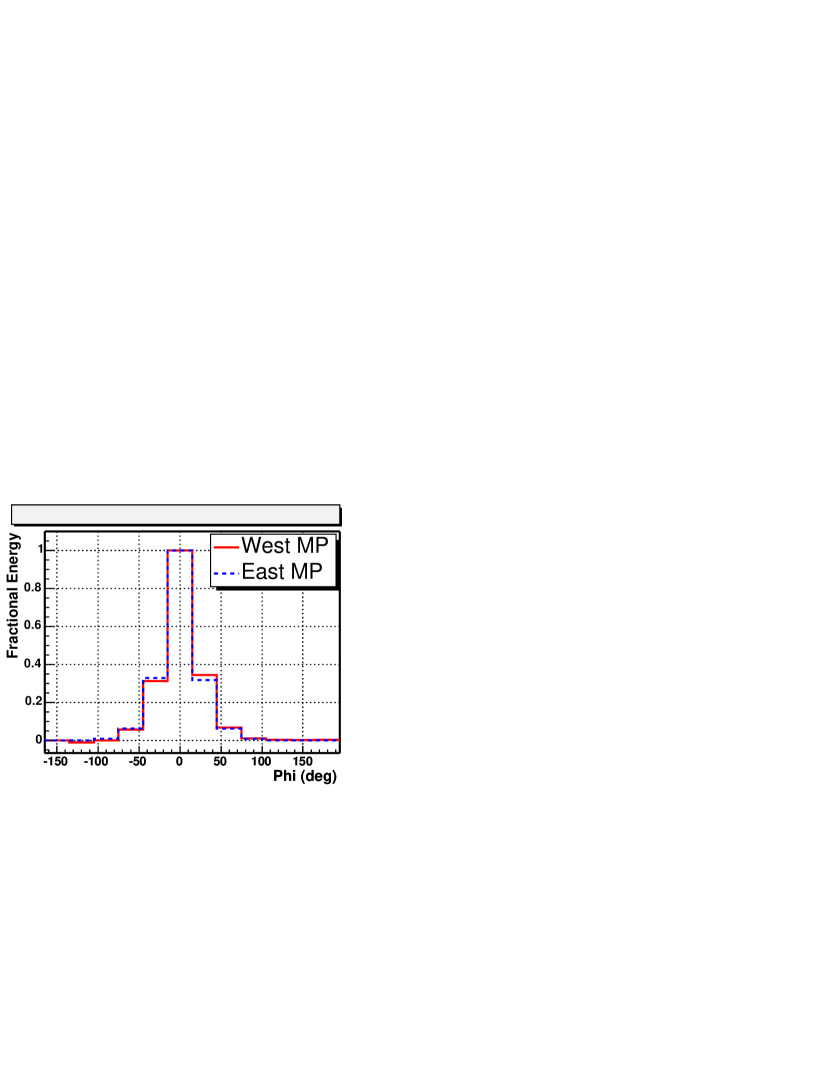
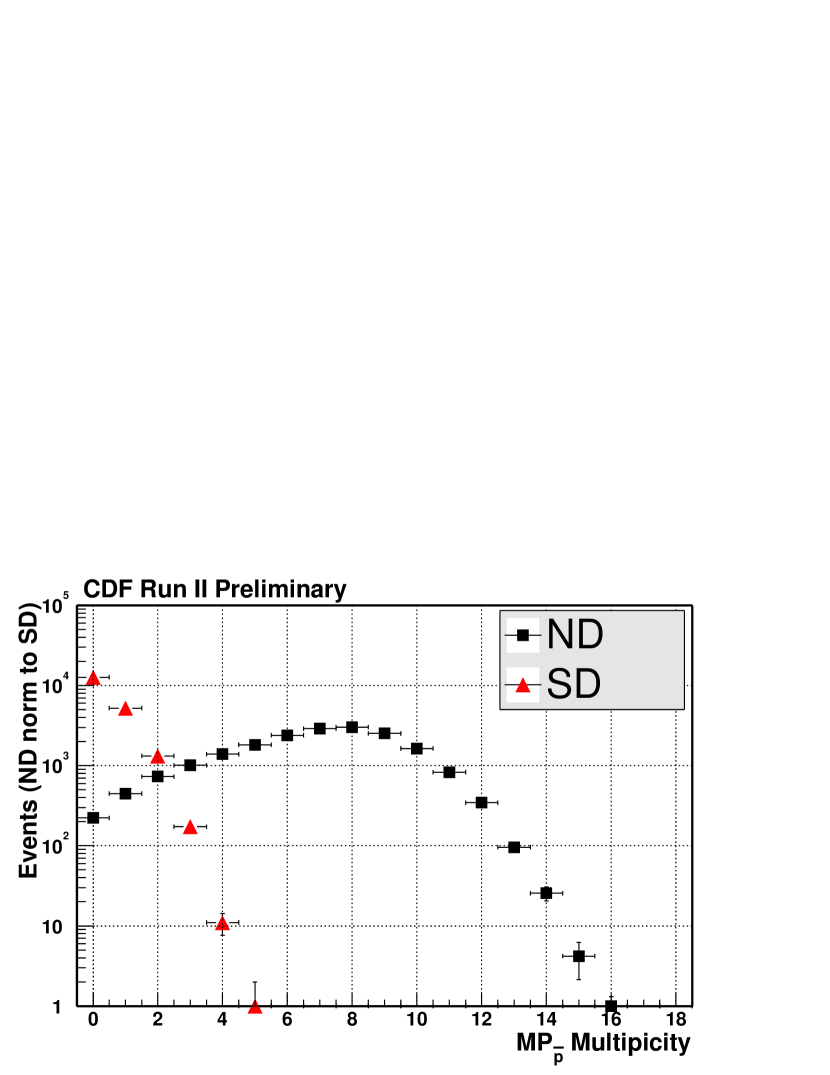
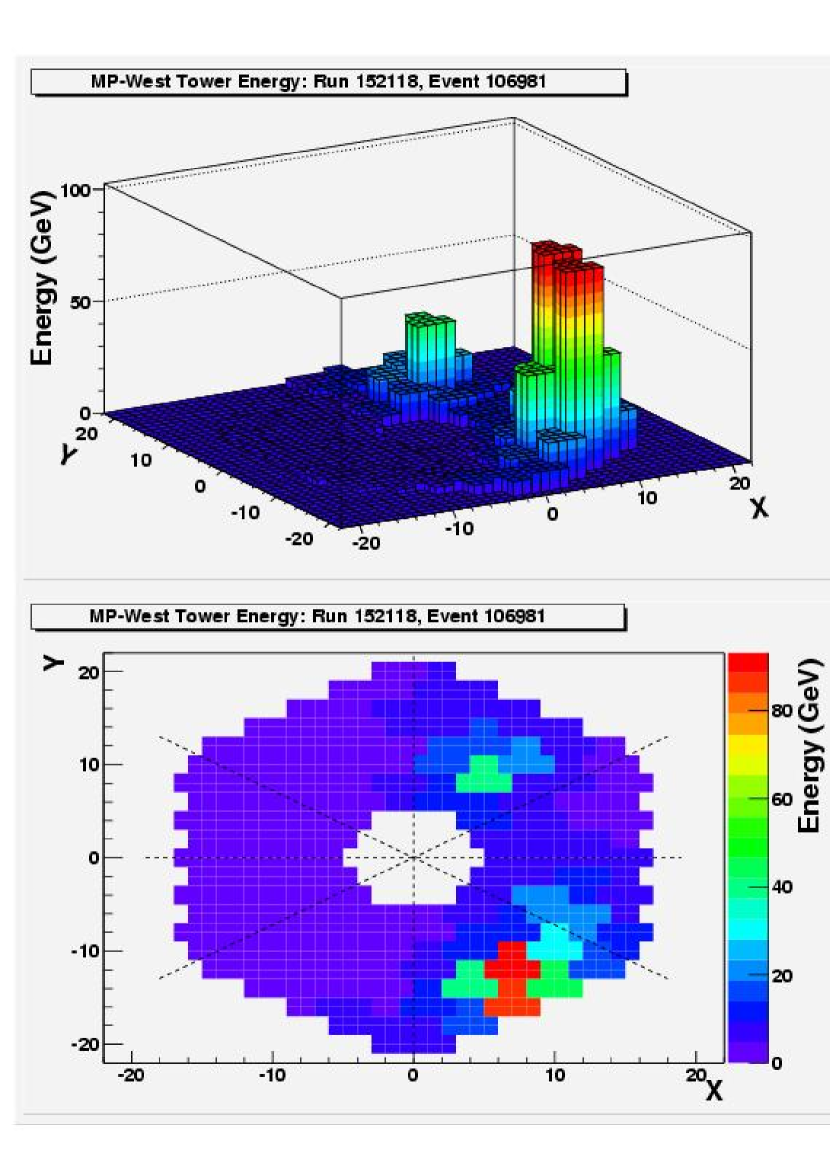
Figure 16 shows an event display with two jets in the MP (the term “jet” is used here to indicate a cluster of towers, which is most likely due to one particle interacting in the MP). This event was selected from a minimum bias data sample.
6 MEASUREMENT OF
Calorimeter information is used to determine the momentum loss of the anti-proton,
| (1) |
which is calculated using the rapidity () and transverse energy () of all calorimeter towers including the MPs.
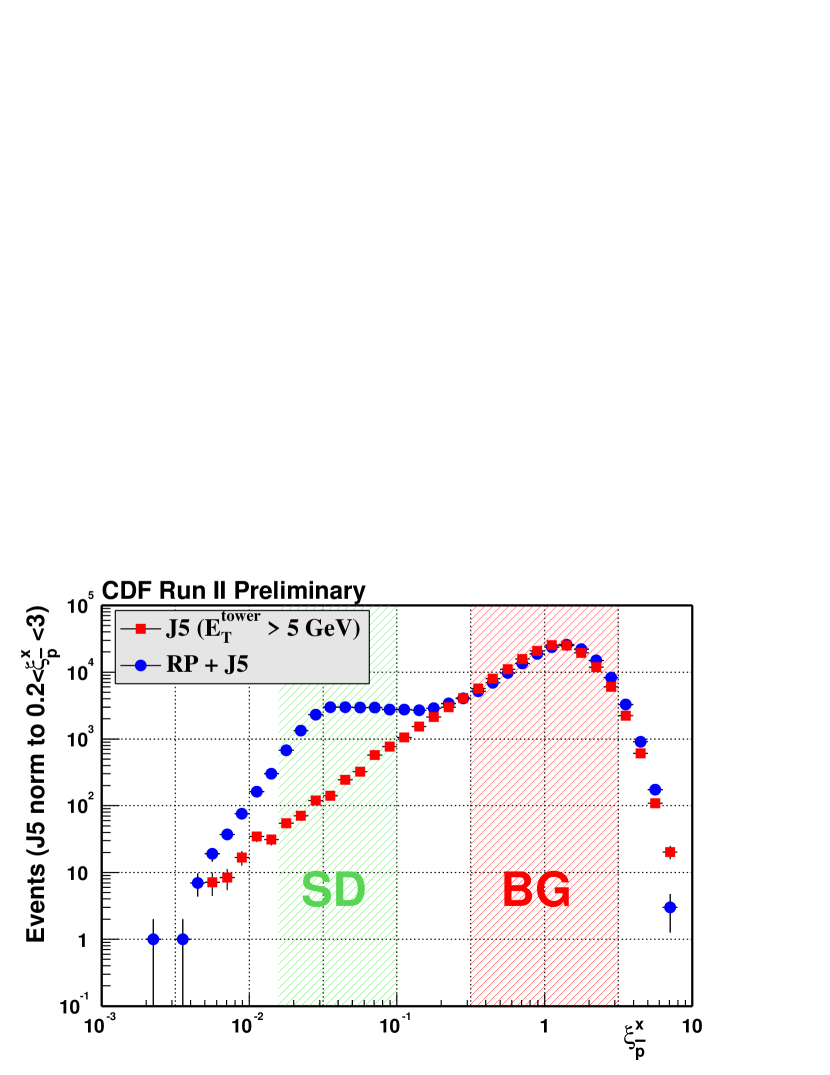
In Run II, a dedicated trigger (RP+J5) selects events with a three-fold RPS coincidence and at least one calorimeter tower with GeV. A further offline selection requires at least two jets of GeV and . Jet energies are corrected for detector effects and underlying event effects. A large number of events are at (Fig. 17), where the contribution is due to two sources: diffractive dijets with a superimposed soft non-diffractive interaction, and non-diffractive dijets superimposed with a soft diffractive interaction. The plateau observed between (SD) results from a distribution, which is expected for diffractive production. The declining of the distribution below occurs in the region where the RPS acceptance is decreasing. The MP plays an important role, as the contribution to from MP towers helps separating diffractive from non-diffractive events. The large peak at in Figure 17 would in fact rest on top of the SD region () without the inclusion of the MP towers in the calculation of .
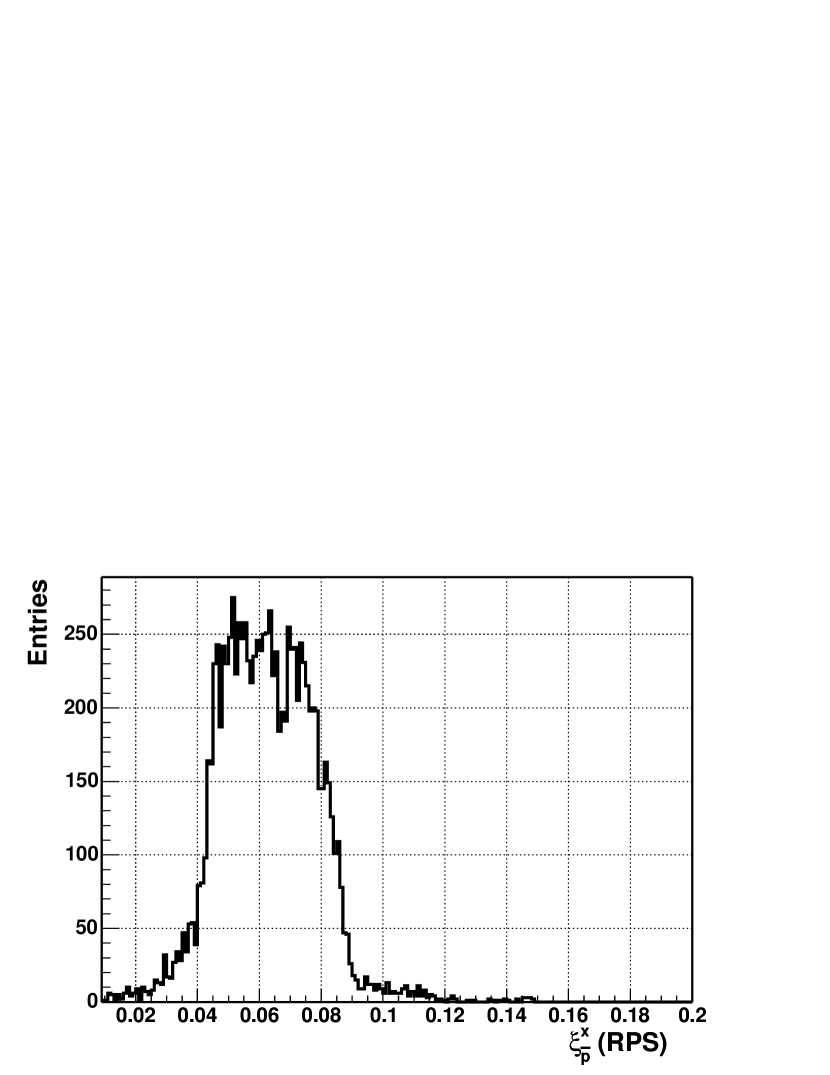
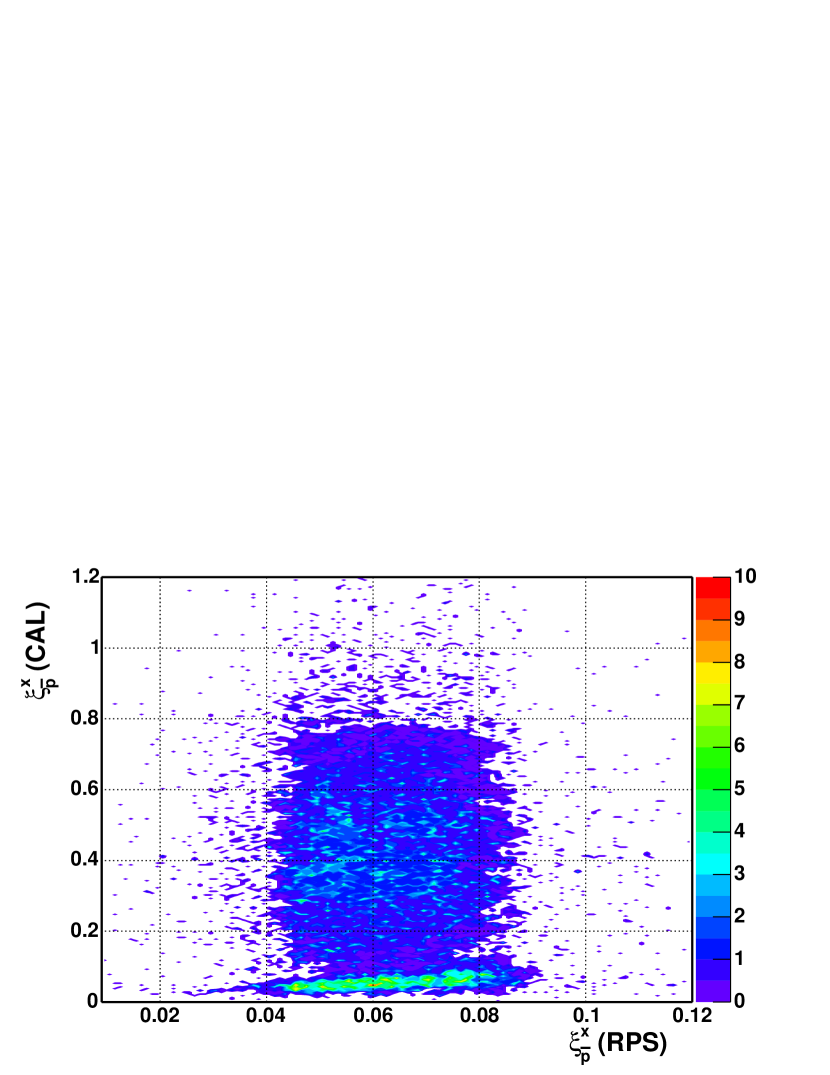
The method of measuring using only calorimeter information through Eq. 1 is calibrated on the antiproton side by comparing the value with that measured by the RPS, (Fig. 18). The two-dimensional scatter plot (Fig. 19) of versus contains data points for tracks reconstructed in the RPS. A linear relationship is observed between and , in the region where both and are confined between values of 0.02 and 0.1. The data points in the region , and are presumed to be due to events with an additional superimposed soft non-diffractive interaction. Without the calorimeter measurement of , these events would represent an inseparable background source to non diffractive events.
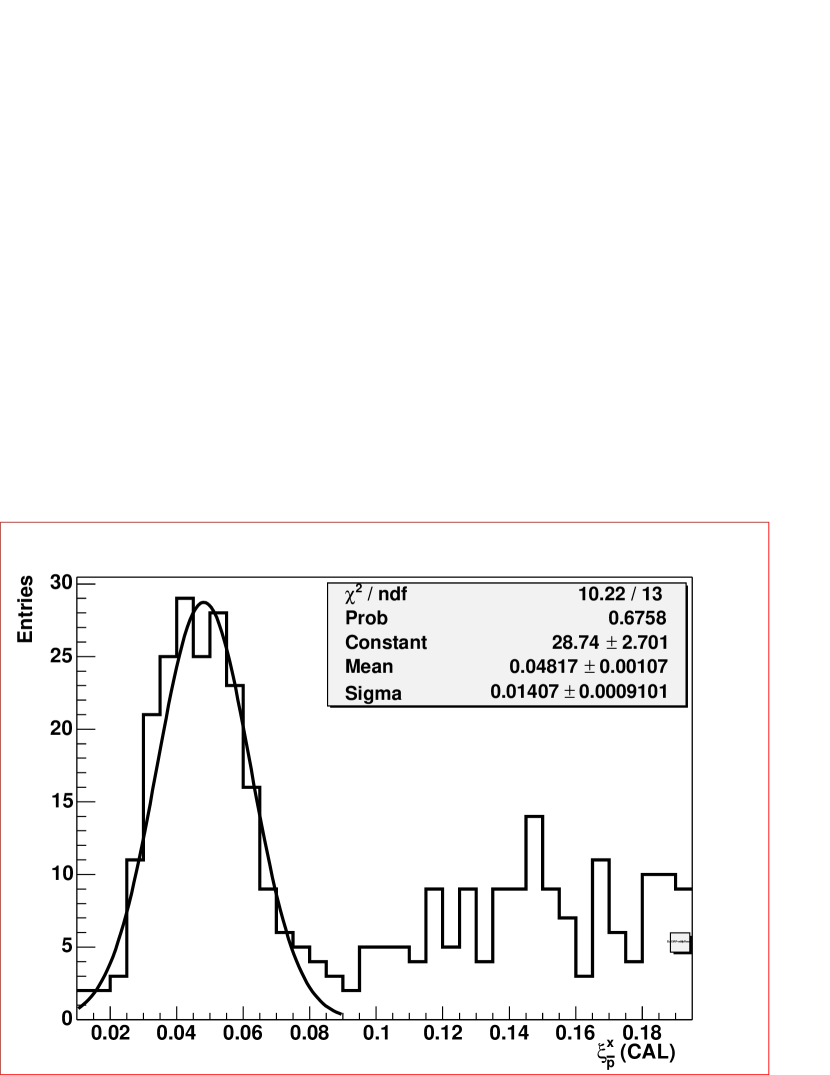
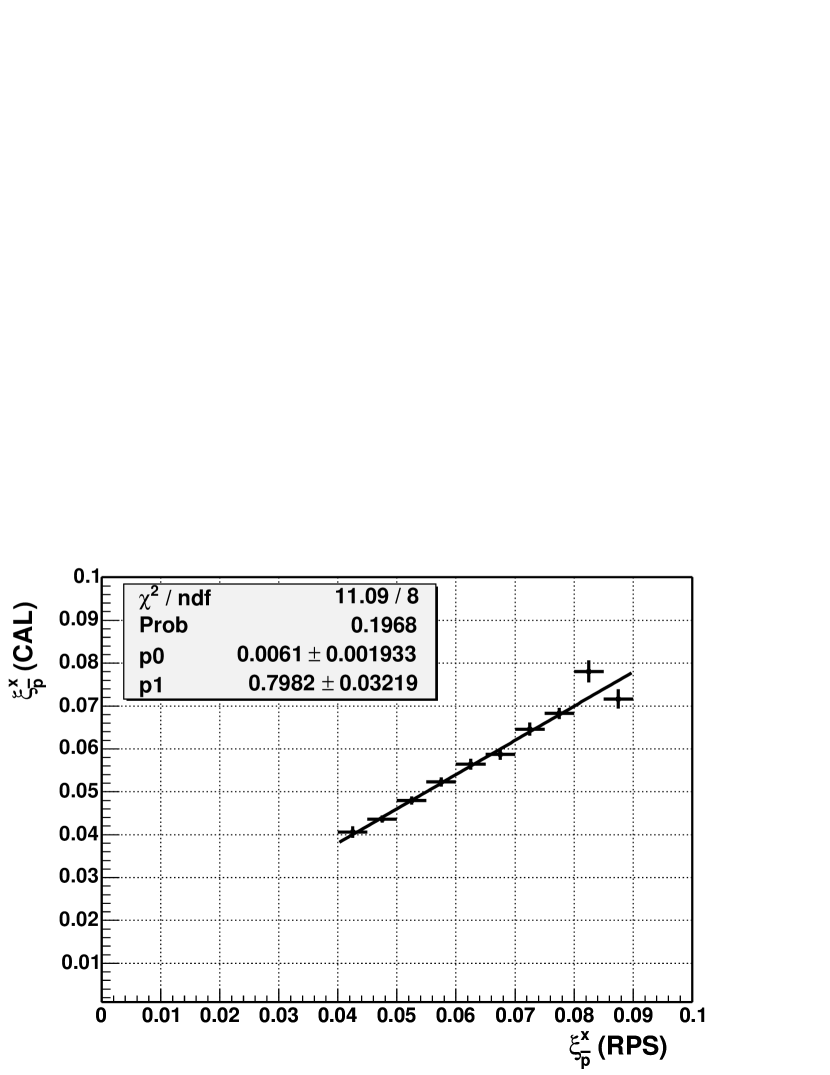
For more detailed studies, data are divided in bins of , and the values obtained using calorimeter information are fitted with a gaussian distribution for each bin. Figure 20 shows, as an example, the data and fit for . The ratio of width to peak position is over the entire region of the data sample. In the region , an approximately linear relationship is observed (Fig. 21) between the central value of and , , with , which is 20% lower than the expected value of . As the relationship between the two values is linear, a simple scaling is sufficient to account for the discrepancy between and .
7 DIFFRACTIVE DIJETS
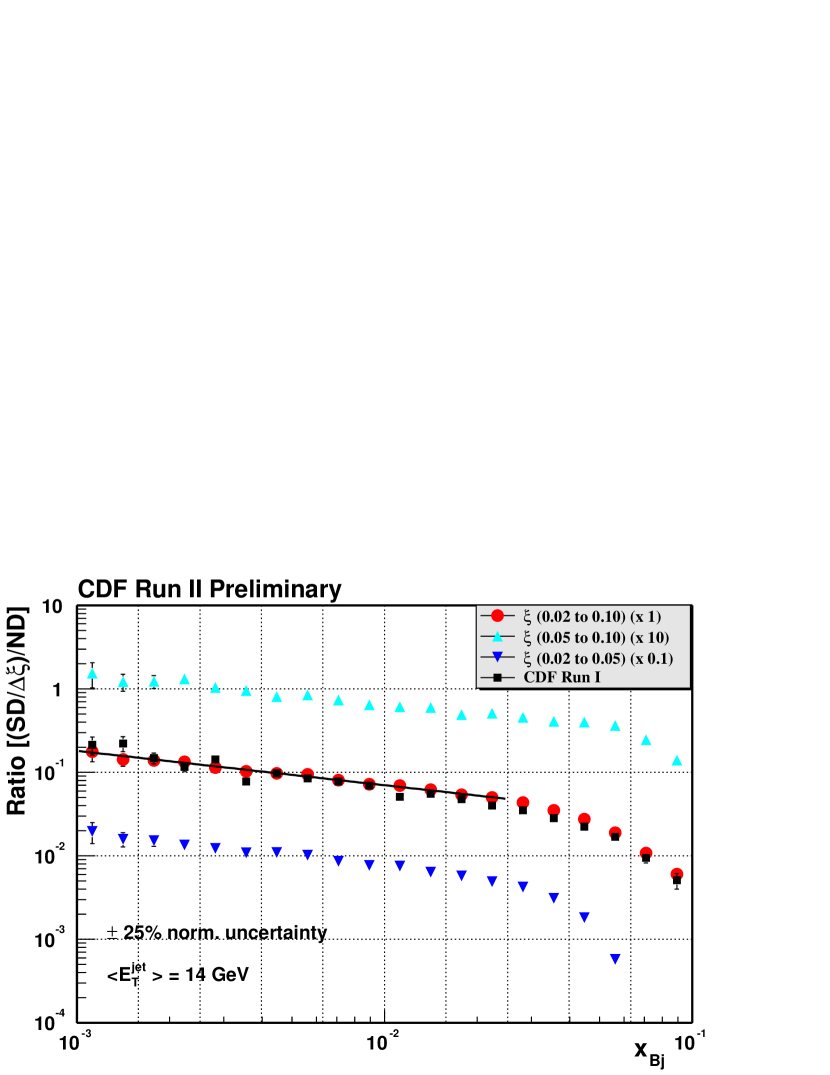
Diffractive dijet events are characterized by the presence of two jets resulting from a hard scattering and a leading antiproton which escapes the collision intact, only losing a small momentum fraction to the pomeron. The gluon and quark content of the interacting partons can be investigated by comparing SD and ND events. The ratio of SD to ND dijet production rates (from Fig. 17) is proportional to the ratio of the corresponding structure functions and can be studied as a function of the Bjorken scaling variable of the struck parton in the antiproton, where corresponds to the pomeron momentum fraction carried by the parton. For each event, is evaluated from the and of the jets using the equation
In Run I, CDF measured the ratio of SD to ND dijet production rates using the RPS to detect leading antiprotons. The CDF result [4] is suppressed by a factor of relative to predictions from HERA data, indicating a breakdown of conventional factorization between HERA and the Tevatron. Correct predictions can be obtained by scaling the rapidity gap probability distribution of the diffractive structure function to the total integrated gap probability [5].
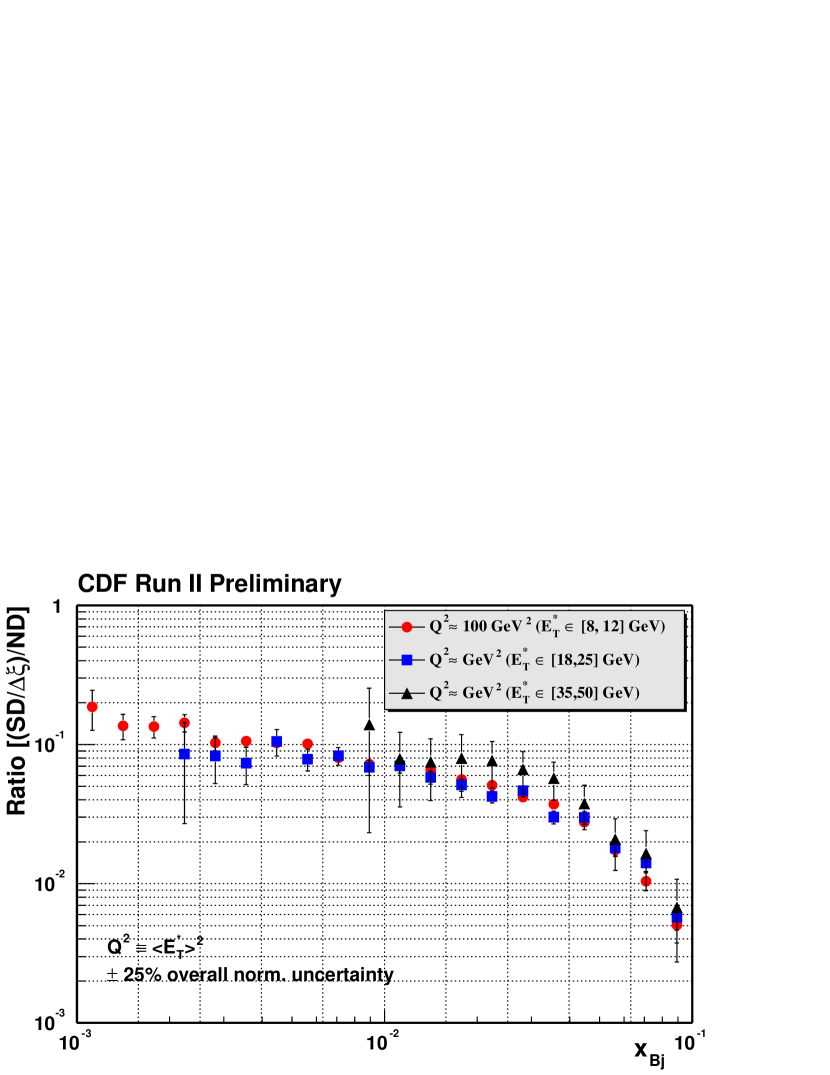
Run II results of a measurement of the SD to ND event rate ratio are consistent with those of Run I (Fig. 22). Furthermore, the jet spectrum extends to higher values than in Run I. A preliminary result indicates that the ratio does not depend strongly on in the range from GeV2 up to 1600 GeV2 (Fig. 23). The relative normalization uncertainty cancels out in the ratio. This result indicates that the evolution of the pomeron is similar to that of the proton.
8 CONCLUSIONS
The program for diffractive physics during Run II at the Tevatron includes studies of soft and hard diffraction and of double pomeron exchange. The Forward Detector upgrade project is an essential component of the diffractive program at the CDF experiment. It consists of three components: a Roman Pot spectrometer (RPS), two Miniplug (MP) calorimeters, and seven stations of scintillation counters (BSC). The RPS has been refurbished from the one used in Run I, and the BSCs have been added between the IP and the RPS to reject non-diffractive background events. The two MP calorimeters were designed to measure the flow of the event energy in the very forward rapidity region.
With the detectors installed, a study of their performance and some of the first results obtained have been discussed here. In particular, a measurement of the anti-proton momentum loss using calorimeter information (including the MP) was presented. The results show a linear relationship with the measurement obtained from RPS tracking data. Results also indicate that RPS tracking data alone are not sufficient to separate diffractive events from non-diffractive background. The contribution of the MPs to the measurement of allows further discrimination, necessary to reject multiple interactions. Furthermore, a first measurement performed with the Forward Detectors during Run II re-established the Run I measurement of the diffractive structure function as the ratio of diffractive to non-diffractive event rates.
The design of the MP calorimeters, capable of working in a high luminosity environment and measuring the energy and lateral position of particles, is suitable to be further exploited in the era of the Large Hadron Collider at CERN to extend diffractive physics studies.
References
- [1] See for example, K. Goulianos, “Measurements of diffractive processes at CDF”, Pub. Proceedings 14th Topical Conference on Hadron Collider Physics (HCP 2002), Karlsruhe, Germany, Sept. 29-Oct. 4, 2002, FERMILAB-CONF-02/291-E.
- [2] The terms rapidity and pseudorapidity are used interchangeably. The pseudorapidity is defined as , where is the polar angle with respect to the proton beam direction. The azimuthal angle is denoted by , and the transverse energy of a jet, , is defined as .
- [3] K. Goulianos et al., “The CDF Miniplug calorimeters”, Nucl. Instr. Meth. A 496 (2003) 333; M. Gallinaro, “Prospects for Diffractive Physics with the CDF Forward Detectors at the Tevatron”, hep-ex/0205030; Pub. Proceedings LAFEX International School on High-Energy Physics (LISHEP 2002) FERMILAB-CONF-02/121-E, and references therein.
- [4] T. Affolder et al. (CDF Collaboration), Phys. Rev. Lett. 84 (2000) 5043.
- [5] K. Goulianos (for the CDF collaboration), Nucl. Phys. B 71(1999) 368-377.