Comparative study of radio pulses from simulated hadron-, electron-, and neutrino-initiated showers in ice in the GeV-PeV range
Abstract
High energy particle showers produce coherent Cherenkov radio emission in dense, radio-transparent media such as cold ice. Using PYTHIA and GEANT simulation tools, we make a comparative study among electromagnetic (EM) and hadronic showers initiated by single particles and neutrino showers initiated by multiple particles produced at the neutrino-nucleon event vertex. We include all the physics processes and do a complete 3-D simulation up to 100 TeV for all showers and to 1 PeV for electron and neutrino induced showers. We calculate the radio pulses for energies between 100 GeV and 1 PeV and find hadron showers, and consequently neutrino showers, are not as efficient below 1 PeV at producing radio pulses as the electromagnetic showers. The agreement improves as energy increases, however, and by a PeV and above the difference disappears. By looking at the 3-D structure of the showers in time, we show that the hadronic showers are not as compact as the EM showers and hence the radiation is not as coherent as EM shower emission at the same frequency. We show that the ratio of emitted pulse strength to shower tracklength is a function only of a single, coherence parameter, independent of species and energy of initiating particle.
pacs:
96.40.Pq,95.85.Bh,95.85.Ry,29.40.-nI Introduction
Ultrahigh energy (UHE) neutrinos, neutrinos with energies on the order of a PeV and above, are predicted at some flux level by most models of the highest energy astrophysical processes observed in the Universe. Moreover, observations of cosmic rays above energies where gamma-nucleon thresholds open up imply the existence of cosmogenic, or Greisen-Zatsepin-Kuzmin (GZK), UHE neutrinosfwsgzk . Ultrahigh energy neutrino detection will probe interactions at energies well beyond the reach of man-made accelerators, while bringing us directional and internal information about the fantastically energetic sources.
A standard method of UHE neutrino detection relies on showers initiated by the electrons and hadrons produced in neutrino-nucleon interactions. Unlike muons and taus, electrons and hadrons dump their energy very quickly in matter through electromagnetic and strong interactions. These showers produce radio and optical signals askaryan1 , can be detected in detectors like RICE ketal1 ; ketal2 and AMANDA amanda , and by those near deployment like ICECUBE icecube , under development like ANITA anita , or in outline stage like SALSA salsa or X-RICE xrice . The high degree of transparency of cold ice and salt to radio transmission make Antarctica or large salt domes attractive for radio detection schemes like RICE, ANITA or SALSA. This paper extends earlier studies on the signal production and propagation in cold ice. It is readily adaptable to salt, as well.
Though considerable work has been done on shower simulations of single particles in ice in different approximations at high energies zhs ; amz ; retal , most of the effort has focussed on EM showers and the pulses they produce. The initial flux limit from the RICE group, for example ketal1 , reported an upper limit on flux alone. This was conservative, in the sense that only the electron shower was used in calculating the pulse from a charged current (CC) interaction, without the hadronic component and with no neutral current (NC) interactions of included. No or interactions were treated in the main analysis, though estimates of hadronic contributions were discussed and presented in an auxiliary table. More recently the preliminary results of the analysis on an expanded subset of data ketal2 were reported, in which the hadronic contributions to the pulses from CC were estimated and included in a preliminary, updated limit. Detailed hadronic shower and pulse studies and determination of the degree to which hadronic and electromagnetic components are coherent were not available in that study. Toward filling this gap we report here: (i) Full 3-D simulations of EM showers to a PeV and hadronic showers to 90 TeV for single hadrons. (ii) Direct, full simulation of the showers initiated by charged current interactions of all neutrino flavors, up to a PeV. (iii) Time structure analysis of the EM, hadronic, and neutrino showers and discussion of the sources of difference between their pulse strengths. (iv) A universal relationship between track length and emitted pulse strength, independent of shower type or energy.
II Overview of PYTHIA/GEANT Simulations and Calculation of Signal Strength
For present purposes, we take our target and detection volume to be a kilometers-cubed volume of cold ice, with an instrumented volume that is a small fraction of this. Operationally, the calculations break into two stages: (1) neutrino interactions with hadronic targets to produce a lepton or neutrino plus multi-hadron final state (with PYTHIA pyth ) (2) an electromagnetic (EM) and hadronic shower (from charged current (CC) events) or only hadronic shower (from all neutral current (NC) events and and CC events 111We do not include the rare case of catastrophic bremstrahlung events from final state muons in the CC interaction, and the -decay in the CC interaction. The decay length above 10 PeV is a kilometer or greater.) (with GEANT geant ) and the real time calculation of the EM pulse generated by the shower particles. The output field can be described as a pulse of field a few nanoseconds long moving out from the interaction point on a Cherenkov cone of half angle 560 and Gaussian width of several degrees zhs . The width of the cone is frequency dependent and, above the Landau-Pomeranchuck-Migdal (LPM) effect threshold, energy dependent amz . The LPM threshold is above the energies we cover here.
To explore hadronic shower-generated pulses in detail, we expand considerably on earlier GEANT- based shower and pulse studies retal . We use Geant4.5.2 to push EM shower analysis to 1 PeV and also include the same analysis of , , and proton hadron-induced showers near 100 TeV. Beyond 100 TeV, the energy limitations on some of the input hadron cross sections prevent full development of the shower with GEANT4.5.2 222We are pushing at and beyond the boundaries of directly tested physics simulations in our PYTHIA and GEANT applications. The results we quote are reasonable indicators of the physics above a TeV, but far from the last word.
To simulate neutrino induced showers and the radio frequency pulses they produce, we use PYTHIA6.205 to simulate neutrino-nucleon CC interaction. The PYTHIA output data files are fed to GEANT and relevant shower and field parameters calculated as the shower simulation proceeds. The Fourier transform of the electric field in the Fraunhoffer limit is calculated for each track segment of every particle in the shower and the contributions of the track segments to the total field are summed vectorially, as described in zhs . We follow the standard practice and report the magnitude of the field at a given angle and frequency multiplied by the distance from the start position of the shower to the position of the observer. This value is a function of frequency, angular position of the observer and energy of the initiating particle. We generally refer to this as “the pulse”. The phase of the field produced by each track segment depends upon the track start and stop times and initial track position, which feeds local information into the total pulse.
We report here the essential features of showers and the pulses they generate. We want to find out whether the features of hadron induced showers and pulses at a given energy are similar to EM features at the same energy, whether the comparison is energy dependent, and whether the multi-hadron final states from CC interactions produce pulses that are essentially coherent with the pulse the electron produces. We consider electron and CC induced events first and then turn to hadron and and CC-induced events. The simulation results of CC-induced events of and can also be used to estimate the results for NC-induced events as both are initiated hadronically (tau and muon decay lengths are large as compared to the typical shower depths at high energies. Hence, for a given value of inelasticity, we expect and CC-induced showers to be scalable to the NC-induced events with the same inelasticity value).
The simulations were done in 3-D, including all the hadronic and EM physics processes involved. For each particle except neutrinos, we have simulated 100 showers at 100 GeV, 50 showers at 1 TeV, 10 showers at 10 TeV, single showers at 90/100 TeV and 1 PeV. For the neutrinos we have simulated 100 showers at 1 TeV, 30 showers at 10 TeV, and 5 showers at 100 TeV. The mean deviations of the non-EM numbers given in Table 1 are in the range 1-8%; although we cannot directly determine the error in the data at 90 TeV and above, as we have only single showers, we expect it will certainly be below 10% because a single shower will have many times the number of particles in a 10 TeV shower, so the relative fluctuations will be smaller in a shower around 100 TeV and above.
II.1 Electron and Electron-Neutrino Charged Current Induced Pulses
As in earlier work all field calculations are done in the Fraunhoffer limit , where is detector-shower distance, is the wavelength, and is the shower penetration distance. The simulation is run in cold ice with , and with , , and radiation length=38.8cm, as calculated by GEANT.
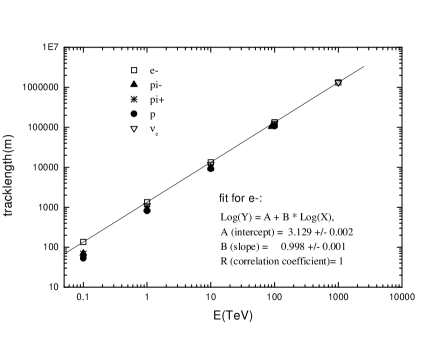
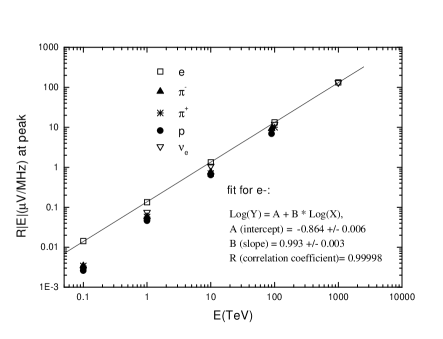
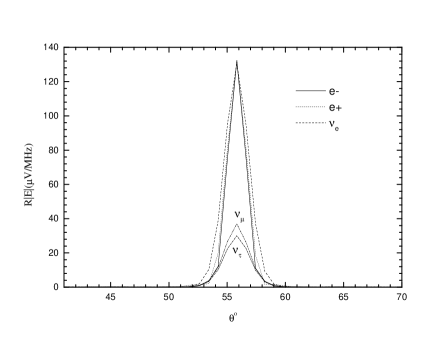
Injecting electrons at 0.1, 1, 10, 100, and 1000 TeV, we calculate , the total weighted track lengths projected along shower axis, shower charged particle profiles, frequency dependence of the field () times the distance R to the detector (the field strength decreases as 1/R in the Fraunhoffer limit), and angular dependence of the field at 1 GHz. The results for key parameters are shown in Table 1 . The electron is the first entry at each energy. As is apparent from the numbers, the projected track length difference () between the negative and positive particles and the pulse height at a fixed frequency and at the Cherenkov angle grow linearly with energy to high accuracy. This is shown in Figs. 1 and 2, where the open boxes are the electron data and the fits are shown on the graph. These results agree with all earlier work zhs ; retal . The angular distribution is shown in Fig. 3 for in the region of the Cherenkov angle. This plot clearly shows the rapid suppression of signal off the Cherenkov cone. Injecting 1, 10, 100, and 1000 TeV neutrino-nucleon interaction output from PYTHIA, we calculate the corresponding quantities with elasticity at each energy. We choose the same at each energy so that we can determine whether the hadronic component of the entire shower becomes more efficient at generating pulse strength with increasing energy. This requires keeping the hadronic fraction of the total energy constant as we change energy. The choice turns out to be big enough so that hadronic fluctuations from shower-to-shower are reasonably small and at the same time the electron does not completely dominate the signal in the case. The trends in the behaviour with neutrino energy that we describe below are true regardless of the -value chosen.
In Table 1 , selected examples of these calculations are given at each energy. As is well known gqrs , the elasticity peaks at 1 and the average grows slowly with energy, starting at ???? at 0.1 TeV and reaching about 0.74 at . In incident neutrinos of given flavor and energy, we assembled a sample within our chosen range of by generating PYTHIA events and selecting those in our chosen range until our sample size was reached. As mentioned above, our aim is to study the pulse-production efficiency of the hadronic component of neutrino showers as a function of energy. In other words, is the pulse growth slowers than, the same as, or faster than the growth in hadronic energy? We need the fraction (), of hadronic energy in the shower to be held constant as we raise the energy to answer this question. Since average decreases as the energy increases, the average at a given energy is not the best choice for our purpose here. For application to simulation of signals for an actual experiment, one would not use fixed of course. At a given value, the fluctuations in shower and pulse parameters decrease with increasing energy and at the same time the results look more and more like electron results; the event at 1 PeV gives projected, weighted track length and pulse values that are essentially the same as those of the electron event. This is clearly shown in Fig. 3 as well.
The trend of our simulation data shows that, as the primary energy increases, the hadronic component of the events for any value contributes in such a way that the events look more and more like electron events as the primary energy increases. We will see this in a more direct way in the results from single injected hadron, which we describe in the next subsection.
II.2 Hadron, and and CC Induced Pulses
The calculation of the charged pion and proton induced events proceed similarly to those of the electron/positron induced events. There are many more processes included in the hadronic cases, of course; the maximum energy of pion and proton showers is around 100 TeV in GEANT4.5.2, because some cross sections, such as the kaon- total cross sections, are extrapolated only to about 10 TeV. Nonetheless, we can gain valuable insight from the comparison between electron and hadron-induced events. Since the low energy tail of a shower is essentially EM, and the excess charge develops in this low energy region, the hadron shower should behave similarly to the EM showers to the extent that gammas from decay dominate the end of the shower. This should be a better picture as energy increases and fluctuations in particle species wash out.
The essential features of the comparisons between the electron and hadron-induced showers are summarized in Figs. 1 and 2. The projected weighted track length and pulse height at Cherenkov angle at fixed frequency grow linearly with energy. It is clear from the graphs (Figs. 1 and 2) and from a look at the numbers themselves (Table 1) that the efficiency of converting hadron input energy increases with energy, as we emphasize further below. It is important to note that a given weighted projected track length in a hadronic shower is not as efficient in producing the radio signal as is the same length of EM shower. However, this difference between the hadronic and the EM showers shrinks at higher energies. As we will discuss in the next section, this is because of the difference between hadronic and EM showers in the distribution in space of the particles contributing to the weighted, projected track length.
As we see in Fig. 2, the pulse outputs from all the showers are nearly equal as one approaches 1 PeV shower energy. We expect that the hadron curve will flatten out and follow the electron at higher energies, though we cannot verify this with the current GEANT capabilities. The tendency for hadron events to act more like EM events is consistent with our observation earlier that the events act more and more like electron events as we raise the injection energy; the hadron component adds coherently with the EM component.
The and CC results are the final entries at each energy. Here again it is clear that the hadronic component of the final state is becoming more efficient in converting energy to EM pulse strength as the injection energy increases. For example, the average or event at 10 TeV with our illustrative value produces a significantly larger fraction of the electron pulse than it does at 1 TeV. The corresponding comparison at 1 PeV for and events produce noticeably different shower and pulse results at the same energy and elasticity. We looked at the detailed structure of the PYTHIA output for these and lower energy cases and found that the larger track length and larger pulse result correspond to the event with larger content in the PYTHIA output (GEANT4 input) (and, ultimately, higher shower EM-content; this explains why produces a stronger pulse than with the same E and in one example and weaker in another. Even at 1 PeV, there are significant fluctuations in the species and subenergy compositions of the final states and these fluctuations produce corresponding shower and pulse fluctuations. The trends in Figs. 1 and 2 clearly indicate that above 1 PeV these fluctuations damp out and hadronic components of the showers act like electromagnetic showers of the same energy. The LPM effect is expected to set in at higher energies and elongate the EM showers but not the hadronic showers amz .
We have also calculated the frequency spectrum of the pulses at Cherenkov angle from each type of shower at each energy. In summary, we find the spectra from different types of shower look more and more similar to each other as the shower energies increase. By 10 TeV, they all rise sharply from zero at zero frequency, peak at several GHz, fall and then level out in the 10 to 20 GHz region and are essentially flat above that. The frequency behavior up to 1 TeV is discussed for electron showers in S. Razzaque et al. retal , where, as in our present study, the sharp turn over of the spectrum does not set in until 1 TeV. We find that the hadron and hadron dominated and do not show this behavior until and order of magnitude higher energy.
III Time structure analysis of hadronic and EM showers
As far as we are aware, direct time development of EM, hadronic and neutrino-induced showers in ice has not been reported. Here we describe several analyses to clarify the reasons behind the generally improved efficiency in radio pulse production by hadronic showers of increasing energy. We focus on several direct-time evolution representatives of the shower content for this purpose. The weighted, projected track length =, described earlier, is known to be a good indicator of pulse height produced by the EM showers zhs . As Table 1 shows, this is not the whole story in understanding the difference between the pulses produced by electron showers vs. hadron showers at lower energies. For example, at 1 TeV, the ratios of for , , and are 1.49, 1.49, and 1.65, respectively, while the corresponding ratios are 2.24, 2.48, and 2.83. The corresponding comparisons for , and are 1.16, 4.95 and 4.95 compared to 1.53, 11.0 and 11.0. The ratio of pulse to track length is larger in the EM than in the hadronic showers and, to the extent they are dominated by hadrons, the neutrino showers. The EM showers are evidently producing more coherence in the Cherenkov emission. Intuitively one expects the degree to which the emission is coherent depends upon the degree to which the charged particles, and therefore the charge imbalance, are concentrated in a small volume, acting like a single, point charge.
To get a visualization of these features as the shower develops, in Figs. 4 and 5 we plot the X, Y, and Z components of the charged particle position versus time at each step in every track’s development in a 100 GeV electron and proton showers. The lightest shaded points are X, next darker Y, and the darkest is the Z component of all charged particle positions as a function of time. Beyond 50 ns, there are no tracks in electron showers and only a tiny percentage in hadron showers. The speed-of-light line in cold ice is designated by a heavy dark line. A comparison between the plots vividly shows that the X and Y excursions of electron shower particles are smaller than those of the proton shower of the same energy. The concentration of the Z components near the speed of light in vacuum is correspondingly higher than that in the proton shower. These plots indicate that the coherence of the emission from the electron shower should be greater than the one from a proton shower, which correlates well with the fact that the emission is weaker from the proton shower at 1 GHz than is expected just from the comparison.
Finally we examined the degree to which the value of is determined by the particles which are highly relativistic and are hugging a point moving with the speed of light along Z-axis. For energies of 0.1 TeV, 1 TeV, 10 TeV and 90 TeV 333At energies around 100 TeV and above, hadronic shower runs crash because at least one daughter kaon energy is above the maximum simulated in the current version of Geant., we compute the value of for just those tracks with points within a distance
| (1) |
as shown in Fig. 6 (only two dimensions are shown). The choice a = 0.15m is guided by the wavelength at 1 GHz. This choice, though not unique by any means, is satisfactory to make our point about the role of compactness and coherence 444For example the radial distribution of net charge for the whole shower suggests a value smaller than 0.15m, as shown in Razzaque et al.zhs . The idea is simply that charge dispersed farther from the shower core will tend to degrade coherence. We have calculated the projected weighted-track lengths of the particles within the shaded region of the sphere with radius a=0.15m (see figure 6) and the projected weighted-track lengths due to all the charged particles in the shower.
In Table 1 we show the ratio for the showers initiated by electrons, pions, protons and the three flavors of neutrinos at various energies. As we see here, this ratio has a constant value of 0.90 for the electron initiated showers between energies 100 GeV-1 PeV. This means 90% of the projected weighted-track length comes from a compact region defined by Eq. 1. On the other hand this ratio is smaller for a proton, a pion, or a neutrino shower and it improves as we go to higher energies. For EM showers, the value of has long been recognized as an extremely reliable measure of the pulse height produced at Cherenkov angle for frequencies at and below 1 GHz. We emphasize here the added insight gained by treating separately the track length of the core region defined in Eq. 1, and the track length outside this region. If we look at Table 1 and the Figs. 2 and 3, we see as the ratio for hadronic showers approaches that of the electron shower (Table 1 ), the weighted, projected track lengths and pulse heights of the hadronic showers also approach those of the electron showers. The well established linear relationship between electron shower projected track length and energy and between pulse height and energy is expressed in terms of our “compactness” parameter as a constant value for all electron showers between 0.1 TeV and 1.0 PeV.
As is clear from the numerical results summarized in Table 1 and our discussion above, the pulse strength at the Cherenkov angle at a given frequency is related to the weighted, projected track length, , and the ratio . The data suggest that the ratio of to is a function of that is independent of the particle type and energy. For example, there are three entries with : at 10 TeV, at 100 GeV, and at 1 PeV; these have values , 9.2 and 9.1 , respectively. This and similar results in Table 1 indicate there is a relationship
| (2) |
where is defined above and one determines the function from the data. We find that a third degree polynomial in fitted to the data plotted as vs. gives a remarkably good description of the data in Table 1 555The polynomial is , with , and . To fit the data above 1 TeV, a good quality linear fit can be found. Given the value of and , one reproduces the value of within a few percent for all but a couple of the 29 entries, and those two are good to better than about . As remarked in footnote 21, above 1 TeV, a linear fit works quite well. This universal feature supports our picture that the key factor that relates the pulse at a given frequency to the weighted, projected track length for showers induced by any particle in the energy range we consider is the degree of coherence of the emission, as determined by the compactness of the relativistic core of the shower as it moves along through the medium.
IV Summary and Conclusions
Ultrahigh energy neutrinos will provide a uniquely clear window to explore fundamental physics and astrophysics processes at the highest known energies. These neutrinos produce huge particle showers when they interact with dense matter. The showers then produce coherent, Cherenkov radio signals, the strength of which depends on the net charge in the shower, on the track length projected along the shower axis and on the degree of compactness of the shower. All of these factors increase with neutrino energy. Combined with a radio-transparent medium such as cold ice or pure salt, the radio detection technique becomes increasingly powerful as energy rises in the UHE regime.
The particle content early in a shower depends on the flavor of the neutrino producing it. Electron-neutrino showers immediately have a heavily electromagnetic character, which dominates the hadronic component on average. On the other hand, the muon-neutrino and taon-neutrino showers are essentially hadronic in character. Below a PeV our simulation results show that hadronic showers are not as efficient in producing radio signals as EM showers. Though the pulse strengths produced by hadron showers increase with energy, the net charge, the weighted, projected track length, and the corresponding pulse strength are all smaller than those of the EM showers at the same energy. In addition, we found that the pulse strength per weighted, projected track length is smaller for the hadronic showers than for the electromagnetic ones. However, the key result of our study is that the differences in the efficiencies of pulse production disappear as one goes to higher and higher energy. The same is true of the comparisons between the neutrino showers and the electron showers. Extrapolating hadronic shower results to 1 PeV from our highest simulation results at 100 TeV, we find that the hadron and electron showers at a PeV give essentially the same pulse strengths. Moreover, at 1 PeV, the simulated shower with elasticity of 0.65 is indistinguishable from the electron shower at the same energy. The and showers continue to show convergence toward electron shower behaviour when the elasticity factor in the events is accounted for.
In a new type of study employing time- and space- structure of the showers, we showed that the low energy electron showers are significantly more compact than the corresponding hadronic showers and neutrino showers at low energies. The coherence is directly related to the compactness and therefore to the efficiency of converting charge imbalance and track length into EM pulses. We show that a simple, universal formula nicely describes this aspect of the simulation data. Again, as one goes to ultrahigh energies, hadronic and EM showers become equally compact and equally coherent and, consequently, equally efficient in producing radio signals . All the signals rises linearly with energy at ultrahigh energies and with essentially the same normalization. We believe our study develops a detailed account not previously available of how his simple picture emerges in the 100 GeV to 1 PeV energy regime.
We conclude that at and above a PeV, until the Landau-Pomeranchuk-Migdal (LPM) effect becomes importantrrj , the hadronic and electromagnetic showers produce essentially the same pulses at a given energy. In addition, the hadronic and electromagnetic components of the pulses are effectively coherent. Because the LPM effect has bearing on the EM particles that are above LPM threshold, and the EM particles that evolve from UHE hadronic showers up to EeV energies are below this threshold amz , the hadronic showers are predicted to become more effective than the EM showers at producing EM pulses at some point above the LPM threshold. Further study of this important problem is certainly needed and will be the subject of future research.
Acknowledgments
We benefitted greatly from discussions and communications with Dave Besson, Will Chambers, John Ralston, Soeb Razzaque, Dave Seckel, Suruj Seunarine during this course of this work, which was supported in part by The Department of Energy under grant number DE-FG03-98ER41079. Doug McKay thanks the staff and physics group of the Phenomenology Institute at the University of Wisconsin for its hospitality while this work was being completed.
References
- (1) V. Berezinsky and G. Zatsepin, Phys. Lett. 8B, 423 (1969); F. W. Stecker, Astrophys. J. 228 919 (1979).
- (2) G. A. Askar’yan, Zh. Eksp. Teor. Fiz 41, 616 (1961) [Soviet Physics JETP 14, 441 (1962)] and 48, 988 (1965) [21, 658 (1965)].
- (3) I. Kravchenko et al., Astropart. Phys. 20, 195 (2003).
- (4) I. Kravchenko et al., in: ”Proceedings of the 28 International Meeting on Cosmic Rays” (Tokyo 2003), and astro-ph/0112372.
- (5) http://amanda.physics.wisc.edu/.
- (6) http://www.ssec.wisc.edu/a3ri/icecube.
- (7) P. Gorham et al.,JPL proposal A0-01-03-0SS-015 (2001).
- (8) P. Gorham et al., Nucl Instr. Meth. A490, 476 (2002).
- (9) D. Seckel and G. Frichter, Proc. 26th Int. Cos. Ray Conf., Salt Lake City (1999); D. Seckel Proceedings of RADHEP 2000, P. Gorham and D. Salzberg, Eds., AIP Conf. Proc. 579, 196 (2001).
- (10) E. Zas, F. Halzen, and T Stanev, Phys. Rev. D 45, 362 (1992); S. Razzaque et al., Phys. Rev. D 65, 103002 (2002).
- (11) J. Alvarez-Muniz and E. Zas, Phys. Lett. B 434, 396 (1998); J. Alvrez-Muniz, R. Vazquez, and E. Zas, Phys. Rev. D 61, 023001 (2000); J. Alvrez-Muniz, R. Vazquez, and E. Zas, Phys. Rev. D 62, 063001 (2000); J. Ralston and D. McKay, ”Comparing coherent microwave emission from LPM and B-H electromagnetic showers”, in: J. Mathews (Ed.), APS Conference Proceeding No. 220, AIP, NY, 1991; J. Ralston, S. Razzaque and P. Jain, astro-ph/0209455.
- (12) S. Razzaque et al., Phys. Rev. D 65, 103002 (2002), and Phys. Rev. D 69 047101 (2004); J. Alvrez-Muniz, E. Marques, R. Vazquez, and E. Zas, Phys. Rev. D 68, 043001 (2003);
- (13) http://www.thep.lu.se/ torbjorn/Pythia.html
- (14) http://geant4.web.cern.ch/geant4/
- (15) R. Gandhi, C. Quigg, M. H. Reno, I. Sarcevic, Phys. Rev. D 58, 093009 (1998); R. Gandhi, C. Quigg, M. H. Reno, I. Sarcevic, Astropart. Phys. 5, 81 (1996).
- (16) The energy regime in which the LPM effect is important is not entirely clear. J. Ralston, S. Razzaque and P. Jain, astro-ph/0209455.
Figure Captions for Figures 3-6 (separate .jpg files)
FIG. 4: 3-D structure in time of a 100GeV electron shower. The light gray color represents X, dark gray Y, and black Z coordinates. For the Z case, particles below the thick solid line z=c*time/1.8 are moving slower than the speed of light in cold ice.
FIG. 5: Same as figure 4 for a 100GeV proton shower.
FIG. 6: The circle shown here has a radius a=0.15m and is centered at a point that moves with the speed of light in vacuum. The shaded region is defined by Eq. 1 in the text.