SISSA 26/2004/EP
hep-ph/0404103
Reactor Anti-Neutrino Oscillations and Gadolinium Loaded Super-Kamiokande Detector
Sandhya Choubey1,2
and
S.T. Petcov2,1,3,4
1INFN, Sezione di Trieste, Trieste, Italy.
2Scuola Internazionale Superiore di Studi Avanzati, I-34014 Trieste, Italy.
3Yukawa Institute for Theoretical Physics, Kyoto University, Kyoto 606-8502, Japan.
4Institute of Nuclear Research and Nuclear Energy, Bulgarian Academy of Sciences, 1784 Sofia, Bulgaria.
Abstract
We explore the potential of measuring the solar neutrino oscillation parameters in the proposed gadolinium loaded Super-Kamiokande (SK-Gd) detector. Gadolinium dissolved in water can detect neutrons much more efficiently than pure water. This imparts the detector the ability to observe electron type antineutrinos, transforming Super-Kamiokande into a huge reactor antineutrino detector with an event rate approximately 43 times higher than that observed in KamLAND. We simulate the reactor antineutrino data expected in this high statistics detector. We use these prospective data to study the precision with which the solar neutrino oscillation parameters, and , can be determined i) with the SK-Gd detector, and ii) by combining the SK-Gd data with the global data on solar neutrino oscillations. For comparison and completeness the allowed regions of and , expected to be obtained from the data of the solar neutrino and KamLAND experiments, are also presented. We find that the SK-Gd experiment could provide one of the most precise (if not the most precise) determination of the solar neutrino oscillation parameters and .
1 Introduction
At present we have compelling evidences for oscillations of both solar () and atmospheric ( and ) neutrinos, driven by nonzero neutrino masses and neutrino mixing [1, 2]. They have been accumulated over a long period of time in the experiments with solar neutrinos [3, 4, 5, 6, 7, 8, 9, 10], Homestake, Kamiokande, SAGE, GALLEX/GNO, Super-Kamiokande and SNO, in the KamLAND experiment with reactor antineutrinos [11], and in the studies of the fluxes of atmospheric neutrinos by the Super-Kamiokande collaboration [12, 13, 14]. Indications for oscillations of neutrinos have also been obtained in the K2K long base-line experiment [15].
Evidences for oscillations of the solar , induced by nonzero neutrino masses and neutrino mixing [2], have been reported first by the pioneering Davis et al. (Homestake) experiment [16, 17]. They have been confirmed and reinforced later by Kamiokande, SAGE, GALLEX/GNO and Super-Kamiokande experiments. The evidences for mixing and oscillations of the solar have been made compelling during the last three years by the data from the SNO solar neutrino and KamLAND reactor antineutrino experiments [8, 9, 10, 11] (see also, e.g., [18]). Under the assumption of CPT-invariance, the observed disappearance of reactor in the KamLAND experiment, in particular, confirmed the interpretation of the solar neutrino data in terms of oscillations, induced by nonzero neutrino masses and nontrivial neutrino mixing. The KamLAND results [11] practically established the large mixing angle (LMA) MSW solution (see, e.g., [8]) as unique solution of the solar neutrino problem. The solar neutrino and KamLAND data, including the salt phase SNO results, strongly favor the low-LMA solution with [10, 19, 20] eV2 and , and being the neutrino mass squared difference and mixing angle driving the solar neutrino oscillations. The high-LMA solution (see, e.g., [11]), characterized by eV2 and similar value of , is only allowed at 99.14% C.L. by the data [19].
Strong evidences for oscillations of the atmospheric () have been obtained in the Super-Kamiokande experiment from the observed i) Zenith angle dependence of the multi-GeV and sub-GeV -like events [12, 13], and ii) the recently reported observation of an “oscillation dip” in the dependence of the (essentially multi-GeV) like atmospheric neutrino events [14] 111The sample used in the analysis of the dependence consists of like events for which the relative uncertainty in the experimental determination of the ratio does not exceed 70%., and being the distance traveled by neutrinos and the neutrino energy. As is well known, the SK atmospheric neutrino data is best described in terms of dominant two-neutrino () vacuum oscillations with [13, 14] eV2 and maximal mixing, . The observed dip is predicted due to the oscillatory dependence on of the and oscillation probabilities. This beautiful result represents the first ever observation of a direct effect of the oscillatory dependence on of the probability of neutrino oscillations in vacuum.
Information on the third mixing angle , present in the case of 3-neutrino mixing which is required to describe the solar and atmospheric neutrino (and KamLAND) data in terms of neutrino oscillations, is provided essentially by the short baseline reactor antineutrino experiments CHOOZ and Palo Verde [21]. Using the range of allowed values of found in the latest SK data analysis [13, 22], a combined 3- oscillation analysis of the solar neutrino, CHOOZ and KamLAND data gives (at 99.73% C.L.) [19]. A somewhat more stringent limit was obtained in the global analysis of all the available solar, atmospheric and reactor neutrino data, performed in [23]: (99.73% C.L.).
Neutrino flavor oscillations have also been claimed to have been observed in the LSND experiment [24]. This interpretation of the LSND results is being currently tested in the MiniBOONE experiment [25].
After the remarkable progress made in the last few years in establishing the existence of neutrino oscillations, one of the main goals of the future experimental studies of neutrino mixing is to measure with high precision the parameters which drive the solar and atmospheric neutrino oscillations, , , and . The potential of the current and future experiments for high precision determination of the solar neutrino oscillation parameters, and , was studied recently in [26, 27, 28, 29] (see also [30]). The precision in the measurement of and , which can be reached in the Borexino and the so-called LowNu experiments, was explored in [26, 27]. The impact of the prospective increase in statistics of the KamLAND data on the determination of and was investigated in detail in [19, 26, 29]. If the measured at KamLAND is simulated at a point in the low-LMA region, the allowed 3 area in the high-LMA zone reduces in size in the case of 0.41 kTy of data, and disappears if the statistics is increased to 1.0 kTy [19]. In this case will be determined with high precision. If, however, the spectrum observed in KamLAND conforms to a point in the high-LMA region, the conflicting trend of solar and KamLAND data would make the high-LMA solution reappear at 90% C.L. and the determination of would remain ambiguous [19]. In both cases cannot be determined with high precision. Actually, reaching high accuracy in the measurement of (e.g., 10% error at 1) is a rather challenging problem. It can be solved by performing a dedicated reactor experiment [26, 28], or by the future solar neutrino experiments LENS and XMASS, aiming to measure the pp neutrino flux [31, 32].
Recently it was proposed in [33] to dope the SK detector with Gadolinium by dissolving 0.2% gadolinium trichloride in the water 222The authors of [33] called “GADZOOKS!” the resulting detector. We will use in what follows the abbreviation SK-Gd for it.. The added gadolinium would make it possible to detect the neutrons, released in the capture on protons, with a relatively high efficiency. This would allow the SK experiment, in particular, to detect the reactor antineutrinos coming from the numerous powerful nuclear reactors located in Japan, thus transforming SK into a huge reactor antineutrino detector with an event rate approximately 43 times higher than that observed in KamLAND. In this paper we study the prospects of measuring the solar neutrino oscillation parameters by observing the reactor antineutrino oscillations in the proposed gadolinium loaded SK (SK-Gd) experiment. Since and the mixing angle is restricted to be relatively small, the third (heaviest) neutrino with definite mass is expected to have negligible impact on the determination of the values of the solar neutrino oscillation parameters 333The effect of can become important if is measured with a precision, which, as we will see, is higher than the precision which can be reached in the SK-Gd experiment. in the experiment of interest and we perform our study in the framework of the 2 mixing scenario ().
We begin in Section 2 with an overview of the currently allowed ranges of values of the solar neutrino oscillation parameters by the existing global solar neutrino and KamLAND data. We present further the regions in the plane, which are expected to be allowed after taking into account future higher statistics and lower systematic data from SNO and from KamLAND experiments. The SK-Gd detector is considered in Section 3, where we discuss the assumptions made to simulate the data in this proposed modification of the SK experiment, as well as the procedure used to statistically analyze the simulated data. We investigate further the potential of the SK-Gd experiment in reducing the uncertainties in the values of and . In Section 4 the expected results from a combined analysis of the solar neutrino data and the prospective SK-Gd simulated spectrum data are given. In Sections 3 and 4 we also discuss the bounds on and one would obtain if some of the reactors in Japan would be “switched off”. Section 5 contains the main conclusions of our study.
2 Solar Neutrino Oscillation Parameters from the Solar Neutrino and KamLAND Data
| Data | 99% CL | 99% CL | 99% CL | 99% CL |
| set | range of | spread | range | spread |
| used | of | of | in | |
| 10-5eV2 | ||||
| only solar | 3.2 - 14.9 | 65% | 25% | |
| solar+162 Ty KL | 5.2 - 9.8 | 31% | 25% | |
| solar with future SNO | 57% | 21% | ||
| solar+1 kTy KL(low-LMA) | 6.5 - 8.0 | 10% | 23% | |
| solar+2.6 kTy KL(low-LMA) | 7% | 22% | ||
| solar with future SNO+1.3 kTy KL(low-LMA) | 8% | 17% | ||
| 3 yrs SK-Gd | 7.0 - 7.4 | 3% | 19% | |
| 5 yrs SK-Gd | 15% | |||
| solar+3 yrs SK-Gd(low-LMA) | 3% | 15% | ||
| solar+3 yrs SK-Gd(high-LMA) | 3% | 21% | ||
| solar with future SNO+3 yrs SK-Gd(low-LMA) | 3% | 14% | ||
| solar with future SNO+3 yrs SK-Gd(high-LMA) | 3% | 19% | ||
| 3 yrs SK-Gd with Kashiwazaki “down” | 6% | 27% | ||
| 7 yrs SK-Gd with only Shika-2 “up” | 6.7% |
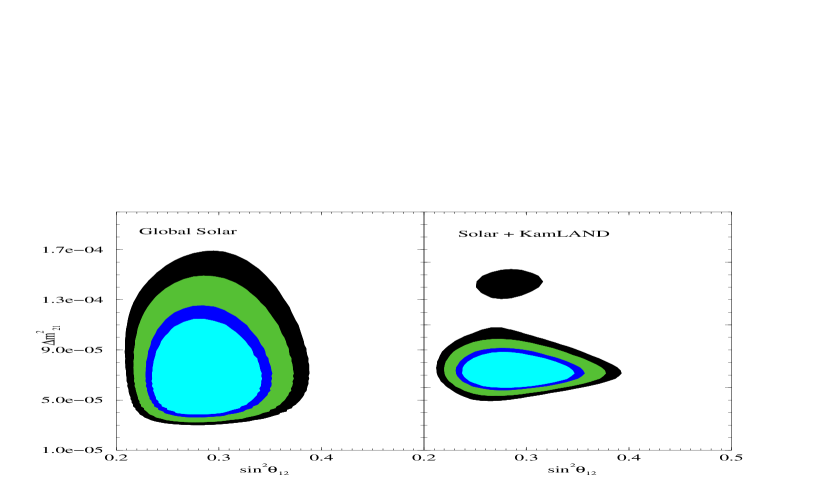
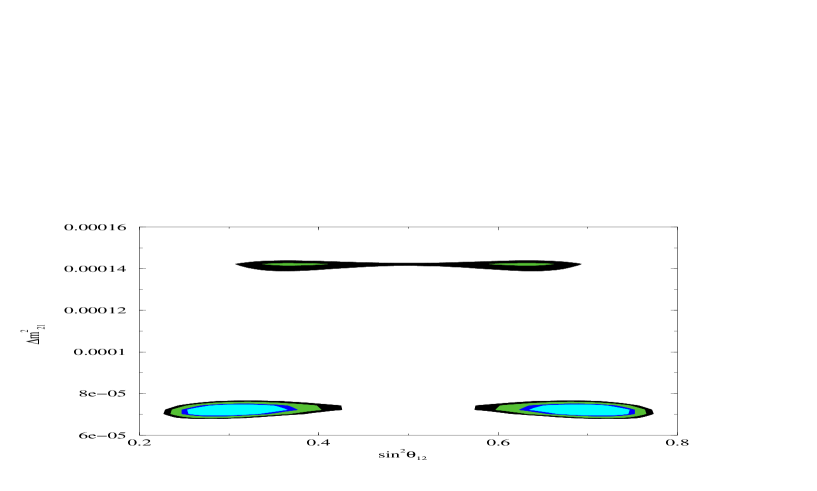
We begin by reviewing the current status of determination of the solar neutrino oscillation parameters. We present in Fig. 1 the regions in the plane, allowed by the global solar neutrino data (left-hand panel), and by the combined data from the KamLAND and solar neutrino experiments (right-hand panel). The global solar neutrino data used in the analysis include the total event rates measured in the Homestake [3] and SAGE+GALLEX+GNO [5, 6] (combined) experiments, the Super-Kamiokande 44 bin Zenith angle spectrum data [7], the 34 bin day-night spectrum data from the phase of the SNO experiment [9] and the charged current (CC), neutral current (NC) and elastic scattering (ES) data from the salt phase of SNO [10] 444We refer the reader to [18, 19, 34] for further details of the solar neutrino data analysis.. In what concerns the KamLAND results, we use the 13 binned spectrum data released by the KamLAND collaboration [11] 555For details of the statistical analysis procedure used for handling the KamLAND spectral data see ref. [35].. Figure 1 was obtained using the updated standard solar model (BP2004) results on the solar neutrino fluxes and the associated errors [36]. The range of allowed values of the parameters and are shown in Table 1. Also shown are the % spread, which is defined as,
| (1) |
where are the maximal (minimal) allowed value of the parameter at 99% C.L.
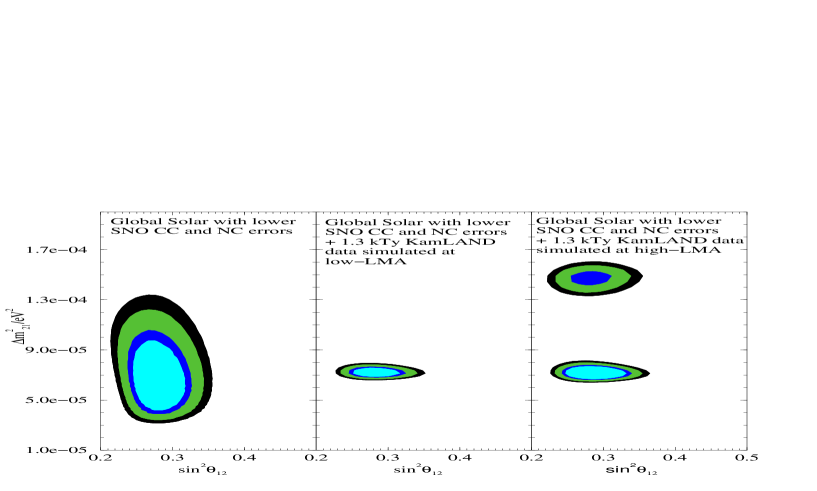
The SNO detector can simultaneously measure the CC and NC rates induced by the flux of solar neutrinos having energy MeV and MeV, respectively. While CC rate depends both on the flux normalization and the solar neutrino survival probability, the NC rate is determined, in the case of flavor oscillation involving only active neutrinos, solely by the flux normalization. This gives SNO the ability to determine the average survival probability and hence the oscillation parameters with a relatively good precision. In particular, the combination of CC and NC rates in SNO can be effectively used to obtain stringent upper limits on the allowed values of both and [37, 38]. The upper limits on and follow from the fact that the ratio of the CC and NC event rates observed in SNO is significantly smaller than 0.50 [10]. The smaller the ratio of the CC and NC event rates observed in SNO, the smaller the maximal allowed values of both and [37, 38]. For values of and in the low-LMA region, the matter-enhanced transitions of neutrinos inside the Sun are adiabatic and the survival probability, which affects the CC event rate observed in SNO during day-time, is given approximately by . Thus, improvement in the precision with which the CC and NC rates are measured in SNO would lead to a diminishing of the maximal allowed values of and , provided the mean values of these two observables do not change. This is illustrated in the left-hand panel of Fig. 2 where we show the regions of values of and , which would be allowed by the global solar neutrino data if the experimental errors in the CC and NC event rates measured by SNO are reduced respectively to 5% and 6% 666The total projected error in the SNO NC event rate measurement using Helium counters in the phase III of the experiment is expected, according to SNO, to be about 6% [39]. For the CC even rate we assume that the statistical error during the phase III would be approximately the same as in each of the earlier two phases, while the systematic error is taken to be of 4.5%, i.e., slightly smaller than the 5% reported in phases I and II of SNO. Thus, we assume that the total error in CC event rate measurement from all the three phases combined will be about 5%., while the mean values of the two rates coincide with those found in the salt phase of the SNO experiment [10]. We note that the maximal allowed values of both and would be smaller, while the minimal values essentially do not change. Thus, the uncertainties in the values of and would be reduced with respect to the currently existing ones.
Much better precision in the determination of the value of might be achieved in the KamLAND experiment. In Table 1 we present the range of allowed values of this parameter and the corresponding spread expected if 1 kTy data of KamLAND is combined with the current solar neutrino data (see refs. [30, 40] for details of the KamLAND prospective data analyses). The expected precision in the determination of from KamLAND data corresponding to statistics of 2.6 kTy, is also shown. Since a new reactor power plant Shika-2 is planned to start operating in March of 2006, we have also included the contribution of the flux from this new reactor to the data collected in KamLAND after March 2006. The impact of the new Shika-2 reactor on the KamLAND sensitivity to and was studied in detail in [29]. As was shown in [29], with Shika-2 reactor running, the precision with which can be determined in the KamLAND experiment does not improve considerably, while the high-LMA - low-LMA solution ambiguity increases.
In the middle (right-hand) panel of Fig. 2 we show the expected allowed region when we combine a higher precision global solar neutrino data, including projected SNO III results, with prospective KamLAND data, simulated at the current low-LMA (high-LMA) best-fit point. We expect KamLAND to have collected approximately 1.3 kTy of data by the end of 2006, when the SNO experiment is foreseen to conclude. In Fig. 2 we present results obtained by combining the solar neutrino data, including SNO data with 5% and 6% total uncertainties on the measured CC and NC event rates, respectively, with simulated 1.3 kTy KamLAND data. We again note that the allowed range of diminishes remarkably with the incorporation of the KamLAND data simulated at the low-LMA best fit point. With the KamLAND data simulated at the high-LMA best fit point, the low-high LMA solution ambiguity “appears” at 95% C.L. The range of allowed values of , however, in both cases remains practically unchanged with the inclusion of the KamLAND data.
3 Measurement of the Solar Neutrino Oscillation Parameters in the SK-Gd Reactor Experiment
Super-Kamiokande is the world’s largest running water Cerenkov detector, situated in the Kamioka mine in Japan. Next to SK in Kamioka is the KamLAND detector. KamLAND uses 1 kton of liquid scintillator to detect the coming from the nuclear reactors. SK receives the same reactor antineutrino flux as KamLAND. Since SK has ultra pure water as its detector material, it cannot efficiently tag the capture on protons. In particular, the neutron released in has to thermalise and then get captured to release , which can be then detected and the process tagged through delayed coincidence. The capture cross-section of thermal neutron on free protons in extremely small and hence SK is unable to separate the reactor capture events from the background. However, this could change if gadolinium was mixed with the SK water, as proposed recently in ref. [33]. The capture cross-section of thermal neutron on gadolinium is known to be remarkably large. In addition, neutron capture on Gd produces 8 MeV energy in photons making it easier for SK-Gd to detect them. Thus, SK loaded with Gadolinium could be used as a very big reactor anti-neutrino detector [33]. With its 22.5 kton of ultra pure water, the SK detector has about free protons as target for the antineutrinos coming from various reactors in Japan. The KamLAND detector has only free target protons [11]. Therefore for the same period of measurements, SK-Gd detector is expected to have about 43 times the statistics of the KamLAND experiment. The number of positron events in the SK-Gd detector is given by,
| (2) |
where is the measured visible energy of the emitted positron, when the true visible energy, MeV, being the energy of the incoming , is the reaction cross-section, denotes the flux from the th reactor, is the distance between the th reactor and Kamioka, is the energy resolution function of the detector, are the number of protons in the target, and is the survival probability of the coming from the reactor . Since the emitted positron from the antineutrino capture on proton will behave similarly to the elastically scattered electron by solar neutrinos, we use the energy resolution function for the solar neutrino detection provided by the SK collaboration [7]. The SK detector is located very close to KamLAND and we take the effective flux and distance for SK-Gd detector to be the same as those for KamLAND.
We simulate the data expected after 3 years of running of the proposed SK-Gd detector at a point in the low-LMA region with eV2 and ; for the high-LMA solution the data is simulated in the point eV2 and 777Unless otherwise stated, all future simulated data in this paper correspond to eV2 (low-LMA) or eV2 (high-LMA) and .. We construct a 18 bin data with a visible energy threshold of 3 MeV 888In order to facilitate comparison with the KamLAND data, we present all results in terms of the visible energy. and with bin width of 0.5 MeV. We wish to statistically analyze this prospective data. We define a function given by
| (3) |
where is the number of events in the bin, is the covariant error matrix containing the statistical and systematic errors and the sum is over all bins. The KamLAND experiment in their first published results of the measurement of reactor flux have reported a systematic error of 6.48% [11]. However, while KamLAND is a liquid scintillator detector, SK-Gd would be practically a water Cerenkov detector. Therefore the systematics of the SK-Gd experiment would be different from those of the KamLAND experiment. We would expect the SK-Gd systematics to be similar to those of the SK solar neutrino experiment, since even the energy range of the SK-Gd reactor experiment could be approximately the same as that of the SK solar neutrino experiment. We therefore assume a 5% systematic error in our analysis [7].
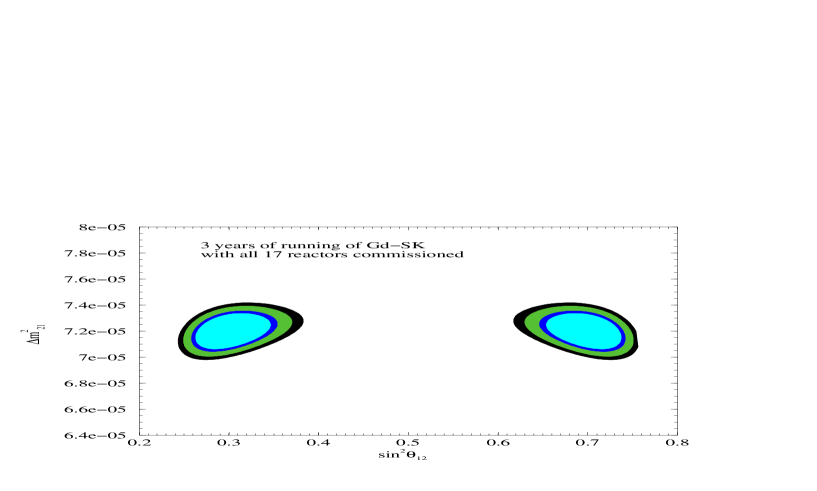
Figure 3 shows the allowed regions in the plane, obtained using 3 years of thus simulated data in the SK-Gd experiment, when the true solution is in the low-LMA region. In obtaining this figure we have assumed that all reactors in Japan, relevant for the analysis, including the forthcoming Shika-2 reactor, would be running with their full power. We note that the size of the allowed areas diminishes significantly in both and compared to the currently allowed regions. In Table 1 we show the uncertainties in and after three years of running of SK-Gd alone. We also give the expected uncertainties if data from 5 years of running of the SK-Gd detector are used in the analysis.
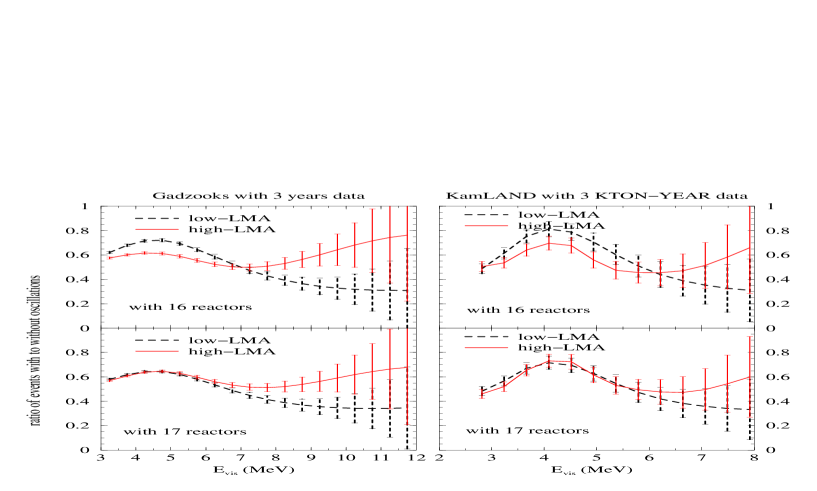
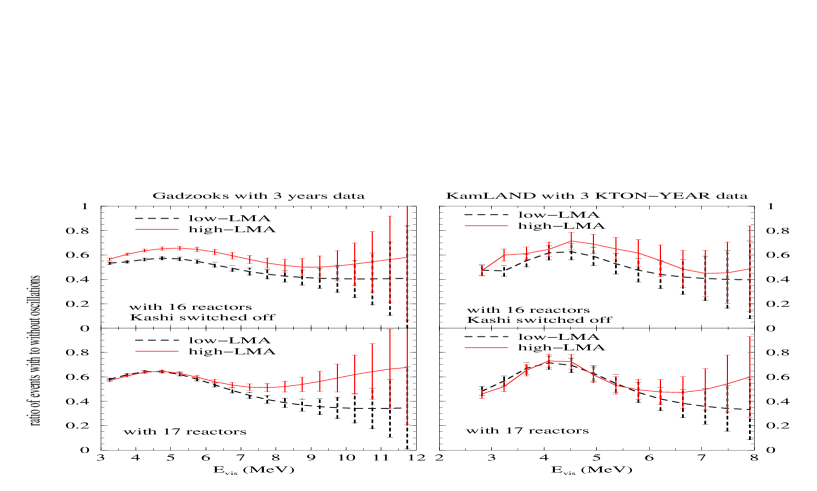
As Fig. 3 shows, the spurious high-LMA solution would be completely ruled out by the SK-Gd data, if low-LMA is the true solution. We have checked that SK-Gd can rule out the “wrong” solution with about years of data. This is in sharp contrast with what we have obtained for KamLAND, where it is hard to resolve the low-LMA – high-LMA ambiguity even with 2.6 kTy of data once the Shika-2 reactor is switched on. To facilitate the understanding of this result we present in Fig. 4 the spectral distortions predicted to be observed in the SK-Gd (left panels) and in KamLAND (right panels) experiments. The upper panels show the ratio of the events (or event rates) in the cases of oscillations and of absence of oscillations, with the current main 16 reactors running, while the lower panels are for the case where the Shika-2 reactor is operating along with the other 16 reactors. The dashed black lines are the expected spectra for the low-LMA solution, while the red solid lines are the spectra for the high-LMA solution. The errorbars correspond to the 1 statistical errors for 3 years of running of the SK-Gd detector and for 3 kTy ( years) of running of the KamLAND detector. The bin sizes used are 0.5 MeV for SK-Gd and 0.425 MeV for KamLAND. The threshold for KamLAND is taken as MeV [11], while for SK-Gd we use a threshold of MeV. For the SK-Gd detector the observed spectrum extends to nearly 12 MeV due to the worse energy resolution of SK. Clearly, in the 16 reactor case the SK-Gd experiment can distinguish between the low-LMA and high-LMA spectra. The KamLAND experiment could also distinguish between the two solutions with a 3 kTy statistics (see also [26, 29, 40]) 999Let us note that using combined data from the KamLAND detector, corresponding to statistics of 1kTy, and from the solar neutrino experiments, can permit to rule out the high-LMA solution [19, 29].. The differences between the spectra in the cases of the low-LMA and the high-LMA solutions, measured in SK-Gd and KamLAND experiments, diminish once the Shika-2 reactor is switched on. The low-LMA and high-LMA solution spectra measured with the KamLAND detector would be almost overlapping, as can be seen in the lower right-hand panel. This results in the reappearance of the “wrong” high-LMA solution, as stressed in [29]. Even for the SK-Gd detector, the difference between the spectra corresponding to the two solutions reduces considerably, especially in the statistically most relevant bins. However, there are still bins at intermediate energies at which the two solutions can be easily distinguished. This is why the SK-Gd experiment could still resolve the ambiguity between the low-LMA and high-LMA solutions with Shika-2 reactor operating, while KamLAND cannot.
The mixing angle is most precisely determined when the baseline corresponds to a minimum in the survival probability (SPMIN) in the statistically most relevant part of the positron energy spectrum [26]. It was pointed out in [29] that for the low-LMA solution the baseline from the Shika-2 reactor to Kamioka is such that the SPMIN for the Shika-2 flux occurs at . The Kashiwazaki-Kariwa power plant, which is the most powerful reactor complex in the world, is at a distance of about 160 km from Kamioka. Hence, the most significant part of the flux of from this most important source falls at Kamioka in the region of a survival probability maximum (SPMAX).
The effective flux at Kamioka in absence of oscillations is defined as
| (4) |
For the Kashiwazaki complex it corresponds to , while for the Shika-2 reactor it is substantially smaller, . Thus, the contributions to the signals observed in SK-Gd and KamLAND due to the Kashiwazaki flux will be considerably larger than that due to the Shika-2 flux, when the contributions from all the reactors are combined. Therefore the resultant spectrum due to the cumulative flux at Kamioka, produced by all relevant reactors in Japan, still exhibits the effect of the survival probability maximum. This is seen also in Fig. 4.
We therefore consider a fictitious scenario in which the Kashiwazaki complex is completely switched off, while the Shika-2 is operating. In figure 5 we show the allowed regions obtained using the data collected by the SK-Gd detector after 3 years of operation with Kashiwazaki reactor complex switched off, but with the Shika-2 reactor working. We show the uncertainty on and , determined with this set up, in Table 1. We note that instead of diminishing, the uncertainty in increases. Even the spurious high-LMA solution reappears in this case.
The predicted spectral distortions for the low-LMA and high-LMA solutions expected to be observed in SK-Gd and KamLAND, when the Kashiwazaki-Kariwa power plant does not operate, while the Shika-2 one is running at its full power, are shown in the upper panels in Fig 6. For comparison we also show the spectrum expected with all the main 17 reactors operating at their full strength. A comparison of the upper and lower left-hand panels indicates that with the Kashiwazaki complex switched off, the distortions in the expected spectrum for the low-LMA solution become smaller. We note that even though the spectra corresponding to the high-LMA and low-LMA solutions and measured with the SK-Gd detector are less overlapping, the difference in the spectral shape for the two solutions diminishes when the Kashiwazaki plant is not operating. Thus, it could be possible with a value of in the high-LMA zone, to describe the data simulated at the “true” low-LMA solution point. However, in this case a somewhat larger value of is required in order to explain the larger reduction of the event rate corresponding to the value of of the “true” low-LMA solution. This is what we get in Fig. 5, where the spurious high-LMA solution gets allowed with a higher value of .
To stress the importance of having an experimental set up in which there are no cancellations between SPMIN and SPMAX due reactors at very different distances, we consider a hypothetical situation where only one reactor is operating. As a concrete example we consider a scenario where only the Shika-2 reactor is operating. The flux from this reactor would produce a SPMIN in the spectrum detected at SK-Gd if low-LMA was the correct solution. We show in Table 1 the range of allowed parameter values and the corresponding spread at 99% C.L. obtained with 7 years of data recorded in SK-Gd, when only Shika-2 is operating. The improvement in the precision of measurement is seen to be remarkable.
4 Combined Impact of Solar and SK-Gd Data
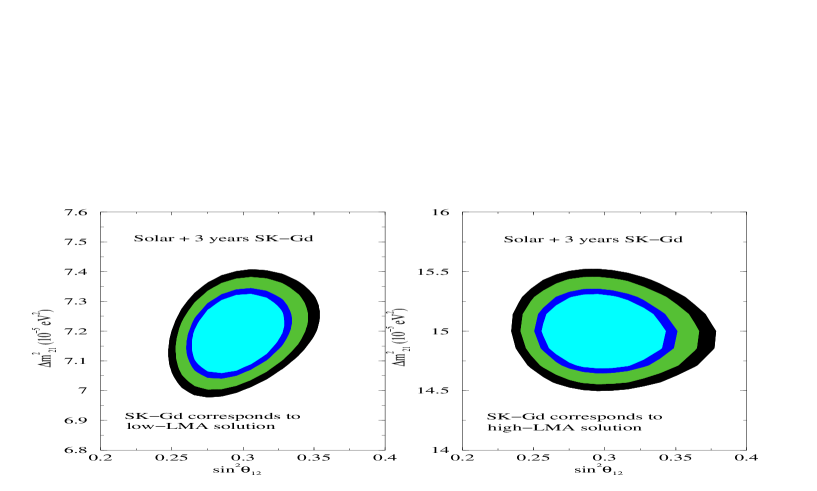
In Fig. 7 we present the allowed regions obtained by a combined analysis of the current global solar neutrino data and prospective SK-Gd data, expected after 3 years of running of the proposed SK-Gd experiment. The left-hand panel shows the case of low-LMA being the true solution of the solar neutrino problem; we simulated the SK-Gd data at eV2 and . The right-hand panel illustrates the scenario we would witness if against the current trend, the next set of data from the KamLAND experiment would favor the high-LMA solution. The SK-Gd data for the right-hand panel is simulated at eV2 and .
In the case of the low-LMA assumed to be the true solution of the solar neutrino problem, the inclusion of SK-Gd data from 3 years of measurements in the global solar neutrino analysis reinforces the low-LMA solution. The best-fit and the range of allowed values of are determined almost solely by the SK-Gd data. The best-fit and the range of allowed values of depend on both the solar and the SK-Gd data, though again due to its enormous statistics the SK-Gd data have larger impact on the determination.
If, however, the next KamLAND results do conform to the high-LMA solution, we would encounter a conflicting trend where the description of the solar neutrino data and of the KamLAND data would require different values of . Such a situation might warrant an explanation which includes new phenomenon along with matter induced oscillations to be responsible for the solar neutrino deficit (see, e.g., [41]). The data collected by SK-Gd experiment in 3 years, when combined with the global solar neutrino data, would lead to the allowed regions in the plane, shown in the right-hand panel in Fig. 7. We note that if the SK-Gd data conformed to a point in the high-LMA zone, the low-LMA solution which is favored by the solar neutrino data, would be completely ruled out. This reflects the statistical power of the SK-Gd experiment. In a similar analysis with prospective KamLAND data only (and no SK-Gd data) corresponding to the high-LMA solution, we would get allowed zones in both the low-LMA and high-LMA regions (see, e.g., ref. [19]).
In Table 1 we present the range of allowed and values, determined in a combined analysis of the solar neutrino and SK-Gd data. In the case of the true value of lying in the low-LMA region, the lower limit on is less stringent in comparison with the lower limit one obtains from the 3 year data of SK-Gd only. This is due to the solar neutrino data favoring values of eV2. The upper limit on is determined solely by the SK-Gd data. The maximal allowed value of diminishes with the inclusion of the solar neutrino data in the analysis together with the SK-Gd data. Correspondingly, the spread reduces from 19% to 15%. The lower limit on is determined by the SK-Gd data.
If the SK-Gd data is simulated at a point in the high-LMA region, has a spread of 3% and has a spread of 12%. We note that the spread in is larger for values of in the high-LMA region than for lying in the low-LMA region. The accuracy in the determination is somewhat worse in the case of the high-LMA solution compared to the case of the low-LMA solution because there is less spectral distortion for the values in the high-LMA zone, as can be seen in Fig. 4. For a high precision determination of , conditions as close to SPMIN as possible are required [26, 29]. We find that the precision in is worse for the high-LMA solution since the spectrum has a smaller “dip” even for the higher energy bins, as compared to the “dip” in the spectrum in the case of the low-LMA solution (this is valid even if the Shika-2 reactor is operating, see the lower left-hand panel in Fig. 4).
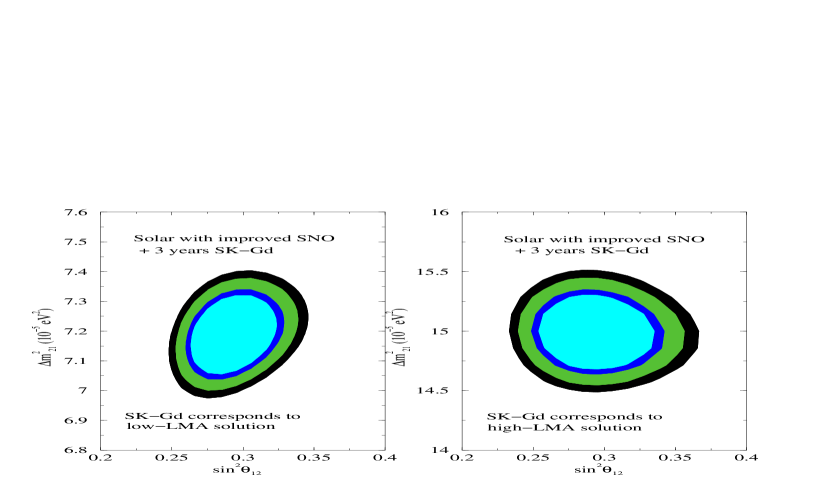
In Fig. 8 we present the the allowed regions obtained by a combined analysis of the global solar neutrino data with reduced errors for the SNO CC (5%) and SNO NC (6%) and prospective SK-Gd data, expected after 3 years of running of the proposed SK-Gd experiment. In Table 1 we present the corresponding allowed range for and and the spread at 99% C.L.
5 Conclusions
In this paper we have studied the prospects of high precision determination of the solar neutrino oscillation parameters, and , by investigating the reactor oscillations with the recently proposed gadolinium loaded Super-Kamiokande (SK-Gd) experiment [33]. Doping the SK detector with Gadolinium by dissolving 0.2% gadolinium trichloride in the water [33] would make it possible to detect the neutrons, released in the capture on protons, with a relatively high efficiency. This would allow the SK experiment, in particular, to detect the reactor coming from the numerous powerful nuclear reactors located in Japan, thus transforming SK into the largest long baseline reactor detector with an event rate approximately 43 times higher than that observed in the KamLAND experiment.
Working in the framework of two-neutrino mixing, we have presented first an overview of the currently allowed ranges of values of the solar neutrino oscillation parameters and by the existing global solar neutrino and KamLAND data (Fig. 1 and Table 1), as well as the regions in the parameter space which are expected to be allowed after taking into account future higher statistics and lower systematic data from SNO and from KamLAND experiments (Fig. 2). The SK-Gd detector is considered in Section 3, where we discuss the assumptions made to simulate the data in this proposed modification of the SK detector, as well as the procedure used to statistically analyze the simulated data.
The results of our analysis show that the SK-Gd experiment has a remarkable potential in reducing the uncertainties in the values of and (Figs. 3 and 7 and Table 1). Combining the SK-Gd data, taken over a period of 3 years, with the data from the solar neutrino experiments, will allow to determine with a 3% error at 99% C.L., the error being by a factor of 2 smaller if one uses only the SK-Gd data. With only years of data, the SK-Gd experiment would rule out completely the spurious high-LMA solution if low-LMA is the true solution. In contrast, the high-LMA solution could be ruled out if one uses the data from the solar neutrino experiments and data from the KamLAND detector, corresponding to 1kTy of statistics. If the future KamLAND data would conform to a point in the high-LMA region, both the high-LMA and the low-LMA solutions would be allowed at 90% C.L. [19]. In this case the high-LMA – low-LMA solution ambiguity can be resolved completely by the SK-Gd experiment. In what regards the solar neutrino mixing angle, using the data from the solar neutrino experiments and the SK-Gd 3 year data will allow to determine with a error at 99% C.L. One would have the same uncertainty in using data only from the SK-Gd experiment, corresponding to 5 years of measurements. Thus, the SK-Gd experiment could provide one of the most precise (if not the most precise) determination of the solar neutrino oscillation parameters and .
Addendum after the 766.3 kTy results from KamLAND
The KamLAND collaboration has published data corresponding to a statistics of 766.3 kTy [42]. The new results from KamLAND have corroborated their first results from 2002 and have for the first time provided unambigous evidence for distortion in the measured reactor antineutrino spectrum. These new results have reinforced the low-LMA solution of the solar neutrino problem and the combined solar and KamLAND data now rule out the high-LMA solution at the level [43]. The best-fit values of the solar neutrino oscillation parameters obtained from the combined analysis of solar and KamLAND data are eV2 and and their corresponding 99% C.L. allowed range of values are given as
| (5) | |||||
| (6) |
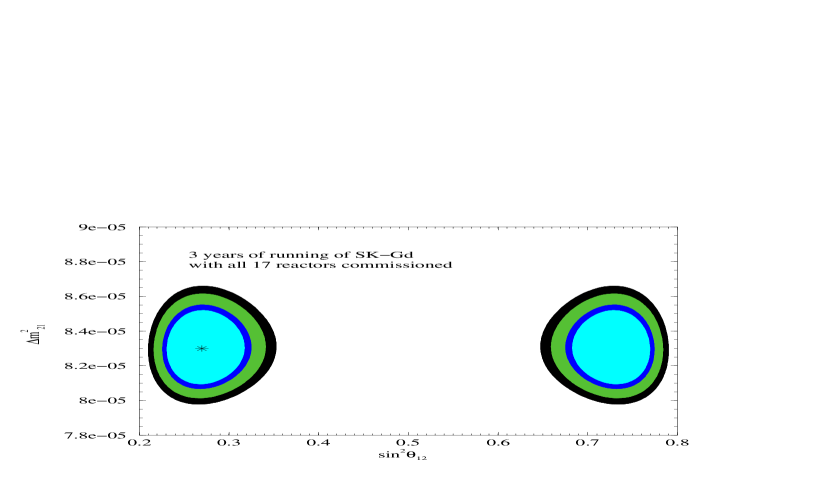
We present in this section the allowed regions in the parameter space expected from the Sk-Gd experiment when the “data” is simulated at the new global best-fit point eV2 and . The Fig. 9 shows the allowed regions for 3 years statistics in SK-Gd. The corresponding allowed range of and and their spread, expected at 99% C.L. is given as
| (7) | |||||
| (8) |
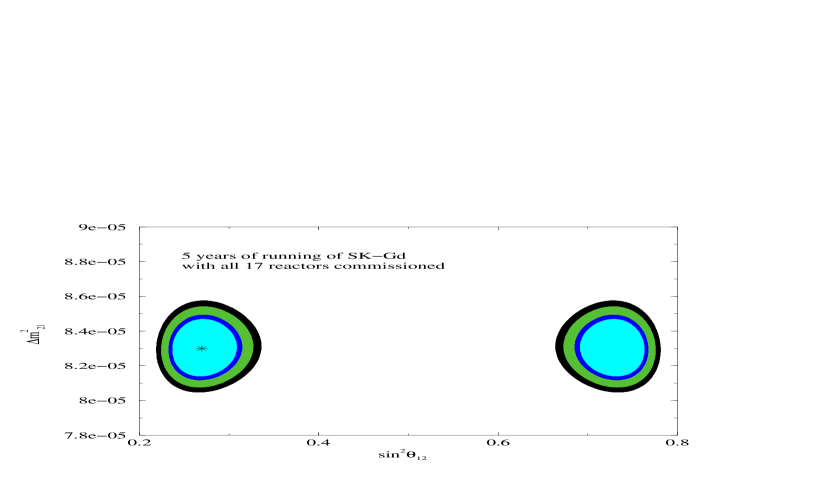
Fig. 10 shows the allowed regions for 5 years statistics in SK-Gd with the spectrum simulated at the new global best-fit. The 99% C.L. allowed range and spread in and are given as
| (9) | |||||
| (10) |
We note that the precision on and measurement in SK-Gd for a given statistics remains roughly the same for the old and new global best-fit points.
Acknowledgements
The authors would like to thank M. Vagins for useful correspondence. The results on the solar neutrino data analysis presented in this work were obtained in collaboration with A. Bandyopadhyay and S. Goswami, and the authors wish to thank them. S.T.P. would like to thank Prof. T. Kugo, Prof. M. Nojiri and the other members of the Yukawa Institute for Theoretical Physics (YITP), Kyoto, Japan, where part of the work on present study was done, for the kind hospitality extended to him. This work was supported in part by the Italian INFN under the program “Fisica Astroparticellare”.
References
- [1] B. Pontecorvo, Zh. Eksp. Teor. Fiz. 33 (1957) 549 and 34 (1958) 247; Z. Maki, M. Nakagawa and S. Sakata, Prog. Theor. Phys. 28 (1962) 870.
- [2] B. Pontecorvo, Zh. Eksp. Teor. Fiz. 53 (1967) 1717.
- [3] B.T. Cleveland et al., Astrophys. J. 496 (1998) 505;
- [4] Y. Fukuda et al., Phys. Rev. Lett. 77 (1996) 1683.
- [5] J. N. Abdurashitov et al. [SAGE Collaboration], J. Exp. Theor. Phys. 95, 181 (2002) [Zh. Eksp. Teor. Fiz. 122, 211 (2002)].
- [6] W. Hampel et al. [GALLEX Collaboration], Phys. Lett. B 447, 127 (1999); E.Bellotti, Talk at 2nd International Workshop on Neutrino Oscillations in Venice, Venice, Italy, December 3-5, 2003.
- [7] S. Fukuda et al. [Super-Kamiokande Collaboration], Phys. Rev. Lett. 86 (2001) 5651, and Phys. Lett. B 539, 179 (2002); M. B. Smy et al. [Super-Kamiokande Collaboration], Phys. Rev. D 69, 011104 (2004).
- [8] Q. R. Ahmad et al. [SNO Collaboration], Phys. Rev. Lett. 87 (2001) 071301.
- [9] Q. R. Ahmad et al. [SNO Collaboration], Phys. Rev. Lett. 89 (2002) 011301, and ibid. 89 (2002) 011302.
- [10] S.N. Ahmed et al. [SNO Collaboration], nucl-ex/0309004.
- [11] K. Eguchi et al. [KamLAND Collaboration], Phys. Rev. Lett. 90 (2003) 021802.
- [12] Y. Fukuda et al. [Super-Kamiokande Collaboration], Phys. Rev. Lett. 81, 1562 (1998).
- [13] C. Saji et al. [Super-Kamiokande Collaboration], Talk given at the Int. Workshop on Neutrino Oscillations and their Origin (NOON2004), February 11 - 15, 2004, Tokyo, Japan.
- [14] M. Ishitsuka et al. [Super-Kamiokande Collaboration], Talk given at the Int. Workshop on Neutrino Oscillations and their Origin (NOON2004), February 11 - 15, 2004, Tokyo, Japan.
- [15] M.H. Ahn et al. [K2K Collaboration], Phys. Rev. Lett. 90 (2003) 041801.
- [16] B. Pontecorvo, Chalk River Lab. report PD–205, 1946.
- [17] R. Davis, D.S. Harmer and K.C. Hoffman, Phys. Rev. Lett. 20, 1205 (1968); R. Davis, Proc. of the “Neutrino ‘72” Int. Conference, Balatonfured, Hungary, June 1972 (eds. A. Frenkel and G. Marx, OMKDK-TECHNOINFORM, Budapest, 1972), p.5.
- [18] A. Bandyopadhyay, S. Choubey, S. Goswami and D. P. Roy, Phys. Lett. B 540, 14 (2002); S. Choubey, A. Bandyopadhyay, S. Goswami and D. P. Roy, arXiv:hep-ph/0209222.
- [19] A. Bandyopadhyay, S. Choubey, S. Goswami, S. T. Petcov and D. P. Roy, Phys. Lett. B 583, 134 (2004).
- [20] A. B. Balantekin and H. Yuksel, Phys. Rev. D 68, 113002 (2003); M. Maltoni, T. Schwetz, M. A. Tortola and J. W. F. Valle, Phys. Rev. D 68, 113010 (2003); P. Aliani et al., hep-ph/0309156; P. C. de Holanda and A. Y. Smirnov, arXiv:hep-ph/0309299.
- [21] M. Apollonio et al., Phys. Lett. B466, 415 (1999), and Eur. Phys. J. C 27, 331 (2003); F. Boehm et al., Phys. Rev. D62, 072002 (2000).
- [22] G.L. Fogli et al., Phys. Rev. D 69, 017301 (2004).
- [23] C.M. Gonzalez-Garcia, talk given at the Int. Workshop on Neutrino Oscillations and their Origin (NOON2004), February 11 - 15, 2004, Tokyo, Japan.
- [24] C. Athanassopoulos et al. [LSND Collaboration], Phys. Rev. Lett. 77, 3082 (1996) and Phys. Rev. Lett. 81, 1774 (1998); E. D. Church, K. Eitel, G. B. Mills and M. Steidl, Phys. Rev. D 66, 013001 (2002).
- [25] J. Raaf, Talk given at the Int. Workshop on Neutrino Oscillations and their Origin (NOON2004), February 11 - 15, 2004, Tokyo, Japan.
- [26] A. Bandyopadhyay, S. Choubey and S. Goswami, Phys. Rev. D 67, 113011 (2003).
- [27] J. N. Bahcall and C. Peña-Garay, arXiv:hep-ph/0305159.
- [28] S. Choubey, S. T. Petcov and M. Piai, Phys. Rev. D 68, 113006 (2003).
- [29] A. Bandyopadhyay, S. Choubey, S. Goswami and S. T. Petcov, Phys. Lett. B 581, 62 (2004).
- [30] S. Choubey, arXiv:hep-ph/0402288; S. Goswami, A. Bandyopadhyay and S. Choubey, arXiv:hep-ph/0312028.
- [31] R. S. Raghavan, Talk given at the Int. Workshop on Neutrino Oscillations and their Origin (NOON2004), February 11 - 15, 2004, Tokyo, Japan; for further information see the web-site: http://www.phys.vt.edu/ kimballton/ .
- [32] M. Nakahata, Talk given at the Int. Workshop on Neutrino Oscillations and their Origin (NOON2004), February 11 - 15, 2004, Tokyo, Japan.
- [33] J. F. Beacom and M. R. Vagins, arXiv:hep-ph/0309300.
- [34] A. Bandyopadhyay, S. Choubey, S. Goswami and K. Kar, Phys. Lett. B 519, 83 (2001);
- [35] A. Bandyopadhyay, S. Choubey, R. Gandhi, S. Goswami, D. P. Roy, Phys. Lett. B 559, 121 (2003).
- [36] J. N. Bahcall and M. H. Pinsonneault, Phys. Rev. Lett. 92, 121301 (2004).
- [37] M. Maris and S. T. Petcov, Phys. Lett. B 534 (2002) 17.
- [38] M. C. Gonzalez-Garcia, C. Peña-Garay, Y. Nir and A. Y. Smirnov, Phys. Rev. D 63, 013007 (2001).
-
[39]
H. Robertson for the SNO Collaboration, Talk given at TAUP 2003,
Univ. of Washington, Seattle, Washington, September 5 - 9, 2003,
transparencies at:
http://mocha.phys.washington.edu/ int_talk/WorkShops/TAUP03/Plenary/ - [40] A. Bandyopadhyay, S. Choubey, R. Gandhi, S. Goswami and D. P. Roy, J. Phys. G 29, 2465 (2003).
- [41] M.M. Guzzo, P.C. de Holanda and O.L.G. Peres, hep-ph/0403134.
- [42] T. Araki et al. [KamLAND Collaboration], arXiv:hep-ex/0406035.
- [43] A. Bandyopadhyay, S. Choubey, S. Goswami, S. T. Petcov and D. P. Roy, arXiv:hep-ph/0406328.