Chapter 1 Report on the High Energy Phenomena
Sessions HE 2, HE 3.2-3.4: Neutrinos and Muons. Interactions,
Particle Physics Aspects, Astro-Particle Physics
and Cosmology
Abstract
The results presented at the 28th International Cosmic Ray Conference on neutrino and muon physics are summarized. Neutrinos and muons provide a huge amount of information on particle interactions up to very high energies and on fundamental particle properties. Results on neutrino oscillations in the atmospheric and solar sectors are summarized. Oscillations are well established in both sectors, and a more precise determination of oscillation parameters is requested in the next future.
Neutrino telescopes taking data and under construction presented numerous results. Neutrinos as probes of the Universe are hopefully going to open, together with gravitational waves, a new era for Astrophysics. Cosmology has entered the precision era and the Dark Matter quest is still an open problem. Direct and indirect searches are complementary approaches to the problem.
The results presented at this conference confirm that Astroparticle Physics and, in particular, Neutrino Physics are leading fields in fundamental research.
1. Introduction
The High Energy Phenomena Sessions HE 2.1-5 of this conference are devoted to: muon and neutrino experiments and calculations, neutrino telescopes and new projects. The Sessions HE 3.2-4 are dedicated to more exotic searches, such as dark matter and new particles, proton decay and cosmology, both from the theoretical and the experimental point of view. The total amount of 139 talks and posters cannot be entirely summarized here. In the attempt to provide an organic overview on the subjects of these sessions, some of the works are not mentioned. I do apologize with the authors. Whenever possible experimental results and calculations are compared.
Sec. LABEL:montaruli:sec:atmo is devoted to neutrinos and muons of atmospheric origin. In Sec. LABEL:montaruli:sec:atmnu the current status on our experimental and theoretical knowledge of the atmospheric neutrino beam and its impact on the oscillation scenario is discussed. Super-Kamiokande (SK) has presented results on atmospheric neutrinos (HE 2.2) and on oscillations. In Sec. LABEL:montaruli:sec:calc, the status of atmospheric neutrino calculations is summarized (HE 2.4), with particular attention to the primary cosmic ray (CR) flux, a crucial input to atmospheric cascade calculations.
Muon flux measurements (HE 2.1), currently, are mainly motivated to benchmark atmospheric shower development codes and hence atmospheric calculations. In fact muons and neutrinos come from the same decay chains. In Sec LABEL:montaruli:sec:muons the results presented at the conference on muon fluxes and charge ratios are summarized.
Sec. LABEL:montaruli:sec:astro is devoted to neutrinos of astrophysical origin, not produced in the Earth atmosphere. Among these, solar neutrinos are used to investigate neutrino properties as well as the Sun itself. In Sec. LABEL:montaruli:sec:solar results from SNO and SK (HE 2.2) are summarized. The solar neutrino experiment results together with the KamLAND long baseline reactor experiment results are providing a convincing solution to the solar neutrino problem on disappearance.
Currently solar neutrinos and events registered by Kamiokande and IMB [1] a few hours before the optical identification of SN1987A are the only astrophysical neutrinos detected so far. In Sec. LABEL:montaruli:sec:collapse limits on supernova (SN) collapse are summarized. On the other hand, no neutrino of astrophysical origin has yet been detected above the GeV scale in the background of atmospheric neutrinos. Nevertheless hopefully in a few years we will enter the neutrino astronomy era, thanks to the numerous efforts on the construction of huge neutrino telescopes to which Sec. LABEL:montaruli:sec:nutelescopes is devoted (HE 2.3). Results from various neutrino telescopes on point-like and diffuse sources are presented, including sensitivities expected for experiments under construction and R&D.
In Sec. LABEL:montaruli:sec:dm some of the results and sensitivities on dark matter searches through the detection of gammas, anti-protons, positrons and neutrinos by satellites, ground-based arrays and neutrino telescopes will be summarized.
2. Atmospheric Neutrinos and Muons
2.1. Atmospheric Neutrinos and Super-Kamiokande
Super-Kamiokande is an ultra-pure water Cherenkov detector, with a fiducial volume of 22.5 ktons and a 40% phototube (PMT) coverage (11,146 51 cm Hamamatsu PMTs looking to the inner detector and 1885 20 cm PMTs of the outer veto) [2]. A reaction chain in Nov. 2001 destroyed 50% of the PMTs. This unfortunate event concluded the SK-I phase with a total amount of 1489 days of data taking (91.7 kt yr). In Dec. 2002 the reconstruction was completed and since Jan. 2003 the experiment has been taking new data and the K2K neutrino beam has been on.
Even though no experiment has yet measured the oscillatory pattern, which would unequivocally establish an oscillation phenomenon, the strength of Super-Kamiokande result relies on the measurement of topologies belonging to different energy ranges and of both electron and muon flavors. The updated analysis presented at the conference introduced some refinements in the event reconstruction and in particle identification (on which the systematic error is at the level of as estimated from Monte Carlo studies, from a test of the KEK proton synchrotron [3], and confirmed by the near 1 kton detector of K2K [4]). Also improvements on the upward through-going muon selection have been adopted. Moreover, the Monte Carlo (MC) generator has been updated using the calculation by Honda et al. [5], which adopts the fit to primary CR measurements presented at ICRC2001 [6]. Also the quasi-elastic and production cross sections were improved thanks to the K2K data.
Tab. 1 summarizes the statistics and the values of the flavor ratio for the Sub-GeV fully contained (FC) sample ( GeV) and the Multi-GeV (FC with GeV) and partially contained (PC) sample ( GeV). For the Multi-GeV sample the up/down asymmetry for -like events deviates from zero (expected in the no oscillation case) by 9.5 : . On the other hand, for e-like events . These measurements provide a robust evidence in favor of oscillations, as will be discussed in Sec. LABEL:montaruli:sec:calc. Muon neutrino charged current (CC) interactions in the rock below the detector produce stopping muons ( GeV) and upward through-going muons ( GeV). The zenith angle distribution of these events shows a distortion compatible to oscillations. Tab. 1 summarizes the statistics, the measured and expected fluxes also for these samples.
| Sample | e-like | -like | |
|---|---|---|---|
| Sub-GeV | 3353 | 3227 | |
| Multi-GeV+PC | 746 | 1564 | |
| Sample | Data | Measured flux | Expected Flux [5] |
| (1645.9 d) | cm-2 s-1 sr-1 | cm-2 s-1 sr-1 | |
| Stopping s | 463 | ||
| Through-going s | 1843 |
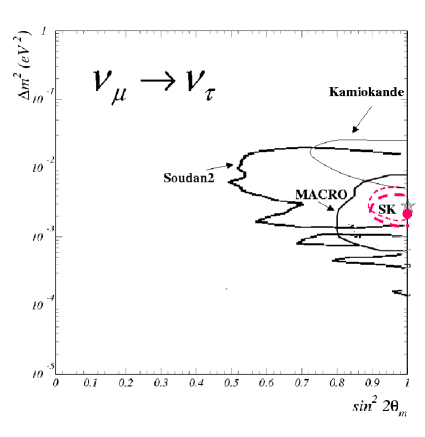
The SK-I updated analysis firstly presented at ICRC2003 [2] leads to a preliminary best fit value of eV2, at maximal mixing, about smaller compared to the past result of eV2 [7]. Allowed regions are compared in Fig. 1, where the final result from MACRO [8] and Soudan 2 [9] are presented too. Also the Kamiokande [7] result is shown: the lowering of SK region increases the discrepancy between the SK and its precursor result which could be clarified through a reanalysis of the Kamiokande data. The 90% c.l. region is and eV2, while previously it was and eV2. The value of has an impact on the expectations of Long Baseline Experiments, particularly on the CNGS appearance experiments, OPERA and ICARUS. Considering a beam intensity larger than a factor 1.5 compared to the nominal beam, the CC events expected in ICARUS T3000 (2.35 kton active mass) in 5 yrs for the decay modes vary from to 18 between eV2 and maximal mixing [10], while the background is event.
Since one of the changes is related to the flux adopted by the experiment, the problem, addressed in Sec. LABEL:montaruli:sec:calc, on how well we do know the atmospheric flux in the various energy ranges arises, even though it is clear that also the analysis refinements must have a relevant role.
In the low energy range (FC events) SK investigated the geomagnetic field effects on fluxes through the measurement of the azimuth distribution affected by the East-West anisotropy in the primary CR flux. The anisotropy results in larger (smaller) fluxes of ’s traveling toward East (West) [11]. This offers the possibility to validate calculations at GeV. SK is also sensitive to the finer effect of an enhancement of the asymmetry for e-like events with respect to -like events that can be correctly taken into account by 3-D MC calculations (’s are not collinear to their parents) [12].
SK can provide information on the oscillation channel: oscillations are disfavored at 99 % c.l. through the non observation of neutral current (NC) suppression using the sample which now is measured with a reduced systematic error (from 30% to 9%) thanks to the K2K measurement of [13]. Moreover some indication on appearance can be extracted on a statistical basis [14].
2.2. The Knowledge of the Atmospheric Neutrino Beam
Exploiting different experimental techniques, SK, MACRO and Soudan 2 provide a robust evidence in favor of oscillations, since the flavor ratio, the up-down asymmetry and the zenith angle distributions are robust quantities against theoretical errors on the atmospheric flux calculation, known at the level of . As a matter of fact, at energies below about 2 GeV, when all muons decay in the atmosphere, 2 and 1 are produced in and decay chains. Moreover, far from regions where geomagnetic field effects are relevant, that is for GeV, the flux is up-down symmetric (, where is the zenith angle), due to the atmosphere and Earth spherical symmetry. For higher energy events, i.e. the through-going muons, the shape of the angular distribution obtained using different calculations agrees at the level of , where the remaining uncertainty is due to the knowledge of the competition between decay and interaction for pions and kaons, seasonal effects and variations in atmospheric profiles, and to the uncertainty in the spectral slope of the primary flux. On the other hand, using the comparison between different atmospheric neutrino calculations, it can be estimated that the absolute normalization of fluxes is still affected by 15%, 30% errors, respectively in the GeV and GeV energy ranges. This uncertainty is large even if calculations are benchmarked against atmospheric muons at sea level and in the atmosphere (see Sec LABEL:montaruli:sec:muons). The main errors come from the primary cosmic ray spectrum and the hadronic interaction models. During the last years, authors of different MC computations started a comparison work between interaction models which led to code updates. For instance, the Bartol group presented at the conference the updated generator TARGET [16, 17]. Other groups use more sophisticated interaction and transport codes, such as FLUKA [18], that has been extensively benchmarked on accelerator data and muons (see for instance the comparison of meson multiplicity distributions in for generators used in CORSIKA [19] with p-9Be, p-14N data), the Japanese group updated the interaction model adopting DPMJET3 [5]. Wentz et al. adopted some of the CORSIKA generators, among which DPMJET II.5 [20], while Liu et al. adapted a parametrized hadronic model published in 1989 [21]. It should be understood why Liu et al. calculation seems to predict a larger East-West asymmetry for -like events than e-like, contrarily to expectations (see Sec. LABEL:montaruli:sec:atmnu). All of these codes are now 3-dimensional: the introduction of transverse momenta produces a considerable enhancement at the horizon for energies 2 GeV, first found in [18]. A review on atmospheric neutrino calculations is in [15].
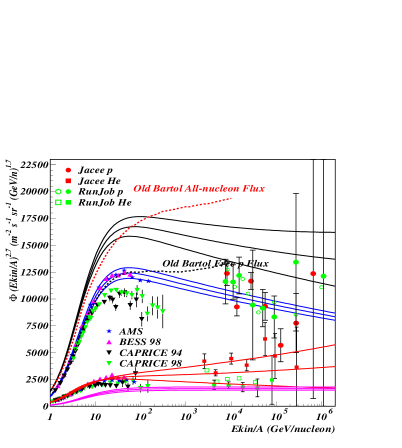
The other important input in atmospheric neutrino calculations is the primary CR spectrum. The uncertainties affecting the CR spectrum are energy dependent. The recent fit presented at ICRC2001 [6] was an attempt to unify this input between different calculations. At energies GeV/nucleon it relies on the recent measurements of the AMS-01 Space Shuttle flight [22] and of the balloon experiment BESS 98 [23]: for protons they are in agreement within 5%, while for He there is some discrepancy at the level of 15%, which at these energies reflects on a 3% uncertainty on the all-nucleon flux [15]. Nevertheless, it remains to be understood the disagreement of the proton measurements by the CAPRICE balloon flights (1994 [24] and 1998 [25]) which are about lower than AMS-01 and BESS 98 results.
At high energy ( GeV/nucleon) the JACEE [26] and RUNJOB [27,28] data have large errors leaving room for large variations of the fitted spectral slope. While at energies GeV/nucleon, the ICRC2001 fit [6] changed by less than 10% compared to the previous Bartol 96 fit used in [29], at higher energies the ICRC2001 fit [6] is steeper () than the Bartol 96 fit (). In Fig. 2 (on the left) the data and both fits are shown. ATIC has presented at this conference preliminary data [30] from the long duration balloon flight that fill the gap in energy between previous experiments. These data are crucial to understand the slope of the spectrum and also if protons and He have the same slope, as it is discussed in [31]. Preliminary results indicate a preference and that He spectrum has almost the same slope of the proton one. A preference for harder spectra for He (closer to JACEE result than to RUNJOB) is also found using EAS-TOP/MACRO and the analysis of coincidences between the 2 experiments [32].
The effect on fluxes of changing the CR flux slope above 100 GeV/nucleon from to has been investigated by the Japanese [5] and FLUKA [18] groups. Using both fits with the same interaction code, in the case of FLUKA, the ICRC2001 fit produces fluxes (averaged over the entire hemisphere) never larger by 10% between 0.1-1 GeV, lower by 5% at 10 GeV and by 20-30% between 100 GeV-1 TeV than the flux with the Bartol 96 fit.
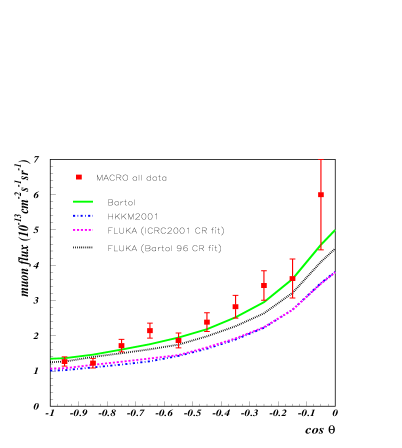
One more indication on the fact that the ICRC2001 fit could be too steep comes from SK and MACRO through-going data. As a matter of fact, if the measured SK zenith angle distribution of through-going muons is fitted letting the Honda et al. flux [5] normalization free, the best fit is obtained for a normalization value larger by than what predicted by [5] using the ICRC2001 fit. A similar result is obtained using MACRO upward through-going muons [8,18]. Nevertheless it is hard to understand the effect of the energy dependent uncertainty on the normalization in the evaluation of the best fit parameters. In fact the Super-Kamiokande fitting procedure contains various parameters related to the normalization and the slope of the spectrum [2]. In Fig. 2 (on the right) MACRO through-going muons (821 events selected for oscillation studies) [8,18] are compared to the FLUKA fluxes with the ICRC2001 and 96 fits, the Bartol 96 flux and the Honda et al. flux [5] using the ICRC2001 fit. Clearly the data seem to prefer the fluxes using the 96 fit. From the plot it is also noticeable the good agreement between the calculations using two different interaction models (FLUKA and DPMJET3) and the same CR spectrum (ICRC2001 fit).
 |
 |
2.3. Muon Data at Sea Level and in the Atmosphere
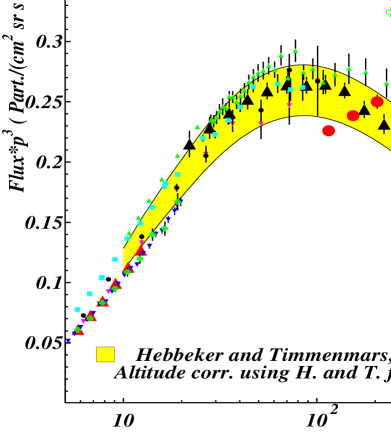
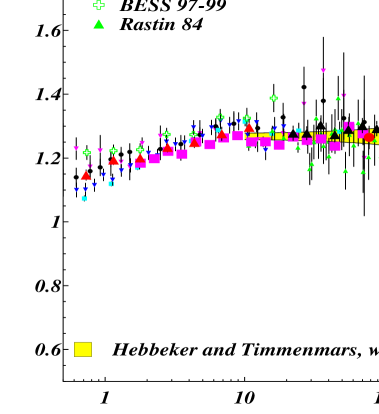
Many balloon and ground based experiments presented measurements of muon fluxes at sea level and in the atmosphere. A summary of sea level data, including previous measurements is presented in Fig. 3 in terms of vertical muon flux and charge ratio , compared to the world average band estimated in [33]. At energies GeV muon data are not affected by solar modulation and geomagnetic cut-off effects, while for lower energies these effects must be considered, as shown for instance by the comparison between the data taken at Ft. Sumner by CAPRICE 97 [34] and BESS-01 [35].
Preliminary results on atmospheric muons from LEP experiments have been presented at the conference. The L3+Cosmics [36], which uses the L3 magnetic spectrometer and a scintillator setup to provide the arrival time, has measured the muon spectrum in a wide energy range (20-2000 GeV) with a systematic error of 2.6% at GeV (mainly due to the uncertainty on the knowledge of the 30 m thick molasse overburden) increasing to 15% at 2 TeV due to the momentum resolution. Using ALEPH hadronic calorimeter and TPC, the Cosmo-ALEPH experiment [37] presented the muon flux and charged ratio measurement in the range 70-2500 GeV. The results are preliminary since the flux is normalized to the world average and the experiment is investigating trigger efficiencies. Both results are of great interest for benchmarking atmospheric shower development codes (see Sec. LABEL:montaruli:sec:calc) up to high energies. The L3+C measurement has already been compared to the Bartol calculation in [16]. Other comparisons between calculations and balloon flight ascent data at GeV have been shown in [41,42,21]. The interest of data taken at the top atmosphere (see for instance [41]) relies on the possibility of testing the first interactions, when the shower has not yet developed.
 |
 |
3. Neutrino of Astrophysical Origin
In this section results concerning measurements and searches for neutrinos not produced in the Earth atmosphere, such as solar neutrinos and neutrinos from cosmic sources, are summarized. The only exception is for the reactor experiment KamLAND, that is included in the solar session due to the impact of its results on the solar problem.
3.1. Solar Neutrinos
In writing this section on solar neutrinos it cannot be ignored the fact that after the conference the SNO collaboration has published results on the salt phase [43] and numerous interpretations have already appeared. SNO, a 12 m diameter acrylic vessel filled with 1 kton pure O seen by 9500 PMTs, exploits the solar detection above a MeV threshold through 3 reactions: neutrino elastic scattering (ES), mainly sensitive to since , CC and all flavor NC interactions on deuterium. The ratio of CC to NC interactions provides the electron survival probability. The results of the first phase of the experiment, also combined with the SK precise measurement of ES showed that about 2/3 of convert into another active flavor or , indicating hence a clear preference for MSW effects [44] and a rejection of the null hypothesis on flavor transformation. After increasing sensitivity to NC with the addition of tons of salt, the experiment is now able to claim evidence for MSW effects in solar neutrinos. These results represent a fundamental step forward in understanding solar oscillations through the precise determination of the total active 8B (and hep) flux in agreement with [45].
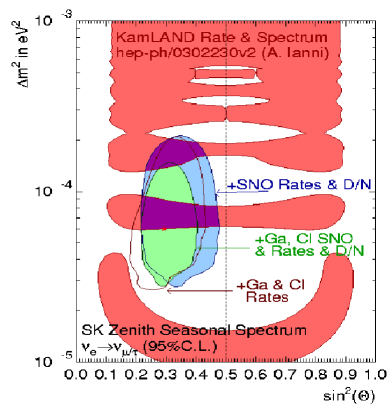
SK [46] presented the updated analysis of 1496 days data taking with MeV. In this period 22385 solar s were detected through the recoiling electron in ES interactions with sensitivity to energy and direction. The day-night asymmetry parameter is , which is consistent with zero, and the electron energy spectrum is consistent with being flat with 44% c.l.. No significant time variation or energy distortion appears in the data favoring LMA (large mixing angle) solution. Fig. 4 (on the left) shows the allowed region at 95% c.l. including SK information on rate, spectrum and time-variations, SNO measurements of CC and NC available at the time of the conference [44], radiochemical experiments and the region allowed by the measurements of the rate and of the spectrum of reactor s in KamLAND [47]. About 80% of the muon neutrino flux reaches the KamLAND detector (1 kton scintillator with a 34% PMT coverage) from reactors at 140-210 km of distance with MeV. This disappearance experiment observed a deficit of events with respect to the no-oscillation expectation of and measured the energy spectrum of prompt positrons from the reaction . The LMA region is divided into two allowed parts including KamLAND results (if CPT is conserved). After the results of SNO salt phase [43] the higher region disappears at 99% c.l. and the best fit point is eV2 and . KamLAND [47] unfortunately has not presented new results since most of the Japanese reactors have been running at much reduced efficiency due to safety controls. Preliminary results on anti-neutrinos produced in the Earth crust in U/Th decays (geo-neutrinos with between 0.9-2.5 MeV) were presented posing a limit on the Earth heat source of TW (95% c.l.), strongly dependent on the element distribution particularly of the Japanese Island Arc.
A search for possible time modulations has been presented by SK after some papers appeared claiming for periodicities very close to the time interval in which published data are binned (10 days) [48]. No significant periodicity (except for the long term modulation due to the eccentricity of the Earth orbit around the Sun) is found and modulations of 10-100 (30-100) days with amplitude larger than 10% are excluded at 95% c.l. binning data in 5 (10) days.
Even though the LMA solution seems well established, the current precision on parameters still allows for sub-dominant processes. Limits on solar appearance due to the combined effect of spin flavor precession in presence of a large enough solar magnetic field and neutrino magnetic moment ***Current best limit on the magnetic moment is from the MUNU experiment (90% c.l.) [49]. (evolving into ) and of flavor oscillations (converting ) were presented by SNO [50] and SK [51]. This search addresses the fundamental question on the nature of neutrinos, Majorana or Dirac particles. As a matter of fact, s would be detected only if s are Majorana particles, since if they are Dirac ones the electron left-handed neutrinos would convert into sterile (hence not detectable) right-handed ones. The reaction exploited by SK is inverse decay, where positrons cannot be separated by electrons and the coincident 2.2 MeV photons from neutron capture cannot be detected since their energy is below threshold (contrarily to what happens in KamLAND [49]). A 93% contamination is expected from spallation backgrounds [51]. On the other hand cleaner signatures are found in SNO [50] from the reaction thanks to 3-fold and 2 fold (e+n, nn) coincidences. Nevertheless, the efficiencies are only and 10% respectively. In Tab. 2 results are summarized including the post-conference KamLAND result [49]. Furthermore, it should be considered that alternative sources could be WIMP annihilation in the Sun, relic SN neutrinos ([52], see Sec. LABEL:montaruli:sec:collapse) and neutrino decay.
| SNO [50] | SK [51] | KamLAND [49] |
|---|---|---|
| 1.02 | 0.8 | 0.028 |
| ( MeV, 306 d) | ( MeV, 1496 d) | ( MeV, 185.5 d) |
3.2. Neutrinos from Stellar Collapse
About 99% of the binding energy ( erg) of a collapsing star goes into neutrinos: are produced during the neutronization phase which lasts about 10 ms, and neutrinos of all flavors during the thermalization phase of s. Equipartition of energy luminosity between different flavors and Fermi-Dirac spectra are expected, and average energies of MeV, even though recently detailed simulations show that is much closer than before to [53]. The largest rate of events is foreseen for inverse reactions in water/ice and scintillator detectors. In Tab. 3 the limits on the SN rates presented at this conference and others are given. As a reference, the expected SN rate in our Galaxy is 2-4 per century.
LVD [54] has presented an analysis on the effect on detected event rates due to oscillations for the normal () and inverted hierarchy cases () which could lead in conservative models to an enhancement up to events for a SN at 10 kpc emitting erg in ’s, or a suppression of events in pessimistic cases in which is very close to . Essentially the enhancement is due to the fact that if oscillate into , since they have larger average energies, their spectra are harder than for in the case of no oscillations.
| LVD [54] | SK [55] | AMANDA II [56] | MACRO [57] |
|---|---|---|---|
| 0.24 | 0.49 | 4.3 | 0.27 |
| kpc, 10 yrs | kpc, 4.7 yrs | in Galaxy, 80 hrs | in Galaxy, 10 yrs |
3.3. The Neutrino Telescope Era
The Neutrino Telescopes session (HE 2.3) contained numerous contributions indicating an intense experimental activity, aiming at the detection of the first astrophysical ’s with high energies. These neutrinos would constitute new messengers from the universe, since compared to photons which currently provide our best knowledge, they are less absorbed due to their weak interactions. Pioneer works on neutrino astronomy (see for instance the review in [58]) were initiated by tracking calorimeters (Kolar Gold Field) and water Cherenkov detectors (IMB, Kamiokande), followed by MACRO [59] and SK [60], with areas of the order of m2 and GeV looking for upward through-going muons produced by interactions in the surrounding rock.
This detection technique profits of the increase with energy of the range and the CC interaction. Typical astrophysical sources are beam dumps where protons are accelerated on matter or gas of photons producing charged mesons, or decays of very massive particles, such as topological defects. At high energies it is expected that the signal of ’s produced in beam dumps with typical power law spectra from order Fermi acceleration mechanisms , overcomes the steeper spectrum of the atmospheric background ( above 100 GeV). The rejection of the atmospheric background is achieved by measuring the up-going direction and by locating detectors below kilometers of matter. Pointing capabilities and energy measurement are relevant to reject both sources of background.
The low expected event rates from astrophysical sources and current experimental upper bounds, urged the construction of huge neutrino telescopes (areas of the order of 0.01-1 km2, located in the South Pole ice/lake/sea water depths). Essentially these are 3-dimensional arrays of PMTs that allow to reconstruct tracks in water using the times of PMTs hit by the emitted Cherenkov photons and to estimate the energy from charge measurements. Besides cascades from NC, CC and interactions (about 1/2 of from cosmological sources oscillate into assuming atmospheric oscillation parameters) are detected as point-like sources of light. The extreme environmental conditions of the locations of the experiments represent a challenge and the field is rich of successes and drawbacks. At this conference numerous results have been presented by AMANDA [61] and Lake Baikal [62]. Supported by the experience acquired with AMANDA, the challenge at the South Pole will continue with an improvement of more than 2 orders of magnitude in sensitivity with the IceCube detector, whose construction will start in the austral summer 2004-5 and will last 6 yrs [63]. The community is now looking forward to see first results from experiments in the Mediterranean: ANTARES [64] will be completed in 2006 and common efforts between ANTARES, NESTOR [65] and NEMO-RD [66] could lead to the construction of a km3 detector which would complement IceCube sky coverage. The need for huge detectors is also motivating R&D on new techniques alternative to the Cherenkov one, such is the case of the RICE radio detector [67].
 |
 |
3.4. Status of the Experiments and Results
AMANDA has presented first results of the current AMANDA-II configuration made of 677 optical modules (OM), transparent pressure resistant spheres containing PMTs, distributed over 19 strings inside a cylinder of 120 m diameter located at depths between 1500 and 2000 m in the polar ice. This layout increased the sensitivity in the high energy range of about a factor of 4 compared to AMANDA-B10 configuration active during 1995-7, with 302 OMs on 10 strings. The effective area for -induced muons is now almost uniform with declination being on average km2 at 10 TeV. The angular resolution benefits from the additional strings, being now about [68] compared to about [69] for AMANDA-B10. The absolute pointing precision is at the level of verified using the SPASE extensive air shower array (EAS) at the surface.
Two test-beams can be used by these experiments to understand systematics on efficiencies and acceptance: atmospheric muons and neutrinos. The shape of atmospheric vertical intensity as a function of the cosine of the zenith of 10 hrs data is in agreement with the simulation using CORSIKA with the QGSJET interaction model, but the data need to be reduced by 30% to agree on the normalization [70]. This is compatible with the systematics of the experiment mainly due to depth-dependent ice optical properties and bubbles formed around OMs after drilling and hence to OM sensitivities. Also the energy spectra of both beams have been reconstructed with a muon energy resolution (defined as the standard deviation of the distribution) of 0.4-0.6 between 500 GeV-5 PeV. In particular in the 1 TeV region, AMANDA atmospheric spectrum, having a fitted slope of , agrees with the Fréjus one [71]. Also a method has been developed to extrapolate the CR spectrum in the 1.5-200 TeV/nucleon region, independently of ice optical properties, OM sensitivities and detector configuration changes. This method results in a spectral index and a normalization for protons of and m-2 s-1 sr-1 TeV-1, respectively [72]. The result is in reasonable agreement with direct measurements.
AMANDA experience is precious for the construction of the km3 scale detector, IceCube [63], with 4800 DOM (Digital Optical Modules) on 80 strings spaced by m, implemented between 1400-2400 m below the surface. DOMs will exploit digital readout of 10 inch PMTs storing the full waveform with a dynamic range of 200 photoelectrons per 15 ns. The detector will be complemented by the EAS array IceTop, 80 stations close to IceCube holes made of 2 tanks filled with ice seen by DOMs [73]. IceCube declared effective area after selection cuts reaches 1 km2 at 10 TeV and the angular resolution is about above 100 TeV, improving with energy. For energies PeV upgoing are non negligibly absorbed in the Earth depending on the zenith angle. Thanks to energy cuts getting rid of atmospheric s and s, the experiment will be able to measure astrophysical down-going events.
Results from the radio-frequency detector RICE [67] were quite impressive. The detector is made of 16 radio receivers with a frequency bandwidth MHz located in holes drilled for AMANDA at depths between 100-300 m over a volume of about (200 m)3. The attenuation length in ice for radiation is km. The technique exploits the detection of few ns radio pulses produced by induced electro-magnetic cascades. A negative charge excess develops in the shower due to annihilation and extraction of from the media resulting in a coherent Cherenkov emission (Askarian effect) proportional to the square of the primary particle energy. Limits comparable to AMANDA-II sensitivity were obtained using such a cost effective technique. Given that a better rejection of the anthropogenic noise could be achieved deploying receivers deeper in the ice, the opportunity to implement receivers also in IceCube holes should be considered.
In the Northern hemisphere, the NT-200 Baikal detector is running at 1100 m depth in the Siberian Lake Baikal [62], with about 192 OMs on 8 strings. The angular resolution is about . In Mar. 2003 a prototype string has been deployed at about 100 m from the center of the detector with 6 couples of OMs; with 2 more strings the sensitivity to cascade events will be improved by a factor of 4. Baikal has measured 84 neutrino events (268 d for NT-200 and 70 d for the previous configuration NT-96) compatible with the hypothesis of being of atmospheric origin.
ANTARES [64], a European project started in 1996, is deploying a 12 string detector with a total of 900 OMs, containing 10 inch PMTs, in the Mediterranean close to the South France coasts. The effective area, estimated after selection requirements on the track reconstruction error, is km2 for TeV and the angular resolution achieves a limiting value of for TeV, mainly due to the transit time spread of PMTs and the diffusion of light in water. The ’junction box’, transmitting power and data to strings, is already lying on the sea bed at 2500 m below the surface since Dec. 2002. It is connected to a 40 km long electro-optical cable deployed in Oct. 2001. Two strings have been deployed by a manned submarine and operated between Dec. 2002 and Jul. 2003: one prototype string including 15 OMs with the final front-end electronics and the other string for environmental parameter measurements [74]. The prototyping experience allowed to verify the detector design and functionality, to find solutions to a few occurred problems, and yielded a vast amount of measurements on and on a strongly variable bioluminescence activity. It was found that this environmental background rate is below 200 KHz for of the time.
In Mar. 2003 NESTOR [65] deployed 10 km off of Pylos coast (Greece) a 12 PMT test floor of reduced dimensions compared to the hexagonal detector design (6 couples of up-down looking PMTs are located at 6 m from the center) at m depth connected to shore by a 28 km cable. Cable connection operations performed in air on a boat and data readout and transmission were successful.
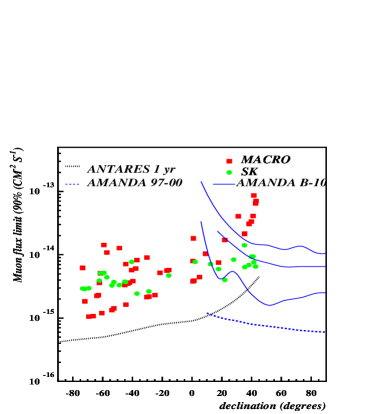
Fig. 4 (on the right) summarizes current upper limits on -induced fluxes for point-like sources and expected sensitivities as a function of their declination. The AMANDA-II sample [68] for point-like source searches consists in 699 upgoing events. Upper limits were given for a few sources and are at the level of a few cm-2 s-1. The estimated level of limits for the 97-02 data sample is shown together with published results from AMANDA-B10 [69]. Also shown are the limits by SK [60] using 2369 through-going and stopping muons with an angular resolution of about . The 354 showering events, used for Weakly Interacting Massive Particles (WIMPs) in [75], with estimated average energy of TeV could represent a ’gold’ sample for astrophysics searches. The expected sensitivity after 1 yr of data taking of ANTARES is given in [76], where a comparison of binned and unbinned likelihood ratio methods is performed.
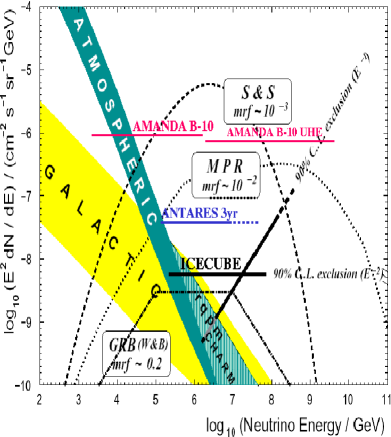
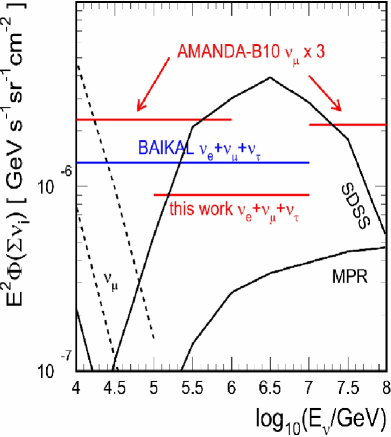
In Fig. 5 (on the left) results on upper limits on diffuse fluxes compared to models are shown. The atmospheric backgrounds are rejected through energy cuts and track reconstruction is required except for the Ultra-High Energy (UHE) AMANDA analysis [77]. The absorption of in the Earth is included.
Cascades produced by , CC and NC interactions are detected with worse angular resolution but with better energy reconstruction than events (e.g. for AMANDA and log E resolution of 0.1-0.2 between TeV PeV). Cascade events are detected from the entire solid angle, the background discrimination being possible thanks to vertex identification. Limits on diffuse fluxes of all flavor neutrinos are shown in Fig. 5 (on the right).
Many estimates on astrophysical fluxes produced after oscillations, regeneration processes and propagation in the Earth have been presented up to the EeV energy range [81,82,83,84,85]. Even though s are not absorbed in the Earth due to their regeneration chain ( CC interaction followed by fast decay which produces back and other flavor ’s), they loose energy. Hence event rates are low since leptons can be recognized at energies PeV, when range in water/ice is m. The events can be unequivocally identified if the 2 cascades from CC interaction and decay (double bang events) are detected but only a few events/yr/km2 are expected [85]. Most of the UHE events ( EeV) can be detected from the upper hemisphere in an IceCube-like detector. For a GZK model, in which UHECR make photopion interactions on the cosmic microwave background, and events in a km2 per year are expected from the upper hemisphere and a few from the lower [81].
The conversion efficiency of into for km of rock is much larger above 1 PeV than in g/cm2 of horizontal atmosphere [84]. Hence event rates in fluorescence and Cherenkov arrays due to Earth skimming s (s interacting in Earth chords of the order of a few tens of kms) or mountain events (s crossing a few tens of kms of mountain rocks and producing a shower detectable from another peak km far from the mountain) are more encouraging than event rates produced by horizontal s interacting deep in the atmosphere [84,86].
 |
 |
4. Dark Matter Searches
After the publication of WMAP data [87] cosmology entered a new precision era. About 26.7% of the universe density is due to matter, most of which is dark and only 4.4% is of baryonic nature; the remaining 73.3% is due to dark energy. Most of the searches for dark matter (DM) presented at the conference are indirect in the sense that secondaries produced by dark matter annihilation are looked for, except for the Bulby mine experimental program on DM direct detection (DM particles interact in the detector) described in [88].
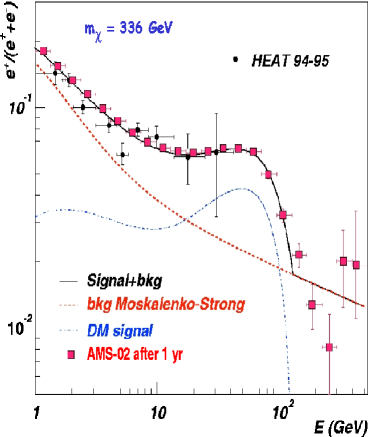
The most interesting candidates for Cold DM are WIMPs, since their annihilation cross section at the weak scale would account for the DM in the Universe. Between CDM particles, the Supersymmetric (Susy) neutralino, a linear combination of Susy partners of the photon, Z0 and neutral Higgs bosons, is one of the favorite candidates. Indirect searches for dark matter are performed by satellite, balloon and ground-based Cherenkov detectors looking for , anti-deuterons, and excesses respect to the expected secondary fluxes produced by CR interactions during diffusion in the Galaxy. Two intriguing indications of a DM component in secondary fluxes have stimulated a lot of discussions in the field. EGRET has measured a diffuse gamma-ray flux in excess compared to standard models of primary CR interactions with the interstellar medium indicating the possible presence of a diffuse source in the Galactic Center region [89]. Moreover the HEAT balloon flights in 1994-95 measured a not highly significant positron excess above secondary production models around GeV [90]. The AMS-02 experiment, to be installed on the International Space Station in 2005, will measure all these channels up to a few hundreds of GeV [91]. As an example the performances for the channel are shown in Fig. 6 (on the left). Anti-proton fluxes from neutralino annihilation using spherical isothermal distributions of DM in the halo indicate that it would be difficult to single out the DM contribution in the secondary background and to constrain the Susy parameter space [92]. Moreover the estimates are affected by uncertainties on propagation models. More optimistic predictions could be obtained using different density profiles or hypothesis about clumpy halos.
A cleaner DM signature with respect to excesses in diffuse fluxes can be monoenergetic lines produced by neutralino annihilation (,). Searches for this signal have been presented by HEGRA [93] and Milagro [94]. The HEGRA system of imaging atmospheric Cherenkov telescopes surveyed the Andromeda galaxy (M31) looking for 500 GeV-10 TeV gamma-ray emissions with an energy resolution of 10%, and derived upper limits still far from models not including dark matter clumpiness. Milagro water Cherenkov detector has looked for TeV gamma-rays from the Sun neighborhood possibly due to neutralino trapped in the solar system.
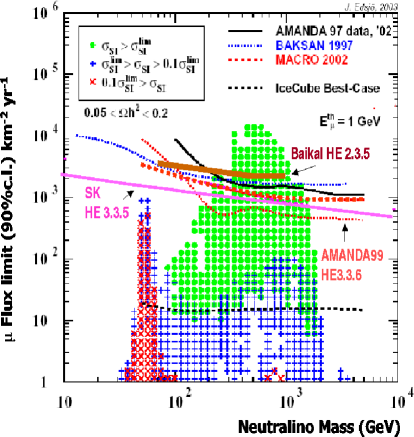
Results on indirect DM searches presented by neutrino telescopes [95, 75, 62, 102] are summarized in Fig. 6 for induced fluxes produced by neutralino annihilation in the core of the Earth (on the right).
 |
 |
5. Conclusions
At this conference, many refinements on experimental analysis have been presented in the neutrino sector, even though no striking news. Atmospheric experiments strongly indicate that muon neutrinos oscillate maximally into tau neutrinos. However, Super-Kamiokande oscillation parameter best fit value has changed a little after the analysis update. Naturally the question on how much the oscillation parameter estimate is affected by the knowledge of atmospheric beam arises, a subject widely discussed at the conference where many improved atmospheric calculations were presented. Still uncertainties are at the level of 15-30% on absolute fluxes, not affecting, however, the robustness of the result in favor of oscillations. Solar s are producing striking results in these years and provide a useful mean to investigate fundamental properties on s, such as the question if it is a Dirac or Majorana particle. This is one of the still open problems which should be addressed with efforts comparable to those which are going to be devoted on mixing matrix elements determination. The Dark Matter problem also is such a fundamental question that urge big efforts to find new evidences and to confirm already existing indications, such as the DAMA result [98].
Acknowledgments
I would like to thank the organizers of this conference, and in particular T. Kajita, for inviting and supporting me. The efficiency of the organization was really impressive. An ICRC rapporteur needs friends that help, and for this I thank F. Cafagna. Also I thank I. Sokalski, G. Battistoni, T.K. Gaisser, E.Lisi, F. Ronga, P. Lipari, M. Honda, A. Habig, A. Marini, S. Cecchini, F. Arneodo and all the people which explained me their works and taught me a lot.
6. References
1. Koshiba M. 2003, Birth of Neutrino Astrophysics, Hess lecture, this conference
2. Habig A. for Super-Kamiokande Coll. 2003, Atmospheric Neutrino Oscillations in SK-I, HE 2.2.8
3. Kasuga S. et al. 1996, Phys. Lett. B374, 238
4. See for instance: A study of vs. neutrino oscillation in atmospheric neutrinos using a K2K near detector measurement, C. Mauger, PhD Thesis, Nov. 2002, available at http://www-sk.icrr.u-tokyo.ac.jp/doc/sk/pub/index.html
5. Honda M. et al. 2003, A Precise Three-Dimensional Calculation of the Atmospheric Neutrino Flux, HE 2.4.2 and 2001, Phys. Rev. D64 053011
6. Gaisser T. K., Honda M., Lipari P. and Stanev T.S. 2001, Primary spectrum to 1 TeV and beyond, Proceedings of 27 Int. Cosmic Ray Conf. (ICRC2001), Hamburg, 7-15 Aug. 2001, http://www.copernicus.org/icrc/papers/ici6694_p.pdf
7. Kajita T. 2003, Super-Kamiokande Evidence for Muon-Neutrino Oscillations, to appear in Proc. of X Int. Workshop on “Neutrino Telescopes”, Mar. 11-14, 2003, Venice
8. Ambrosio M. et al. 2003, Measurements of Atmospheric Muon Neutrino Oscillations with MACRO. Conclusive analysis of the data collected with MACRO, in preparation
9. Sanchez M. et al. 2003, Observation of Atmospheric Neutrino Oscillations in Soudan 2, subm. to Phys. Rev. D and hep-ex/0307069
10. Sala P.R. for ICARUS Coll. 2003, Status of the ICARUS Project, HE 2.5.2
11. Moriyama S. for Super-Kamiokande Coll. 2003, Characterizing the Atmospheric Neutrino Flux, HE 2.2.10
12. Lipari P. 2000, Astrop. Phys. 14, 171
13. Nakayama S. for Super-Kamiokande Coll. 2003 Study of Atmospheric Neutrino Oscillations Using Events in SK-I, HE 2.2.9
14. Saji C. for Super-Kamiokande Coll. 2003 Search for Charged Current Tau Neutrino Appearance in Super-Kamiokande, HE 2.2.11
15. Gaisser T.K. and Honda M. 2002, Ann. Rev. Part. Sci. 52, 153
16. Engel R. et al. 2003, TARGET 2.2 - A Hadronic Interaction Model for Studying Inclusive Muon and Neutrino Fluxes, HE 3.1.7
17. G. Barr et al. 2003, A 3-dimensional Atmospheric Neutrino Flux Calculation, 1-P-272
18. Battistoni G., Ferrari A., Montaruli T. and Sala P.R. 2003, High Energy Extension of the FLUKA Atmospheric Neutrino Flux, 1-P-270, all references and flux tables in http://www.mi.infn.it/%7ebattist/neutrino.html; FLUKA official WEB page: http://www.fluka.org
19. Engel R. 2003, Influence of Low-Energy Hadronic Interaction Programs on Air Shower Simulations with CORSIKA, HE 2.1.5
20. Wentz J. et al. 2003 Simulation of Atmospheric Neutrino Fluxes with CORSIKA, 1-P-271
21. Derome L., Liu Y. and Buenerd M. 2003, 3-Dimensional Simulation of Atmospheric Muon and Neutrino Flux, HE 2.4.1
22. Alcaraz J. et al. 2000 Phys. Lett. B490, 27 and 2000 Phys. Lett. B494, 193
23. Sanuki T. et al. 2000 Astrop. J. 545, 1135
24. Boezio M. et al. 1999, Astrop. J. 518, 457
25. Boezio M. et al. 2003, Astrop. Phys. 19, 583
26. Asakimori K. et al. 1998, Astrop. J. 502, 278
27. Makoto H. for RUNJOB Coll., Primary Proton and Helium Spectra Observed by RUNJOB, OG 1.1.17
28. Apanasenko et al. 2001, in Proc. of Int. Cosmic Ray Conf. (ICRC99), Salt Lake City, 17-25 Aug. 1999
29. Agrawal V., Gaisser T.K., Lipari P. and Stanev T.S. 1996, Phys. Rev D53 1314
30. Zatsepin V.I. et al. 2003, Rigidity Spectra of Protons and Helium as Measured in the First Flight of the ATIC Experiment, OG 1.1.15
31. Battiston R., Rapporteur talk on OG1.1-2, OG1.5, this conference
32. Bertaina M. for EAS-TOP and MACRO Coll. 2003, The Proton, Helium and CNO Fluxes at TeV from the EAS-TOP (Cherenkov) and MACRO (TeV Muon) Data at the Gran Sasso Laboratory, HE 1.1.15
33. Hebbeker T. and Timmermans C. 2002, Astrop. Phys. 18, 107
34. Kremer J. et al. 1999, Phys. Rev. Lett. 83, 4241
35. Tanizaki K. for the BESS Coll. 2003, Geomagnetic Cutoff Effect on Atmospheric Muon Spectra at Ground Level, HE 2.1.7, Abe K. et al. 2003, Phys Lett. B564, 8
36. Unger M. for the L3+Cosmic Coll. 2003, Measurement of the Atmospheric Muon Spectrum from 20 to 2000 GeV, HE 2.1.10
37. Zimmerman D. for the CosmoALEPH Coll. 2003, The Cosmic Ray Muon Spectrum and Charge Ratio in CosmoALEPH, HE 2.1.11
38. Motoki M. et al. 2003, Astrop. Phys. 19, 113
39. Sanuki T. et al 2002, Phys. Lett. B541, 234
40. Tsuji S. for OKAYAMA Coll. 2003, Atmospheric Muon Measurement at Sea Level IV: Muon Charge Ratio, HE 2.1.6
41. Abe K. et al. 2003, Calculation of Muon Fluxes at the Small Atmospheric Depths, HE 2.4.6
42. Stanev T.S. et al. 2003, Comparison between CAPRICE98 Atmospheric Muon Data and Simulations with TARGET, HE 2.4.9
43. Ahmed S.N. et al. 2003, Measurement of the total active 8B Solar Neutrino Flux at the Sudbury Neutrino Observatory with Enhanced Neutral Current Sensitivity, in print and nucl-ex/0309004
44. Kutter T. for SNO Coll. 2003, Solar Neutrino Results from the Sudbury Neutrino Observatory, HE 2.2.4
45. Bahcall J.N. et al. 2001, Astrop. J. 555, 990
46. Koshio Y. for Super-Kamiokande Coll. 2003 Recent Results of Solar Neutrino Measurement in Super-Kamiokande, HE 2.2.2 and Suzuki Y., Neutrino Oscillation, plenary talk
47. Mitsui T. for KamLAND Coll. 2003 First Results from KamLAND, HE 2.2.1 and Eguchi K. et al. 2003, Phys. Rev. Lett. 90, 021802
48. Yoo J. for SK Coll. 2003, A Study of Short-Time Periodic Variation of 8B Solar Neutrino Flux at Super-Kamiokande, HE 2.2.5
49. Eguchi K. et al. 2003, in press and hep-ex/0310047
50. Kutter T. for SNO Coll. 2003Antineutrino Search at the Sudbury Neutrino Observatory, 1-P-252
51. Gando Y. 2003, Search for from the Sun at Super-Kamiokande-I, HE 2.2.3
52. Malek M.S. for Super-Kamiokande Coll., Supernova Relic Neutrino Search Results from Super-Kamiokande, HE 2.3.1
53. Keil M.K., Raffelt G. and Janka H. 2002, Astrop. J. 590, 971
54. Fulgione W. for LVD Coll. 2003, 10 Years Search for Neutrino Bursts with LVD, HE 2.3.9 and Selvi M. for LVD Coll. 2003, Study of the Effect of Neutrino Oscillation in the Supernova Neutrino Signal with the LVD detector, 1-P-255
55. Namba T. for Super-Kamiokande Coll. 2003, Search for Neutrino Bursts from Supernova Explosions at Super-Kamiokande, HE 2.3.3
56. Feser T. for AMANDA Coll. 2003, Online Search for Neutrino Bursts from Supernovae with the AMANDA Detector, 1-P-258
57. Cei F., private communication
58. Learned J.G. and Mannheim K. 2000, Ann. Rev. Nucl. Part. Sci. 50, 679
59. Ambrosio M. et al. 2001 Astrop. J. 546, 1038 and Montaruli T., Neutrino Astrophysics to appear in Proc. of TAUP2003 Conference, Seattle, 5-9 Sep 2003
60. Washburn K. for Super-Kamiokande Coll. 2003, A Search for Astronomical Neutrino Sources with the Super-Kamiokande Detector, HE 2.3.1
61. Köpke L., Recent Results from AMANDA Neutrino Telescope, highlight talk and http://amanda.uci.edu
62. Kowalski M.P. for Baikal Coll. 2003, Results from the BAIKAL Neutrino Telescope, HE 2.3.11
63. Yoshida S. for IceCube Coll 2003, The IceCube high energy neutrino telescope, HE 2.3.12
64. Montaruli T. for the ANTARES Coll. 2003, ANTARES Status Report, 1-P-262 and http://antares.in2p3.fr
65. Grieder P.K.F. for NESTOR Coll. 2003, NESTOR Neutrino Telescope Status Report, 1-P-266
66. NEMO-RD Home page: http://nemoweb.lns.infn.it
67. Seunarine S. for RICE Coll. 2003, Updated limits on the Ultra-High Energy Neutrino Flux from the RICE Experiment at the South Pole, HE 2.3.10
68. Karle A. for AMANDA Coll. 2003, Search for Extraterrestrial Point Sources of Neutrinos with AMANDA-II, HE 2.3.5
69. Ahrens J. et al. 2003, Astrop. J. 583, 1040
70. Desiati P. for AMANDA Coll. 2003, Response of AMANDA-II to Cosmic Ray Muons, 1-P-265
71. Geenen H. for AMANDA Coll. 2003, Atmospheric Neutrino and Muon Spectra Measured with the AMANDA-II Detector, HE 2.3.6
72. Chirkin D.A. for AMANDA Coll. 2003, Cosmic Ray Flux Measurement with AMANDA-II, HE 2.1.13
73. Gaisser T.K. for IceTop Coll. 2003, IceTop: the Surface Component of IceCube, HE 1.5.31
74. Circella M. for ANTARES Coll. 2003, Toward the ANTARES Neutrino Telescope: Results from a Prototype Line, HE 2.5.1
75. Desai S.A. for Super-Kamiokande Coll. 2003, Study of Upward Showering Muons in Super-Kamiokande, HE 3.3.5
76. Heijboer A. for ANTARES Coll. 2003, Point Source Searches with the ANTARES Neutrino Telescope, HE 2.3.7
77. Hundertmark S. for AMANDA Coll. 2003, AMANDA-B10 Limit on UHE Muon-Neutrinos, 1-P-256
78. Colin Hill G. for AMANDA Coll. 2003, Search for Diffuse Fluxes of Extraterrestrial Muon-Neutrinos with the AMANDA Detectors, 1-P-257
79. Romeyer A. for ANTARES Coll. 2003, Muon Energy Reconstruction in ANTARES and its Application to the Diffuse Neutrino Flux, HE 2.3.8
80. Kowalski M.P. for AMANDA Coll. 2003, Search for High Energy Neutrinos of All Flavors with AMANDA-II, HE 2.3.4
81. Yoshida S. 2003, Propagation of Extremely High Energy Leptons in the Earth, 1-P-282
82. Dutta S.I., Mocioiu I., Reno M.H. and Sarcevic I. 2003, Tau Neutrinos at EeV Energies, 1-P-276
83. Athar et al. 2003, High Energy Tau Neutrinos: Production, Propagation and Prospects of Observations, HE 2.4.3
84. Huang M.A., Tseng J.J. and Lin G.L. 2003, Energy Fluctuation of Tau Leptons Emerging from Earth, 1-P-275
85. Bugaev E., Montaruli T. and Sokalski I. 2003, Detection of Tau Neutrinos in Underwater Neutrino Telescopes, 1-P-267
86. Cao Z. et al. 2003, Ultra High Energy Detection Using Air Shower Fluorescence/Cerenkov Light Detector, HE 2.3.13
87. Spergel D.N. et al. 2003, Astrophys. J. Suppl. 148, 175
88. Carson M.J. for Boulby Dark Matter Coll. 2003, Dark Matter Experiments at Boulby Mine, HE 3.3.9
89. Morselli A: et al. 2003, Search for Supersymmetric Dark Matter with GLAST, HE 3.4.3
90. Barwick S.W. et al. 1997, Astrophys. J. 482, 963
91. Lamanna G. for AMS Coll. 2003 ,Astroparticle Physics with AMS-02, HE 3.4.1
92. Donato F. et al. 2003, Cosmic Ray Antiprotons from Relic Neutralinos in a Diffusion Model, 2-P-290
93. Hofmann W. for HEGRA Coll. 2003, Search for TeV Gamma-Rays from the Andromeda Galaxy and for Supersymmetric Dark Matter in the Core of M31, HE 3.3.7
94. Fleysher L. for Milagro Coll. 2003, Search for Relic Neutralinos with Milagro, HE 3.3.3
95. Olbrechts P. for AMANDA Coll. 2003, Search for Muons from WIMP Annihilation in the Center of the Earth with the AMANDA-B10 Detector, HE 3.3.6
96. Gondolo P., Edsjö J., Bergström L., Ullio P. and Baltz T.,
http://www.physto.se/%7eedsjo/darksusy
97. Ambrosio M. et al. 1999, Phys. Rev. D60, 082002 and Montaruli T., Neutrino measurement with MACRO: neutrino oscillation, dark matter and astronomy studies Les Houches, Proc. of School and Workshop on Neutrino Particle Astrophysics, Les Houches, 21 Jan-1 Feb, available at http://leshouches.in2p3.fr
98. Bernabei R. et al. 2003, Further Results on the WIMP Annual Modulation Signature by DAMA/NaI, to appear in Proc. of TAUP2003, Seattle, 5-9 Sep. 2003
99. Feldman G.J. and Cousins R.D. 1998, Phys. Rev. D57, 3873
100. Waxman E. and Bahcall J.N. 1999, Phys. Rev. D59, 023002
101. Benoit A. et al. 2002, Phys. Lett. B545, 43
102. Thompson L. for ANTARES Coll. 2003, Dark Matter Searches with the ANTARES Neutrino Telescope, HE 3.4.4.