New bounds on the mass of a b’ quark
Abstract
In this work we present limits on a sequential down-type quark, , based on the most recent DELPHI data. Using all available experimental data for GeV we conclude that a sequential four generations model is far from being experimentally excluded.
12.15.Ff, 12.15.Lk, 12.60.-i
1 Introduction
The Standard Model (SM) of the electroweak interactions start to show some difficulties in explaining recent experimental data especially in the fermionic sector. What about a fourth family of fermions? Is is experimentally ruled out? Cancellation of gauge anomalies require the addition of a family of leptons for each family of quarks added to the SM. Since the number of light neutrinos () is definitely equal to three [1] the new lepton family has to accommodate a neutrino with a mass larger than around 45 GeV. Hence, if a sequential fourth family exists it certainly has to show a much different structure in the leptonic sector.
Despite the strength of the previous argument one should try to experimentally exclude the existence of a fourth generation. In fact such evidence does not yet exist. The most recent precision electroweak results [2] allow a sequential fourth generation if the quark masses are not too far apart. The same results also disfavour a degenerate fourth family if both the leptonic and hadronic sector are degenerate. This is in agreement with the conclusions of Erler and Langacker [1]. However, it was shown in [3] that even if one takes a degenerate fourth family of quarks with 150 GeV masses, it is enough to choose a non-degenerate family of leptons with masses of 100 GeV and 200 GeV and a Higgs mass of 180 GeV for the discrepancy with experimental data to fall from roughly three to two standard deviations. Moreover, it is clear that any new physics will also influence these results.
It was shown in refs. [3, 4] that the mass range GeV, where and are the fourth generation quarks, is consistent with the precision electroweak data on the parameter. This range enable us to say that even if , the decay is forbidden. The decay although allowed, is phase space suppressed and consequently extremely small in the mass range under study (from now on we consider ). Experimental data allow us to go only up to close to GeV. Hence, the can not decay to a top quark. Furthermore, while some recent studies (see [5]) have constrained the Cabibbo-Kobayashi-Maskawa (CKM) elements of the fourth generation, they do not influence our results. Nevertheless we will take into account the bound [6] coming from to constrain the CKM element .
There are presently three bounds on the mass for GeV and all of them suffer from the drawback of assuming a 100 % branching ratio for a specific decay channel. The first one [7], GeV, assumes that . We will drop this condition and use instead their plot of as a function of the mass. The second one [8] GeV, is based on the data collected in the top quark search. Because the D0 collaboration looked for , the analysis can be used to set a limit on . By doing so we assume that the and quark masses are negligible and that . The obtained limit GeV assumes . The third bound is from CDF [9] and is based on the decay followed by the search for with displaced vertices. They also assume and their excluded region depends heavily on the lifetime. This means we can not use this limit in our analysis (for a discussion see [5]).
Hence, we think it is worthwhile to reexamine the limits on the mass. We will use the CDF and the D0 data which, together with the new DELPHI data [10], is all there is available for GeV. We will draw exclusion plots in the planes (, ) and (, ), where , from 96 GeV to 190 GeV without assuming a definite value for the branching ratios of specific channels. Notice that the use of the variable provides a new way to look at the experimental results. This variable enable us to actually use and combine all the available data. Moreover, the new form in which the results are presented will serve as a guide to future experiments since it is possible to know how far one has to go to exclude the regions that are still allowed.
2 b’ production and decay
At LEP, a pair of quarks is produced via . The corresponding cross section was calculated using Pythia [11] with initial state radiation (ISR), final state radiation and QCD corrections turned on. The results were cross checked in [5] and agree very well with the Pythia results.
The equivalent process at the Tevatron is with the relevant processes being . Due to its hadronic nature, this cross section is equal to the top quark production one and it is known to order [12]. This approximation is used both by the CDF and the D0 collaborations in their studies on production and decay.
Two body decays occur either through neutral currents (NC) or through charged currents (CC). Although NC proceed only via loops, it was shown in [13] that depending on the values of the CKM matrix elements and on the values of the quark masses, they can be comparable to CC decays. The reason is simple: if and are not allowed, the dominant CC decay is which is doubly Cabbibbo suppressed.
As long as the Higgs channel is closed the dominant neutral decay is . Other neutral decays like and give smaller contributions but can sometimes be relevant. As soon as the Higgs channel opens the decay can be as large as .
The three body decays , and , including box diagrams were calculated in [14]. Using the results in [14] we estimate [5] that all three body decays plus the decay are smaller than . Nevertheless, because we want to make a conservative estimate we will take it to be as large as .
Taking and and using the unitarity of the CKM matrix we obtain . Thus, we can write all branching fractions as a function of three quantities alone: , and .
One-loop calculations of the NC decays were performed using the FeynArts, FeynCalc [15] and the LoopTools/FF [16] packages. We have carried out several checks in the four generations model following [4, 13, 14] and we have found full agreement.
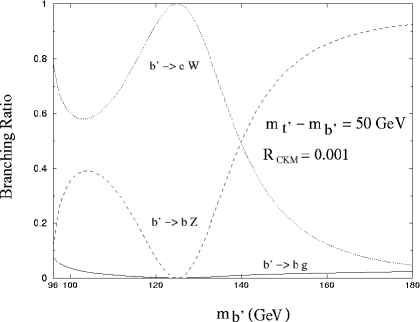
To decide on the relevant values of and to use, we present in fig. 1 the branching ratios as a function of the mass with and GeV. The closer to GeV we are the larger gets due to phase space suppression of the competing NC . In fact, for an almost degenerate fourth family and small values of , can be the dominant NC for GeV. As soon as one moves away from this value, becomes the dominant NC. If the Higgs channel is closed , for GeV, the competition is always between and . As rises so does the NC except if the Glashow-Iliopoulos-Maiani (GIM) mechanism gets in the way. It can be clearly seen in the figure the GIM mechanism acting for GeV, that is, . Then the NC rises again and the CC falls crossing at 140 GeV. When grows so does and the crossing point is shifted to the left. As the mass difference tends to zero the GIM effect is shifted to .
3 Results and discussion
Using the latest experimental data from the DELPHI collaboration and the data from the CDF and D0 collaborations together with the theoretical values of the cross sections and the branching ratios we have drawn the exclusion plots shown in the figures below.
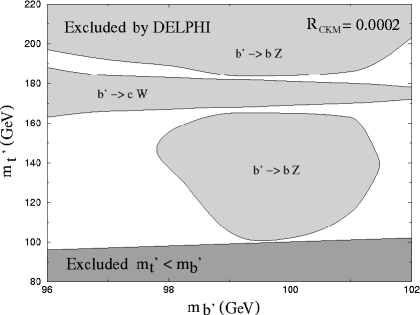
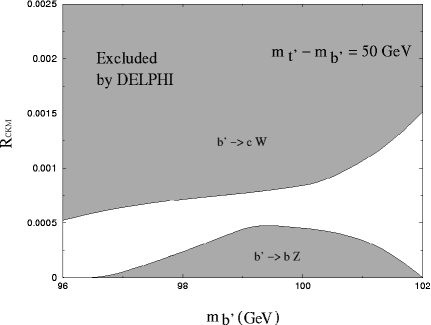
The results based on the DELPHI data, are shown in figs. 2 and 3. The excluded regions in the two plots due to the limits on are the stripe centred in in fig.2 and the upper excluded region in fig.3. The remaining excluded regions are due to limits on . When , decreases as a consequence of a GIM suppression and becomes dominant. In fact, when , . Thus, there is always an excluded stripe around . As grows, i.e., CC dominates, the stripe gets larger and the other two regions in fig. 2 get smaller. This can also be seen in fig. 3 where for everything is excluded. Obviously this will change if we change the mass difference.
The reason why there isn’t a lower bound close to 96 GeV in fig.3 is because of the competing NC. Close to the threshold ( 96 GeV), dominates over and the experimental bound on becomes useless. As one moves away from the threshold, becomes the dominant NC. After 102 GeV almost all values are allowed because the experiments are not sensitive to those mass values.
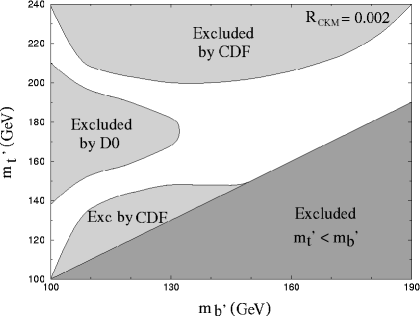
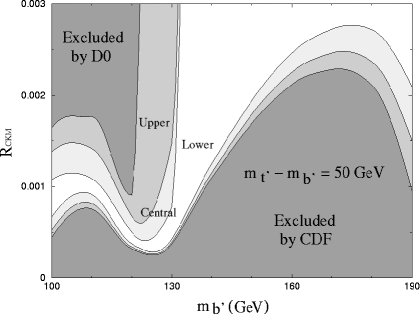
In figs. 4 and 5 we show similar plots but using the CDF and the D0 data. The behaviour follow the general trend explained for the DELPHI data. The D0 deals with the CC and the CDF deals with the NC. The three curves marked upper, central and lower in fig. 5 are related with the theoretical error bars in the production cross section. In fig. 4 we have used central values for the cross sections. Again and for the same reason we see a stripe around in fig. 4. The stripe ends, as it should, for close to 130 GeV which is approximately the D0 bound on . Notice that whatever the value of is, one can always find an allowed if is not too large. As , and we recover the CDF bound [7].
In some cases the allowed regions in the CDF/D0 and DELPHI plots overlap and the excluded region grows. For instance, considering GeV and GeV we get for DELPHI and for CDF/D0 (lower) . Hence, the resulting excluded region is .
4 Conclusion
Using all available experimental data for GeV we have shown that there is still plenty of room for a sequential with a mass larger than 96 GeV. This is our main conclusion. We have also shown that the allowed region depends heavily on the values of and . The region where is always excluded due to a 100 % CC. All plots show that is somewhere between and which is a reasonable value regarding the CKM elements known so far. In fact, those CKM values suggest that . If then a value of between and is absolutely natural. Moreover, the limit we have obtained for in the last section makes it even more natural.
We know that the DELPHI and also the CDF analysis are being improved and we hope to shrink the allowed region with this new data.
As for the future, searches in hadron colliders will have to wait for the RunII of the Tevatron and for the Large Hadron Collider (LHC). The production cross section increases by roughly two orders of magnitude at the LHC compared to the Tevatron. Thus LHC will be a copious source of pairs. With high values for cross section and luminosity, if background is suppressed exclusion plots can be drawn for a very wide range of masses. For a detailed discussion on future searches see [3].
In summary we believe that there is still experimental and theoretical work to be done to find or definitely to exclude a sequential fourth generation of quarks at the electroweak scale.
This work is supported by Fundação para a Ciência e Tecnologia under contract POCTI/FNU/49523/2002. S.M.O. is supported by FCT under contract SFRH/BD/6455/2001.
References
- [1] K. Hagiwara et al. [Particle Data Group Collaboration], Phys. Rev. D 66, 010001 (2002).
- [2] V. A. Novikov, L. B. Okun, A. N. Rozanov and M. I. Vysotsky, Phys. Lett. B 529, 111 (2002).
- [3] P. H. Frampton, P. Q. Hung and M. Sher, Phys. Rept. 330, 263 (2000).
- [4] A. Arhrib and W. S. Hou, Phys. Rev. D 64, 073016 (2001).
- [5] S. M. Oliveira and R. Santos, arXiv:hep-ph/0307318.
- [6] T. Yanir, JHEP 0206, 044 (2002), and references therein.
- [7] T. Affolder et al. [CDF Collaboration], Phys. Rev. Lett. 84, 835 (2000).
- [8] S. Abachi et al. [D0 Collaboration], Phys. Rev. D 52, 4877 (1995). C. D. Froggatt, D. J. Smith and H. B. Nielsen, Z. Phys. C 73, 333 (1997).
- [9] F. Abe et al. [CDF Collaboration], Phys. Rev. D 58, 051102 (1998).
- [10] S. Andringa et al. [DELPHI Collaboration], Search for a fourth generation -quark at LEP-II at = 200-209 GeV. Contributed paper to EPS 2003 (Aachen) and LP 2003 (Fermilab).
- [11] T. Sjostrand, P. Eden, C. Friberg, L. Lonnblad, G. Miu, S. Mrenna and E. Norrbin, Comput. Phys. Commun. 135, 238 (2001).
- [12] E. Laenen, J. Smith and W. L. van Neerven, Phys. Lett. B 321, 254 (1994).
- [13] W. S. Hou and R. G. Stuart, Phys. Rev. Lett. 62, 617 (1989).
- [14] W. S. Hou and R. G. Stuart, Nucl. Phys. B 349, 91 (1991).
- [15] T. Hahn, Comp. Phys. Comm. 140, 418 (2001); J. Küblbeck, M. Böhm and A. Denner, ibid. 60, 165 (1990); R. Mertig, M. Böhm and A. Denner, ibid. 64, 345 (1991).
- [16] G. J. van Oldenborgh and J. A. Vermaseren, Z. Phys. C 46, 425 (1990); T. Hahn and M. Perez-Victoria, Comp. Phys. Comm. 118, 153 (1999).