Corresponding author
Prof. Dr. H.V. Klapdor-Kleingrothaus
Max-Planck-Institut für Kernphysik
Saupfercheckweg 1
D-69117 HEIDELBERG
GERMANY
Phone Office: +49-(0)6221-516-262
Fax: +49-(0)6221-516-540
email:
Background Analysis around Qββ for
Double Beta Decay experiments, and Statistics
at Low Count Rates
H.V. Klapdor-Kleingrothaus1, A. Dietz1,
I.V. Krivosheina1,2, C. Dörr1, C. Tomei3
1Max-Planck-Institut für Kernphysik, P.O. 10 39 80
D-69029 Heidelberg, Germany
2Radiophysical-Research Institute, Nishnii-Novgorod,
Russia
3Universita degli studi di L’Aquila, Italy
Abstract
The background in the region of the Q-value for neutrinoless double beta decay of has been investigated by different methods: Simulation with GEANT 4 of the HEIDELBERG-MOSCOW experiment, analysis of other Ge double beta experiments. Statistical features of the analysis at very low count rates are discussed.
1 Introduction
Recently first experimental evidence has been reported for neutrinoless double beta decay. Analysis of 55 kg y of data, taken by the HEIDELBERG-MOSCOW experiment in the GRAN SASSO over the years 1990 - 2000, has led [1, 2, 3, 4] to a half-life
| (1) |
with best value of y, for the decay of the double beta emitter 76Ge
| (2) |
Assuming the decay amplitude to be dominated by exchange of a massive Majorana neutrino (see, e.g. [5]), this half-life results in a value of the effective neutrino mass
| (3) |
with best value of 0.39 eV.
Here a 50% uncertainty in the nuclear matrix elements
has been taken into
account (for details see [3]).
This is for the first time that the absolute scale of the neutrino mass spectrum has been fixed, which cannot be achieved by neutrino oscillation experiments. This result restricts possible neutrino mass scenarios to degenerate or (still marginally allowed) inverse hierarchy [6, 7, 8]. In the degenerate case it leads to a common neutrino mass eigenvalue of
| (4) |
This result is nicely consistent with later collected or analyzed
experimental data, such as results from Large Scale Structure
and CMB measurements
[9, 10, 11],
or ultra-high energy cosmic rays
[12].
The former yield an upper limit of =1.0 eV
(corresponding in the degenerate case to a common mass
eigenvalue eV).
The Z-burst scenario for ultra-high energy cosmic
rays requires 0.1 - 1.3 eV
[12].
Tritium single beta decay cuts the upper range in
eq.(4) down to 2.2 or 2.8 eV
[13].
There is further theoretical support for a neutrino mass in the range
fixed by the HEIDELBERG-MOSCOW experiment. A model based
on an A4 symmetry of the neutrino mass matrix requires the
neutrinos to be degenerate and the common mass eigenvalue to be
0.2 eV
[14].
Starting with the hypothesis that quark and lepton mixing are
identical at or near the GUT scale, Mohapatra et. al. [15] show
that the large solar and atmospheric neutrino mixing angles can be
understood purely as result of renormalization group evolution, if
neutrino masses are quasi-degenerate (with same CP parity). The common
Majorana neutrino mass then must be larger than 0.1 eV.
In this paper we report additional support of the double beta result of
[1, 2, 3, 4],
by further discussion of the structure
of the experimental background, by statistical considerations
and by analysis of other double
beta experiments investigating the decay of 76Ge.
Important points in the analysis of the measured spectrum are the structure of the background around (=2039.006(50) keV [16]), and the energy range of analysis around .
2 Structure of Background Around Qββ in Different Ge Double Beta Experiments
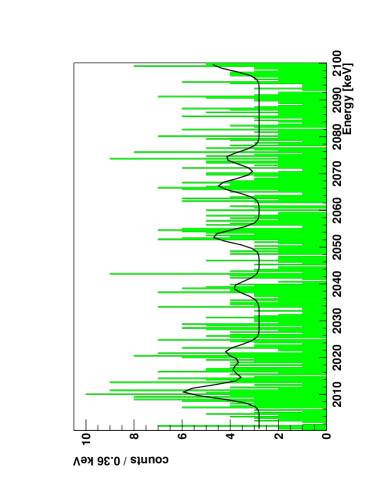
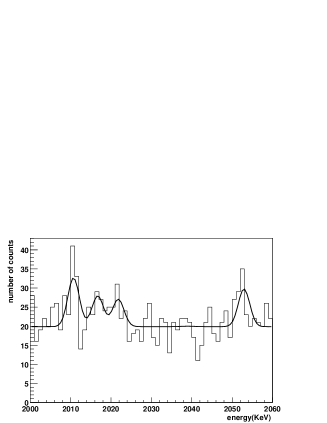
Fig. 1 shows the spectrum measured in the range 2000 - 2100 keV in its
original binning of 0.36 keV. By the peak search procedure
developped
[2, 3]
on basis of the Bayes and Maximum Likelihood Methods, exploiting as
important input parameters the experimental knowledge on the shape and
width of lines in the spectrum, weak lines of 214Bi have
been identified at the energies of 2010.78, 2016.7, 2021.6
and 2052.94 keV
[1, 2, 3, 4].
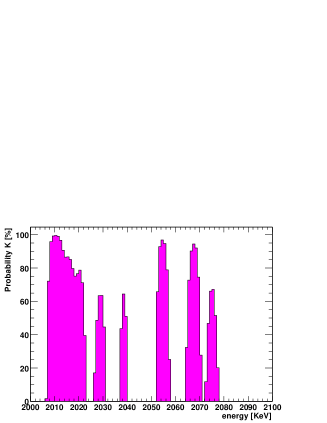
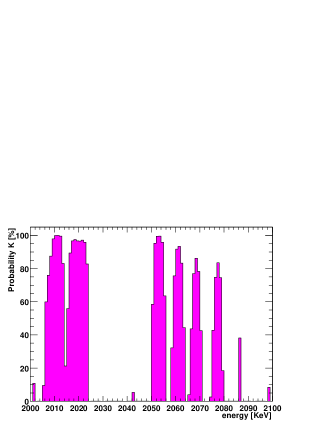
Fig. 2 shows the probability that there is a line of correct
width and of Gaussian shape at a given energy, assuming all
the rest of the spectrum as
flat background (which is a highly conservative assumption),
for the HEIDELBERG-MOSCOW experiment.
The intensities of these lines have been shown to be consistent
with other, strong Bi lines in the measured spectrum according
to the branching ratios
given in the Table of Isotopes
[17],
and to Monte Carlo simulation of the experimental setup
[3].
Note that the 2016 keV line, as an E0 transition,
can be seen only by coincident summing of the two successive lines
keV
and keV. Its observation proves that the 238U
impurity from which
it is originating, is located in the Cu cup of the detectors.
Recent measurements of the spectrum of a 214Bi source as
function of distance source-detector confirm
this interpretation
[18].
Premature estimates of the Bi intensities given in Aalseth et.al,
hep-ex/0202018 and Feruglio et.al., Nucl. Phys. B 637 (2002), 345,
are incorrect, because this long-known spectroscopic
effect of true coincident summing
[20]
has not been taken into account, and also no simulation
of the setup has been performed (for details see
[3, 19]).
These 214Bi lines occur also in other investigations
of double beta decay
with Ge - and - even more important - also the additional structures in
Fig. 2, which cannot be attributed at present, are seen in these
other investigations.
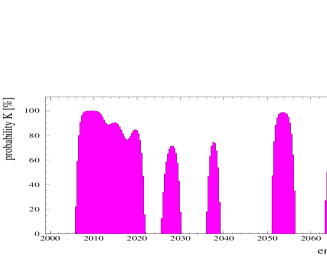
There are three other Ge experiments which have looked for double beta decay of 76Ge. First there is the experiment by Caldwell et al. [21], using natural Germanium detectors (7.8% abundance of 76Ge, compared to 86% in the HEIDELBERG-MOSCOW experiment). This was the most sensitive natural Ge experiment. With their background a factor of 9 higher than in the HEIDELBERG-MOSCOW experiment and their measuring time of 22.6 kg y ears, they had a statistics of the background by a factor of almost four l a r g e r than in the HEIDELBERG-MOSCOW experiment. This gives useful information on the composition of the background.
Applying the same method of peak search as used in Fig.
2,
yields indications for peaks essentially at the same energies as in
Fig.
2 (see Fig. 3).
This shows that these peaks are not fluctuations. In particular
it sees the 2010.78, 2016.7, 2021.6 and 2052.94 keV 214Bi lines,
but a l s o the unattributed lines at higher energies.
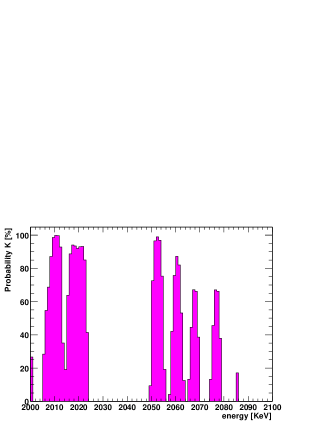
It finds, however, n o line at 2039 keV. This is consistent with the
expectation from the rate found in the HEIDELBERG-MOSCOW experiment.
About 16 observed events in the latter correspond to to 0.6 expected
events in the Caldwell experiment, because of the use of non-enriched
material and the shorter measuring time. Fit of the Caldwell spectrum
allowing for the 214Bi lines and a 2039 keV line
yields 0.4 events for the latter (see Fig.
4).
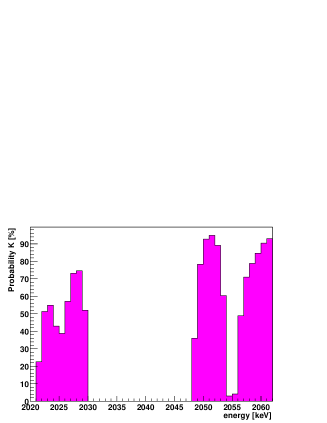
The first experiment using enriched (but not high-purity) Germanium 76
detectors was that of Kirpichnikov and coworkers
[22].
These authors show only the energy range between 2020 and 2064 keV of
their measured spectrum.
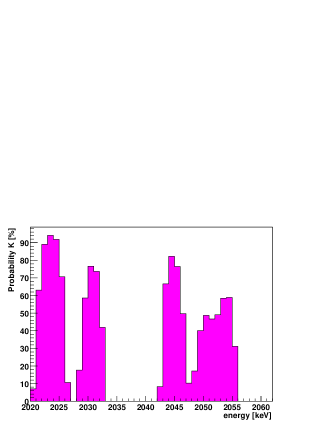
The peak search procedure finds also here indications of lines
around 2028 keV and 2052 keV (see fig.
5,
but n o t any indication of a line at 2039 keV.
This is consistent with the expectation, because for their low
statistics of 2.95 kg y they would expect here (according to
HEIDELBERG-MOSCOW) 0.9 counts.
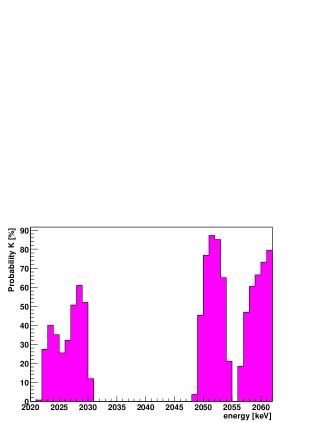
Another experiment (IGEX) used between 6 and 8.8 kg
of enriched 76Ge, but collected since beginning
of the experiment in the early nineties
till shutdown in 1999 only 8.8 kg years of statistics
[23, 24].
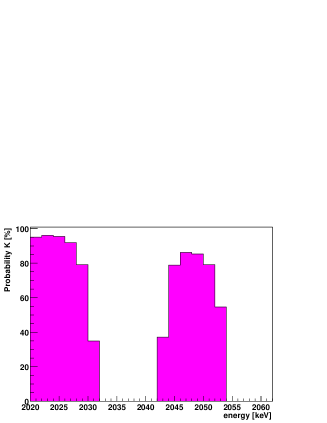
The authors of
[23, 24]
unfortunately show only the range 2020 to 2060 keV
of their measured spectrum in detail. Fig.
6
shows the result of our peak scanning of this range.
Clear indications are seen for
the Bi lines at 2021 and 2052 keV, but also
of the unidentified structure around 2030 keV.
Because of the conservative assumption on the background
treatment in the scanning procedure (see above) there
is no chance to see a signal at 2039 keV because of the ’hole’
in the background of that spectrum (see Fig. 1 in
[23]).
With some good will one might see, however,
an indication of 3 events here, consistent with the expectation of the
HEIDELBERG-MOSCOW experiment of 2.6 counts.
It may be noted that all three experiments with enriched
76Ge see a line around 2028 keV.
It was already mentioned in
[25],
that it is suspicious that this line which is seen also
clearly in the pulse-shape
analyzed spectrum of the HEIDELBERG-MOSCOW experiment
(see
[1, 2, 3])
differs in energy from just by the K-shell
X-ray energies of Ge (Se)
of 9.2 (10.50) keV, or the K shell electron atomic binding energies
of 11.10 (12.66) keV (see
[17]),
and that this might point to a partly not understood
mechanism of the double beta decay process.
3 Statistics at Low Count Rates - Peak Search, and Analysis Window
At this point it may be useful to demonstrate the potential of the used
peak search procedure.
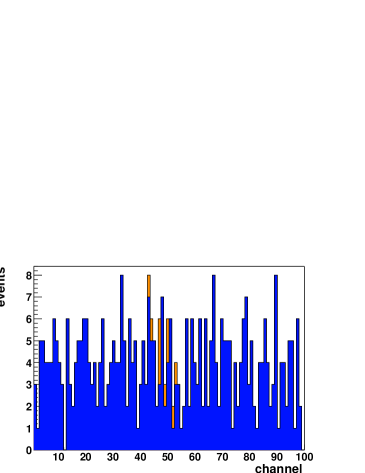
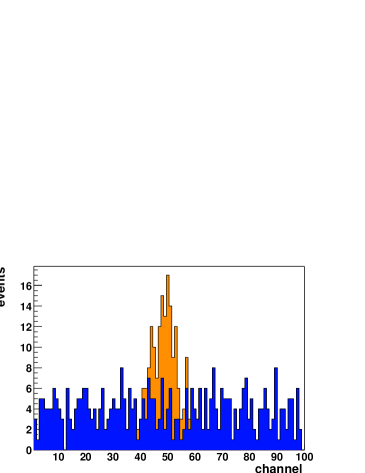
Fig. 7
shows a spectrum with Poisson-generated background of
4 events per channel and a Gaussian line with width (standard
deviation) of 4 channels centered at channel 50, with intensity of 10
(left) and 100 (right) events, respectively.
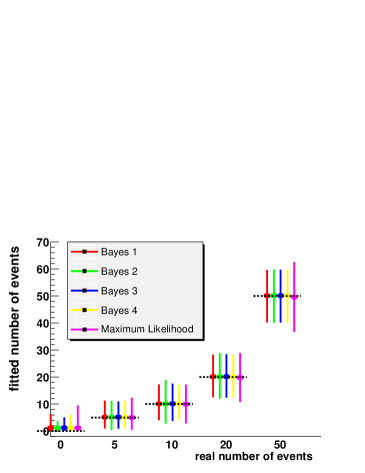
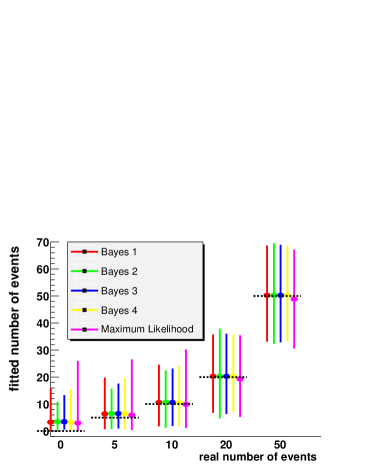
Fig. 8,
right shows the result of the analysis of spectra of
different line intensity with the Bayes method (here Bayes
1-4 correspond to different choice of the prior distribution:
(1) (flat), (2) ,
(3) ,
(4) Jeffrey’s prior)
and the Maximum Likelihood Method.
For each prior 1000 spectra have been generated
with equal background and
equal line intensity using random number generators available
at CERN
[27].
The average values of the best values agree (see Fig.
8) very well
with the known intensities also for very low count rates (as in Fig.
7, left).
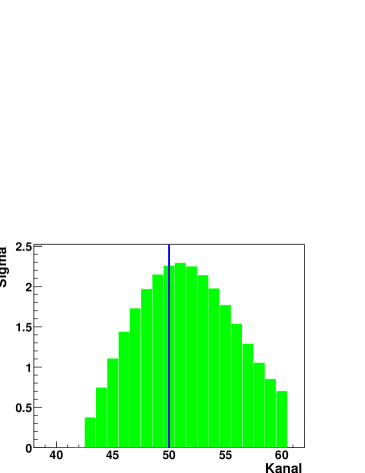
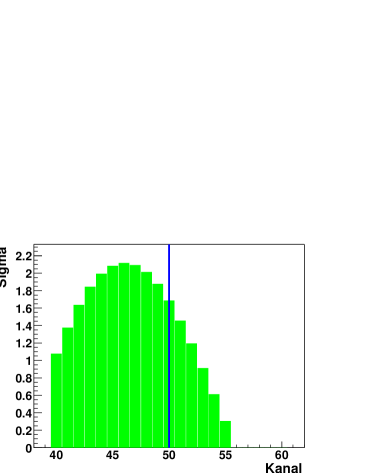
In Fig.
9
we show two simulations of a Gaussian line of 15 events,
centered at channel 50, again with width (standard deviation)
of 4 channels, on a Poisson-distributed background
with 0.5 events/channel. The figure gives an
indication of the possible degree of deviation of the energy of the
peak maximum from the transition energy, on the level of statistics
collected in experiments like the
HEIDELBERG-MOSCOW experiment (here one
channel corresponds to 0.36 keV).
This should be considered when comparing
Figs. 2, 3, 5, 6.
The influence of the choice of the energy range
of the analysis around
has been thoroughly discussed in [2, 3].
Since erroneous ideas about this
point are still around, a few further comments may be given here. In
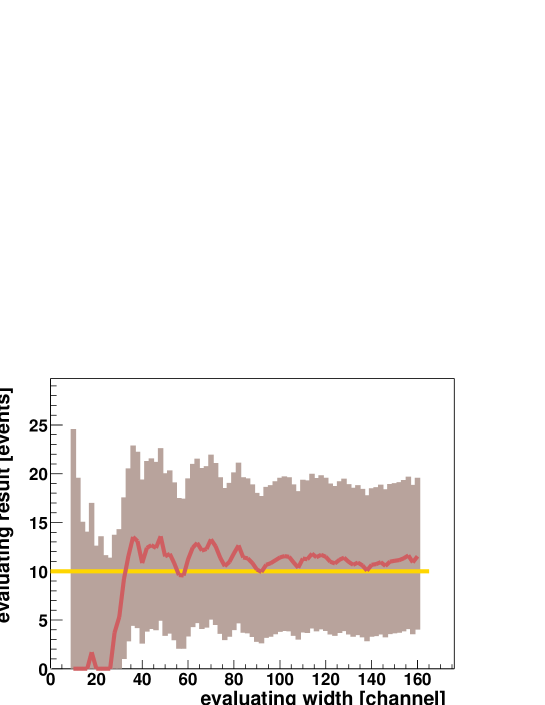
Fig. 10
we show the analysis of a simulated spectrum
consisting of a Gaussian line of width (standard deviation)
of 4 channels
and intensity of 10 counts on a Poisson-distributed background
of 4 events per channel (see fig.
7 left),
as function of the width of the range of analysis.
It is seen that a reliable result is
obtained for a range of analysis of not smaller than 35 channels
(i.e. 18 channels) - one channel corresponding to 0.36 keV in the
HEIDELBERG-MOSCOW experiment.
This is an important result, since it is of course
important to keep the
range of analysis as s m a l l as possible, to avoid to include
lines in the vicinity of the weak signal into the background.
This unavoidably occurs when e.g. proceeding as suggested in Aalseth
et. al., hep-ex/0202018 and Mod. Phys. Lett. A 17 (2002) 1475,
Yu.G. Zdesenko et. al.,
Phys. Lett. B 546 (2002) 206.
The arguments given in those papers are therefore incorrect. Also
Kirpichnikov, who states [28] that his analysis
finds a 2039 keV signal in
the HEIDELBERG-MOSCOW spectrum on a 4 sigma confidence level
(as we also see it, when using the Feldman-Cousins method
[26]),
makes this mistake when analyzing the pulse-shape spectrum.
4 Simulation of the Background with
GEANT 4
Finally the background around will
be discussed from the side of simulation.
A very careful new simulation of the different components of
radioactive background in the HEIDELBERG-MOSCOW experiment has been
performed recently by a new Monte Carlo program based on GEANT4
[29, 30].
This simulation uses a new event generator for simulation
of radioactive decays basing on ENSDF-data and describes
the decay of arbitrary radioactive isotopes including alpha,
beta and gamma emission as well as
conversion electrons and X-ray emission.
Also included in the simulation is
the influence of neutrons in the energy range from thermal to high
energies up to 100 MeV on the measured spectrum. Elastic and inelastic
reactions, and capture have been taken into account,
and the corresponding
production of radioactive isotopes in the setup. The neutron fluxes and
energy distributions were taken from published
measurements performed in the Gran Sasso.
Also simulated was the cosmic muon flux measured in the
Gran Sasso, on the measured spectrum.
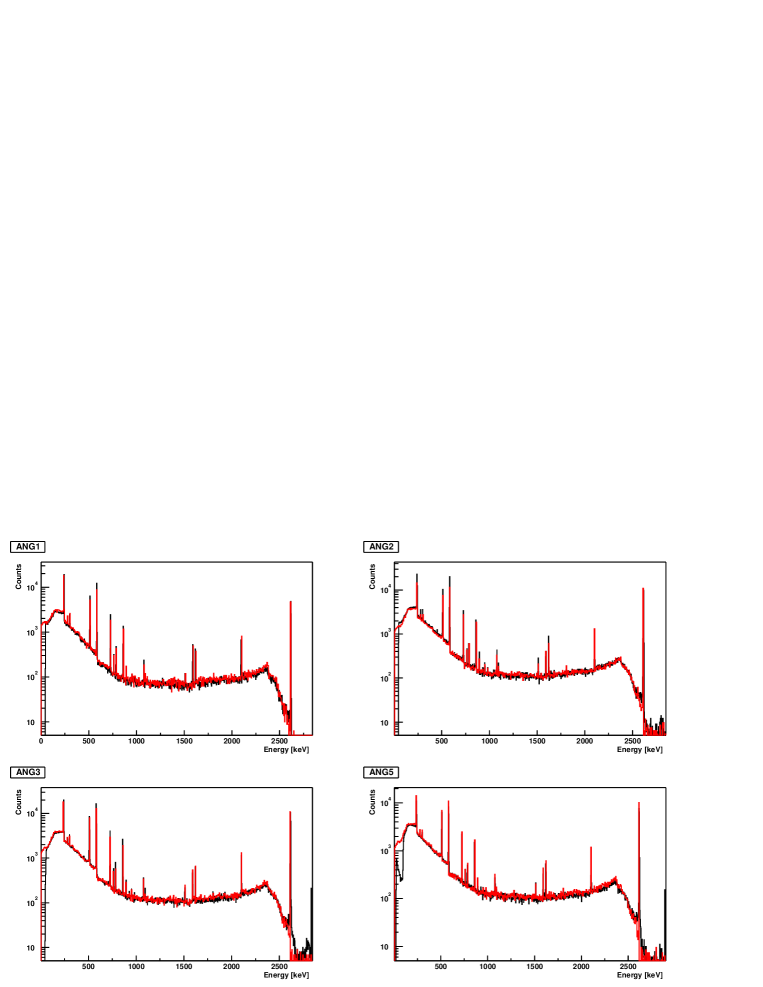
To give a feeling for the quality of the simulation,
Fig. 11
shows the simulated and the measured spectra for a 228Th
source spectrum for 4 of our five detectors.
The agreement is excellent.
The simulation of the background of the experiment reproduces a l l
observed lines in the energy range between threshold (around 100 keV)
and 2020 keV
[29].
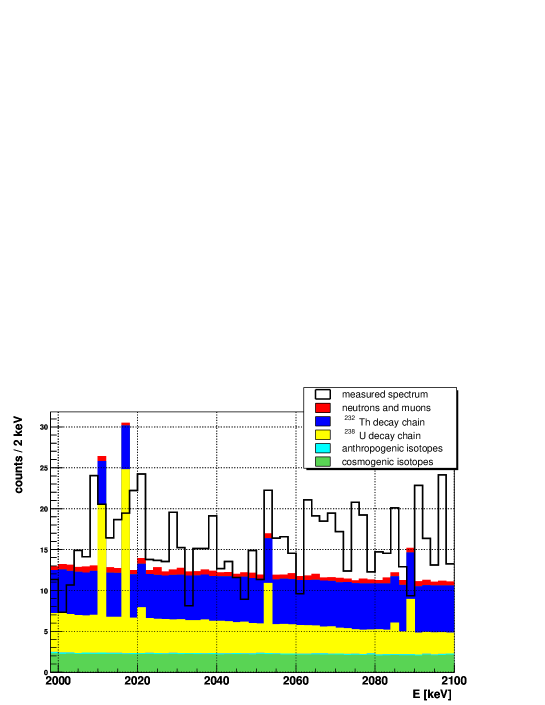
Fig.
12
shows the simulated background in the range
2000-2100 keV with all k n o w n background components.
The black solid line corresponds to the measured data
in the period 20.11.1995 - 16.4.2002 (55.57 kg y).
The background around is according
to the simulations f l a t, the only expected lines
come from 214Bi (from the 238U natural decay chain)
at 2010.89, 2016.7, 2021.6, 2052.94, 2085.1 and 2089.7 keV.
Lines from cosmogenically produced 56Co (at 2034.76 keV
and 2041.16 keV), half-life 77.3 days, are not expected since
the first 200 days of measurement of
each detector are not used in the data analysis.
Also the potential contribution from
decays of 77Ge, 66Ga, or 228Ac,
should not lead to signals visible in our
measured spectrum near the signal at .
For details we refer to
[30].
The structures around 2028 keV, 2066 keV and 2075 keV seen -
as also the 214Bi lines - in practically all Ge
experiments (see above), cannot be identified at present.
The 2028 keV line because of its strong occurence
in the PSA spectrum in the HEIDELBERG-MOSCOW experiment,
may play a special role here (see above).
5 Conclusion
Concluding, additional support has been given for the evidence
of a signal for neutrinoless double beta decay, by
showing consistency of the result - for the signal, a n d for the
background - with other double beta decay experiments using
non-enriched or enriched Germanium detectors. In particular
it has been shown that the lines seen in the vicinity
of the signal (including those which at present cannot
be attributed) are seen also in the other experiments.
This is important for the correct treatment of the background.
Furthermore, the sensitivity of the peak identification
procedures has been demonstrated by extensive statistical simulations.
It has been further shown by new extensive simulations of the expected
background by GEANT4, that the background around
should be flat, and
that no known gamma line is expected at the energy of .
The 2039 keV signal is seen o n l y in
the HEIDELBERG-MOSCOW experiment, which has a factor of 10, and
m u c h more, statistics than all other double beta experiments.
References
- [1] H.V. Klapdor-Kleingrothaus et al. hep-ph/0201231 and Mod. Phys. Lett. A 16 (2001) 2409-2420.
- [2] H.V. Klapdor-Kleingrothaus, A. Dietz and I.V. Krivosheina, Part. and Nucl. 110 (2002) 57-79
-
[3]
H.V. Klapdor-Kleingrothaus, A. Dietz and I.V. Krivosheina,
Foundations of Physics 31 (2002) 1181-1223
and Corrigenda, 2003 home-page:
http://www.mpi-hd.mpg.de/non_acc/main_results.html. - [4] H.V. Klapdor-Kleingrothaus, hep-ph/0303217
- [5] H.V. Klapdor-Kleingrothaus, ”60 Years of Double Beta Decay - From Nuclear Physics to Beyond the Standard Model”, World Scientific, Singapore (2001) 1281 p.
- [6] H.V. Klapdor-Kleingrothaus, H. Päs and A.Yu. Smirnov, Phys. Rev. D 63 (2001) 073005 and hep-ph/0003219
- [7] H.V. Klapdor-Kleingrothaus, U. Sarkar, Mod. Phys. Lett. A 16 (2001) 2460-2482
- [8] H.V. Klapdor-Kleingrothaus, U. Sarkar, hep-ph/0304032
- [9] D.N. Spergel et. al., astro-ph/0302209
- [10] S. Hannestad, astro-ph/0303076
- [11] A. Pierce, H. Murayama, astro-ph/0302131
- [12] Z. Fodor et. al., JHEP (2002) 0206046 or hep-ph/0203198 and hep-ph/0210123; D. Fargion et. al., Proc. DARK 2000, Heidelberg, ed. H.V. Klapdor-Kleingrothaus (Springer, Heidelberg, 2001) 455 and Proc. BEYOND02, Oulu Finland, ed. H.V. Klapdor-Kleingrothaus (IOP Bristol, 2003); H. Päs and H. Weiler, Phys. Rev. D 63 (2001) 113015
- [13] J. Bonn et. al., Nucl. Phys. B (Proc. Suppl.) 91 (2001) 273
- [14] K.S. Babu, E. Ma, J.W.F. Valle, hep-ph/0206292
- [15] R. Mohapatra, M. K. Parida, G. Rajasekaran, hep-ph/0301234
- [16] G. Douysset et. al., Phys. Rev. Lett. 86 (2001) 4259 - 4262.
- [17] R.B. Firestone and V.S. Shirley, Table of Isotopes, 8-th Edition, John Wiley and Sons, Incorp., N.Y. (1998).
- [18] H.V. Klapdor-Kleingrothaus, O. Chkvorets, I.V. Krivosheina, C. Tomei, to be published
- [19] H.V. Klapdor-Kleingrothaus, hep-ph/0205228
- [20] G. Gilmore, J. Hemingway, “Practical Gamma-Ray Spectrometry”, Wiley and Sons (1995)
- [21] D. Caldwell et. al., J. Phys. G 17 (1991) S137-S144
- [22] A.A. Vasenko et. al., Mod. Phys. Lett. A 5 (1990) 1299, and I. Kirpichnikov, Preprint ITEP (1991)
- [23] C.E. Aalseth et. al., Yad. Fiz. 63 (2000) 1299
- [24] C.E. Aalseth et. al., Phys. Rev. D 65 (2002) 092007
- [25] H.V. Klapdor-Kleingrothaus, Proc. BEYOND02, Oulu, Finland 2002, ed. H.V. Klapdor-Kleingrothaus (IOP, Bristol) 2003
- [26] A. Dietz, Dissertation, University of Heidelberg, 2003
- [27] CERN number generators (see e.g. http://root.cern.ch/root/html/TRandom.html)
- [28] I. Kirpichnikov, talk at Conf. on Nucl. Phys Russ. Acad. Sci., Moscow, Dec. 2 (2002), and private communication , Dec. 2002
- [29] C. Dörr, diploma thesis, University of Heidelberg, 2002, unpublished
- [30] H.V. Klapdor-Kleingrothaus et. al., to be published