Status of Evidence for neutrinoless double
beta decay, and the Future: GENIUS and GENIUS-TF
Abstract
The first evidence for neutrinoless double beta decay has been
observed in the HEIDELBERG-MOSCOW experiment, which is the most sensitive
double beta decay experiment since ten years.
This is the first evidence for lepton number violation
and proves that the neutrino is a Majorana particle.
It further shows that neutrino masses are degenerate.
In addition it puts several stringent constraints on other physics
beyond the Standard Model.
The result from the HEIDELBERG-MOSCOW experiment is consistent
with recent results from CMB investigations,
with high energy cosmic rays, with the result from the g-2 experiment
and with recent theoretical work.
It is indirectly supported by the analysis of other
Ge double beta experiments.
The new project
GENIUS will cover a wide range of the parameter
space of predictions of SUSY for neutralinos as cold dark matter.
Further it has the potential to be a real-time detector
for low-energy ( and 7Be) solar neutrinos.
A GENIUS Test Facility has come into operation on May 5, 2003.
This is the first time that this novel technique
for extreme background reduction in search for rare decays
is applied under the background conditions
of an underground laboratory.
1 Introduction
In this paper we will describe in section II the recent evidence for neutrinoless double beta decay (), found by the HEIDELBERG-MOSCOW experiment [1, 2, 3, 4, 5], which is since ten years now the most sensitive double beta experiment worldwide.
This result is
| (1) |
with best value of . Double beta decay is the slowest nuclear decay process observed until now in nature. Assuming the neutrino mass mechanism to dominate the decay amplitude, we can deduce
| (2) |
This value we obtain using the nuclear matrix element of [22]. Allowing for an uncertainty of of the matrix elements (see [5, 14]), this range widens to
| (3) |
The result (2) and (3) determines the neutrino mass scenario to be degenerate [10, 15]. The common mass eigenvalue follows then to be
| (4) |
If we allow for other mechanisms (see [12, 13, 14, 11], the value given in eq. (2),(3) has to be considered as an upper limit. In that case very stringent limits arise for many other fields of beyond standard model physics. To give an example, it has been discussed recently [56] that decay by R-parity violating SUSY experimentally may not be excluded, although this would require making R-parity violating couplings generation dependent.
We show, in section III that indirect support for the observed evidence for neutrinoless double beta decay evidence comes from analysis of other Ge double beta experiments (though they are by far less sensitive, they yield independent information on the background in the region of the expected signal).
We discuss in sections IV and V some statistical features, about which still wrong ideas are around, as well as background simulations with the program GEANT4, which disprove some recent criticism.
In section VI we give a short discussion, stressing that the evidence for neutrinoless double beta decay [1, 2, 3, 4, 5] has been supported by various recent experimental results from other fields of research (see Table 1). It is consistent with recent results from cosmic microwave background experiments [63, 64, 66]. The precision of WMAP even allows to rule out some old-fashioned nuclear double beta decay matrix elements (see [65]).
Recent support of the neutrino mass deduced from decay [1, 2, 3, 5] by other experiments, and by theoretical work. Experiment References (degenerate ’s)(eV) [1, 2, 3, 5] 0.05 - 3.2 WMAP [64, 66] 0.23, or 0.33, or 0.50 CMB [63] 0.7 Z- burst [54, 62] 0.08 - 1.3 g-2 [55] 0.2 Tritium [39] 2.2 - 2.8 oscillation [58, 59] 0.03 Theory (A4-symmetry) [60] 0.2 Theory (identical quark and mixing at GUT scale) [61] 0.1
It has been shown to be consistent with the neutrino masses required for the Z-burst scenarios of high-energy cosmic rays [62, 54]. It is consistent with a (g-2) deviating from the standard model expectation [55]. It is consistent also with the limit from the tritium decay experiments [39] but the allowed 95% confidence range extends down to a range which cannot be covered by future tritium experiments. It is further strongly supported by recent theoretical work [60, 61].
Cosmological experiments like WMAP are now on the level that they can seriously contribute to terrestrial research. The fact that WMAP and less strictly also the tritium experiments cut away the upper part of the allowed range for the degenerate neutrino mass eq. (4) could indicate that the neutrino mass eigenvalues have the same CP parity [16].
Finally we briefly comment about the possible future of the field of double beta decay, and present first results from GENIUS-TF which has come into operation on May 5, 2003 in Gran Sasso with first in world 10 kg of naked Germanium detectors in liquid nitrogen [43, 47, 44].
2 Evidence for the neutrinoless decay mode
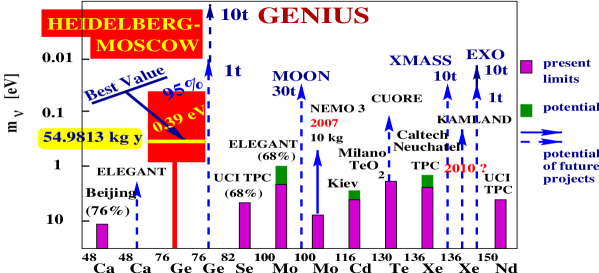
The status of present double beta experiments is shown in Fig. 1 and is extensively discussed in [14]. The HEIDELBERG-MOSCOW experiment using the largest source strength of 11 kg of enriched 76Ge (enrichment 86) in form of five HP Ge-detectors is running since August 1990 in the Gran-Sasso underground laboratory [14, 5, 6, 2, 41, 37].
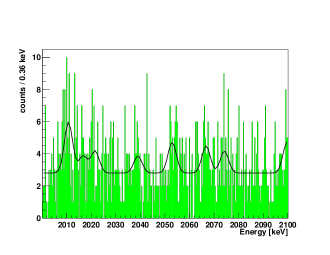
The data taken in the period August 1990 - May 2000 (54.9813 kg y, or 723.44 mol-years) are shown in Fig. 2 in the section around the Qββ value of 2039.006 keV [25]. Fig. 2 is identical with Fig. 1 in [1], except that we show here the original energy binning of the data of 0.36 keV. These data have been analysed [1, 2, 4, 5] with various statistical methods, with the Maximum Likelihood Method and in particular also with the Bayesian method (see, e.g. [5]).
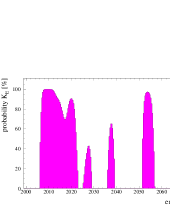
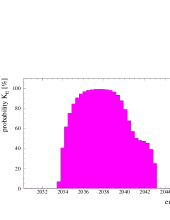
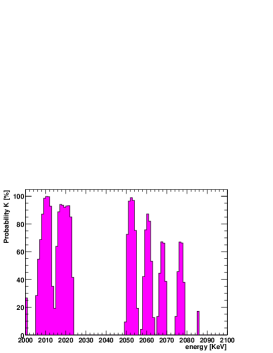
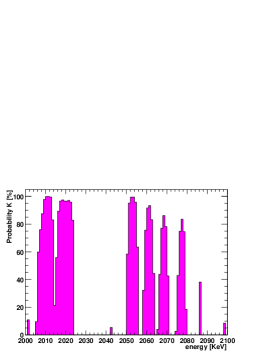
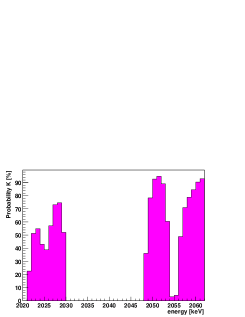
Our peak search procedure (for details see [2, 4, 5]) reproduces (see [1, 2, 4, 5]) -lines at the positions of known weak lines [23] from the decay of at 2010.7, 2016.7, 2021.8 and 2052.9 keV. In addition, a line centered at 2039 keV shows up (see Fig. 3). This is compatible with the Q-value [25] of the double beta decay process. The Bayesian analysis yields, when analysing a range around Qββ (which is the usual procedure when searching for resonances in high-energy physics) a confidence level (i.e. the probability K) for a line to exist at 2039.0 keV of 96.5 c.l. (2.1 ) (see Fig. 3). We repeated the analysis for the same data, but except detector 4, which had no muon shield and a slightly worse energy resolution (46.502 kg y). The probability we find for a line at 2039.0 keV in this case is 97.4 (2.2 ) [1, 2, 5]. Fitting a wide range of the spectrum yields a line at 2039 keV at 91% c.l. (see Fig.2).
We also applied the Feldman-Cousins method [21]. This method (which does not use the information that the line is Gaussian) finds a line at 2039 keV on a confidence level of 3.1 (99.8 c.l.).
In addition to the line at 2039 keV we find candidates for lines at energies beyond 2060 keV and around 2030 keV, which at present cannot be attributed. This is a task of nuclear spectroscopy.
Important further information can be obtained from the time structures of the individual events. Double beta events should behave as single site events i.e. clearly different from a multiple scattered -event. It is possible to differentiate between these different types of events by pulse shape analysis. We have developped three methods of pulse shape analysis [17, 18, 19] during the last seven years, one of which has been patented and therefore only published recently.
Installation of Pulse Shape Analysis (PSA) has been performed in 1995 for the four large detectors. Detector Nr.5 runs since February 1995, detectors 2,3,4 since November 1995 with PSA. The measuring time with PSA from November 1995 until May 2000 is 36.532 kg years, for detectors 2,3,5 it is 28.053 kg y.
In the SSE spectrum obtained under the restriction that the signal simultaneously fulfills the criteria of all three methods for a single site event, we find again indication of a line at 2039.0 keV (see [1, 2, 5]).
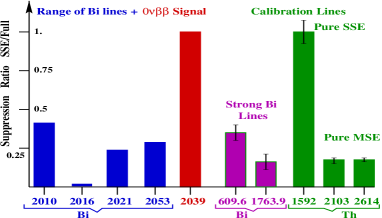
With proper normalization concerning the running times (kg y) of the full and the SSE spectra, we see that almost the full signal remains after the single site cut (best value), while the lines (best values) are considerably reduced. We have used a source to test the PSA method. We find the reduction of the 2103 keV and 2614 keV lines (known to be multiple site or mainly multiple site), relative to the 1592 keV line (known to be single site), shown in Fig. 4. This proves that the PSA method works efficiently. Essentially the same reduction as for the Th lines at 2103 and 2614 keV and for the weak Bi lines is found for the strong lines (e.g. at 609.6 and 1763.9 keV (Fig. 4)). The possibility, that the single site signal is the double escape line corresponding to a (much more intense!) full energy peak of a -line, at 2039+1022=3061 keV is excluded from the high-energy part of our spectrum (see [4]).
3 Support of Evidence From Other Ge-Experiments and From Recent Measurements With a Source
It has been mentioned in Section II, that by the peak search procedure developped [2, 5] on basis of the Bayes and Maximum Likelihood Methods, exploiting as important input parameters the experimental knowledge on the shape and width of lines in the spectrum, weak lines of 214Bi have been identified at the energies of 2010.78, 2016.7, 2021.6 and 2052.94 keV [1, 2, 5, 7]. Fig. 3 shows the probability that there is a line of correct width and of Gaussian shape at a given energy, assuming all the rest of the spectrum as flat background (which is a highly conservative assumption).
The intensities of these lines have been shown to be consistent with other, strong Bi lines in the measured spectrum according to the branching ratios given in the Table of Isotopes [23], and to Monte Carlo simulation of the experimental setup [5]. Note that the 2016 keV line, as an E0 transition, can be seen only by coincident summing of the two successive lines keV and keV. Its observation proves that the 238U impurity from which it is originating, is located in the Cu cap of the detectors. Recent measurements of the spectrum of a 214Bi source as function of distance source-detector confirm this interpretation [26].
Premature estimates of the Bi intensities given in Aalseth et.al, hep-ex/0202018 and Feruglio et al., Nucl. Phys. B 637 (2002), 345, thus are incorrect, because this long-known spectroscopic effect of true coincident summing [24] has not been taken into account, and also no simulation of the setup has been performed (for details see [5, 3]).
These 214Bi lines occur also in other investigations of double beta decay of Ge - and - even more important - also the additional structures in Fig. 2, which cannot be attributed at present, are seen in these other investigations.
There are three other Ge experiments which have looked for double beta decay of 76Ge. First there is the experiment by Caldwell et al. [29], using natural Germanium detectors (7.8% abundance of 76Ge, compared to 86% in the HEIDELBERG-MOSCOW experiment). This was the most sensitive natural Ge experiment. With their background a factor of 9 higher than in the HEIDELBERG-MOSCOW experiment and their measuring time of 22.6 kg years, they had a statistics of the background by a factor of almost four l a r g e r than in the HEIDELBERG-MOSCOW experiment. This gives useful information on the composition of the background.
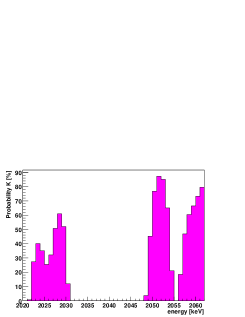
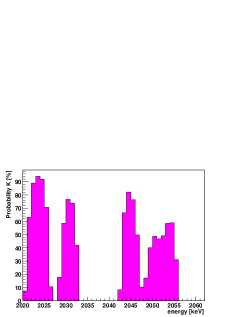
Applying the same method of peak search as used in Fig. 3, yields indications for peaks essentially at the same energies as in Fig. 3 (see Fig. 5). This shows that these peaks are not fluctuations. In particular it sees the 2010.78, 2016.7, 2021.6 and 2052.94 keV 214Bi lines, but a l s o the unattributed lines at higher energies. It finds, however, n o line at 2039 keV. This is consistent with the expectation from the rate found in the HEIDELBERG-MOSCOW experiment. About 16 observed events in the latter correspond to to 0.6 expected events in the Caldwell experiment, because of the use of non-enriched material and the shorter measuring time. Fit of the Caldwell spectrum allowing for the 214Bi lines and a 2039 keV line yields 0.4 events for the latter (see [5]).
The first experiment using enriched (but not high-purity) Germanium 76 detectors was that of Kirpichnikov and coworkers [30]. These authors show only the energy range between 2020 and 2064 keV of their measured spectrum. The peak search procedure finds also here indications of lines around 2028 keV and 2052 keV (see Fig. 6), but n o t any indication of a line at 2039 keV. This is consistent with the expectation, because for their low statistics of 2.95 kg y they would expect here (according to HEIDELBERG-MOSCOW) 0.9 counts.
Another experiment (IGEX) used between 6 and 8.8 kg of enriched 76Ge, but collected since beginning of the experiment in the early nineties till shutdown in 1999 only 8.8 kg years of statistics [49]. The authors of [49] unfortunately show only the range 2020 to 2060 keV of their measured spectrum in detail. Fig. 6 shows the result of our peak scanning of this range. Clear indications are seen for the Bi lines
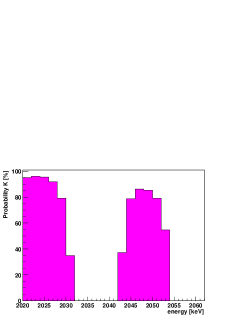
at 2021 and 2052 keV, but also of the unidentified structure around 2030 keV. Because of the conservative assumption on the background treatment in the scanning procedure (see above) there is no chance to see a signal at 2039 keV because of the ’hole’ in the background of that spectrum (see Fig. 1 in [49]). With some good will one might see, however, an indication of 3 events here, consistent with the expectation of the HEIDELBERG-MOSCOW experiment of 2.6 counts.
4 Statistical Features: Sensitivity of Peak Search, Analysis Window
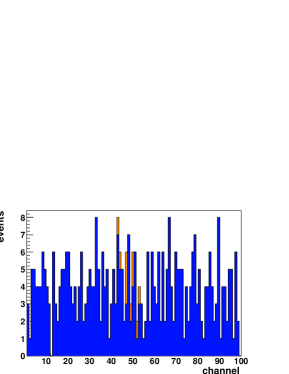
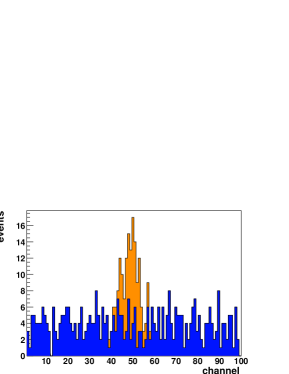
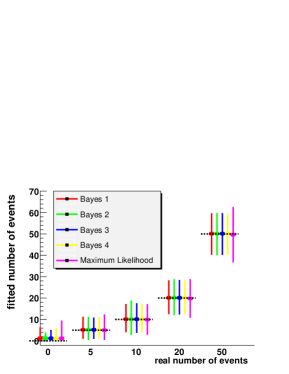
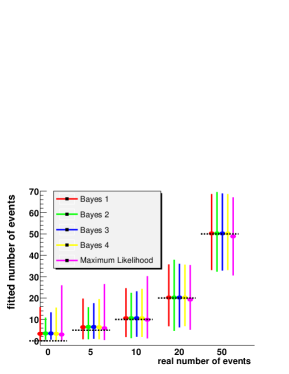
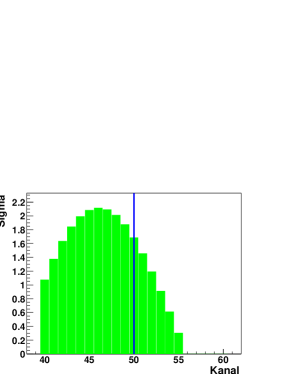
At this point it may be useful to demonstrate the potential of the used peak search procedure. Fig. 7 shows a spectrum with Poisson-generated background of 4 events per channel and a Gaussian line with width (standard deviation) of 4 channels centered at channel 50, with intensity of 10 (left) and 100 (right) events, respectively. Fig. 8, shows the result of the analysis of spectra of different line intensity with the Bayes method (here Bayes 1-4 correspond to different choice of the prior distribution: (1) (flat), (2) , (3) , (4) Jeffrey’s prior) and the Maximum Likelihood Method. For each prior 1000 spectra have been generated with equal background and equal line intensity using random number generators available at CERN [20]. The average values of the best values agree (see Fig. 8) very well with the known intensities also for very low count rates (as in Fig. 7, left).
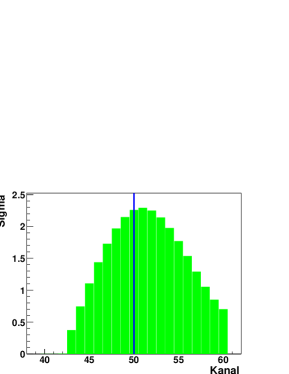
In Fig. 9 we show two simulations of a Gaussian line of 15 events, centered at channel 50, again with width (standard deviation) of 4 channels, on a Poisson-distributed background with 0.5 events/channel. The figure gives an indication of the possible degree of deviation of the energy of the peak maximum from the transition energy, on the level of statistics collected in experiments like the HEIDELBERG-MOSCOW experiment (here one channel corresponds to 0.36 keV). This should be considered when comparing Figs. 3, 5,6.
The influence of the choice of the energy range of the analysis around has been thoroughly discussed in [2, 5]. Since erroneous ideas about this point are still around, let us remind of the analysis given in [2, 5, 8] which showed that a reliable result is obtained for a range of analysis of not smaller than 35 channels (i.e. 18 channels) - one channel corresponding to 0.36 keV in the HEIDELBERG-MOSCOW experiment. This is an important result, since it is of course important to keep the range of analysis as s m a l l as possible, to avoid to include lines in the vicinity of the weak signal into the background. This unavoidably occurs when e.g. proceeding as suggested in F. Feruglio et al., hep-ph/0201291 and Nucl. Phys. B 637 (2002) 345-377, Aalseth et. al., hep-ex/0202018 and Mod. Phys. Lett. A 17 (2002) 1475, Yu.G. Zdesenko et. al., Phys. Lett. B 546 (2002) 206. The arguments given in those papers are therefore incorrect. Also Kirpichnikov, who states [30] that his analysis finds a 2039 keV signal in the HEIDELBERG-MOSCOW spectrum on a 4 sigma confidence level (as we also see it, when using the Feldman-Cousins method [28]), makes this mistake when analyzing the pulse-shape spectrum.
5 Simulation with GEANT4
Finally the background around will be discussed from the side of simulation. A very careful new simulation of the different components of radioactive background in the HEIDELBERG-MOSCOW experiment has been performed recently by a new Monte Carlo program based on GEANT4 [27, 8]. This simulation uses a new event generator for simulation of radioactive decays basing on ENSDF-data and describes the decay of arbitrary radioactive isotopes including alpha, beta and gamma emission as well as conversion electrons and X-ray emission. Also included in the simulation is the influence of neutrons in the energy range from thermal to high energies up to 100 MeV on the measured spectrum. Elastic and inelastic reactions, and capture have been taken into account, and the corresponding production of radioactive isotopes in the setup. The neutron fluxes and energy distributions were taken from published measurements performed in the Gran Sasso.
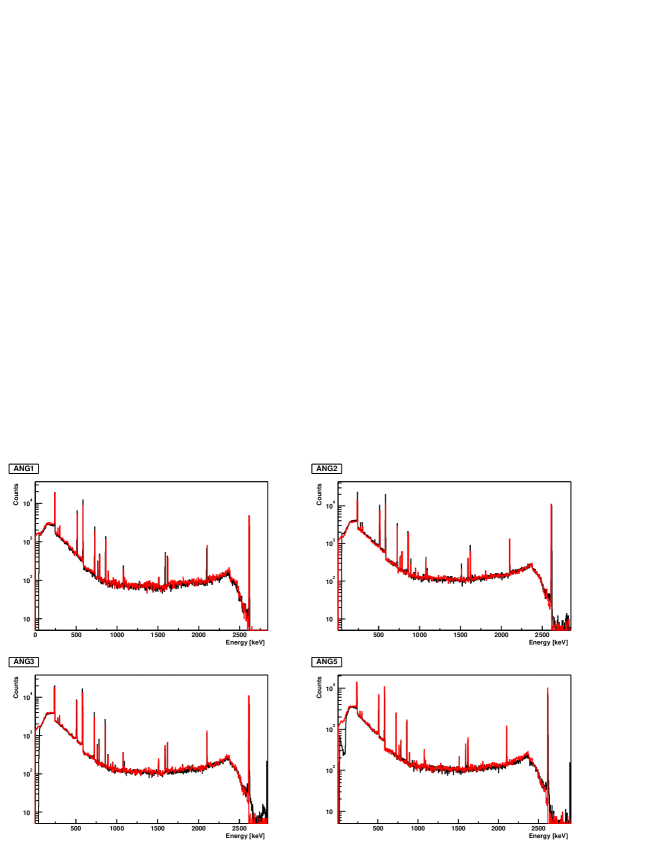
Also simulated was the cosmic muon flux measured in the Gran Sasso, on the measured spectrum. To give a feeling for the quality of the simulation, Fig. 10 shows the simulated and the measured spectra for a 228Th source spectrum for as example one of our five detectors. The agreement is excellent.
The simulation of the background of the experiment reproduces a l l observed lines in the energy range between threshold (around 100 keV) and 2020 keV [27, 8].
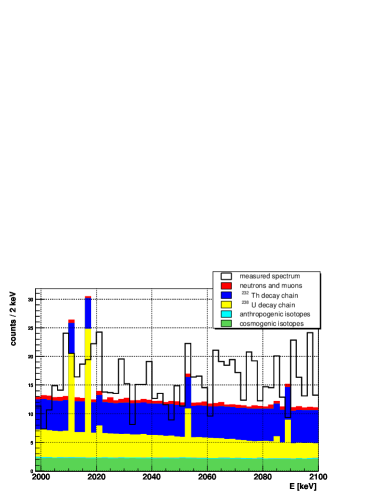
Fig. 11 shows the simulated background in the range 2000-2100 keV with all k n o w n background components. The black histogram corresponds to the measured data in the period 20.11.1995 - 16.4.2002 (49.59 kg y).
The background around is according to the simulations f l a t, the only expected lines come from 214Bi (from the 238U natural decay chain) at 2010.89, 2016.7, 2021.6, 2052.94, 2085.1 and 2089.7 keV. Lines from cosmogenically produced 56Co (at 2034.76 keV and 2041.16 keV), half-life 77.3 days, are not expected since the first 200 days of measurement of each detector are not used in the data analysis. Also the potential contribution from decays of 77Ge, 66Ga, or 228Ac, should not lead to signals visible in our measured spectrum near the signal at . For details we refer to [8].
6 Proofs and disproofs
The result described in section 2.1 has been questioned in some papers (Aalseth et al, hep-ex/0202018, and in Mod. Phys. Lett. A 17 92002) 1475-1478; Feruglio et al., Nucl. Phys. B 637 (2002) 345; Zdesenko et al., Phys. Lett. B 546 (2002) 206). We think that we have shown in a convincing way that these claims against our results are incorrect in various ways. In particular the estimates of the intensities of the lines in the first two papers do not take into account the effect of true coincidence summing, which can lead to drastic underestimation of the intensities. A correct estimate would also require a Monte Carlo simulation of our setup, which has not been performed in the above papers. All of these papers, when discussing the choice of the width of the search window, seem to ignore the results of the statistical simulations we published in [2, 3, 4, 5]. For details we refer to [2, 3, 4, 5, 7].
7 Discussion of results
7.1 Half-life and effective neutrino mass
We emphasize that we find in all analyses of our spectra a line at the value of Qββ. We have shown that the signal at Qββ does not originate from a background -line. On this basis we translate the observed number of events into half-lives for the neutrinoless double beta decay. We give in Table 7.1 conservatively the values obtained with the Bayesian method and not those obtained with the Feldman-Cousins method. Also given in Table 7.1 are the effective neutrino masses deduced using the matrix elements of [22].
Half-life for the neutrinoless decay mode and deduced effective neutrino mass from the HEIDELBERG-MOSCOW experiment. Detectors eV C.L. 54.9813 1,2,3,4,5 (0.08 - 0.54) (0.26 - 0.47) 0.38 Best Value 46.502 1,2,3,5 (0.11 - 0.56) (0.28 - 0.49) 0.39 Best Value 28.053 2,3,5 SSE (0.10 - 0.51) (0.25 - 0.47) 0.38 Best Value
We derive from the data taken with 46.502 kg y the half-life (95 c.l.). The analysis of the other data sets, shown in Table 7.1 confirm this result. Of particular importance is that we see the signal in the single site spectrum.
The result obtained is consistent with all other double beta experiments - which still reach in general by far less sensitivity. The most sensitive experiments following the HEIDELBERG-MOSCOW experiment are the geochemical experiment with (68% c.l.), [31] the experiment by the DAMA group with (90% c.l.),a second enriched experiment with y [30] and a experiment with y [29]. Other experiments are already about a factor of 100 less sensitive concerning the half-life: the Gotthard TPC experiment with yields [32] (90% c.l.) and the Milano Mibeta cryodetector experiment (90% c.l.).
Another experiment [49] with enriched , which has stopped operation in 1999 after reaching a significance of 8.8 kg y, yields (if one believes their method of ’visual inspection’ in their data analysis), in a conservative analysis, a limit of about (90% c.l.). The geochemical experiment yields eV (68 c.l.) [31], the DAMA experiment eV and the cryogenic experiment yields eV.
Concluding we obtain, with 95 probability, first evidence for the neutrinoless double beta decay mode. As a consequence, at this confidence level, lepton number is not conserved. Further the neutrino is a Majorana particle. If the 0 amplitude is dominated by exchange of a massive neutrino the effective mass is deduced (using the matrix elements of [22]) to be = (0.11 - 0.56) eV (95 c.l.), with best value of 0.39 eV. Allowing conservatively for an uncertainty of the nuclear matrix elements of 50 (for detailed discussions of the status of nuclear matrix elements we refer to [14, 5] and references therein) this range may widen to = (0.05 - 0.84) eV (95 c.l.).
Assuming other mechanisms to dominate the decay amplitude, the result allows to set stringent limits on parameters of SUSY models, leptoquarks, compositeness, masses of heavy neutrinos, the right-handed W boson and possible violation of Lorentz invariance and equivalence principle in the neutrino sector. For a discussion and for references we refer to [14, 33, 36, 13, 50, 11].
With the limit deduced for the effective neutrino mass, the HEIDELBERG-MOSCOW experiment excludes several of the neutrino mass scenarios allowed from present neutrino oscillation experiments (see Fig. 12) - allowing only for degenerate, and marginally still for inverse hierarchy mass scenarios [10, 15].
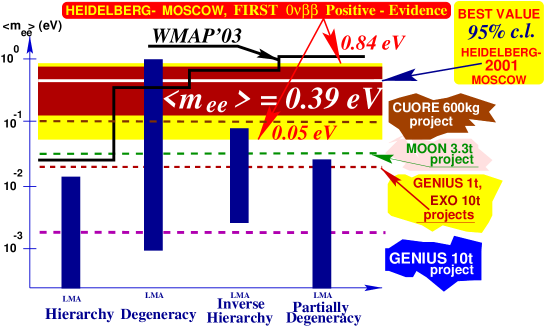
The evidence for neutrinoless double beta decay has been supported by various recent experimental and theoretical results (see Table 1). Assuming the degenerate scenarios to be realized in nature we fix - according to the formulae derived in [9] - the common mass eigenvalue of the degenerate neutrinos to m = (0.05 - 3.4) eV. Part of the upper range is already excluded by tritium experiments, which give a limit of m 2.2-2.8 eV (95 c.l.) [39]. The full range can only partly (down to 0.5 eV) be checked by future tritium decay experiments, but could be checked by some future experiments (see next section). The deduced best value for the mass is consistent with expectations from experimental branching limits in models assuming the generating mechanism for the neutrino mass to be also responsible for the recent indication for as anomalous magnetic moment of the muon [55]. It lies in a range of interest also for Z-burst models recently discussed as explanation for super-high energy cosmic ray events beyond the GKZ-cutoff [54, 62] and requiring neutrino masses in the range (0.08 - 1.3) eV. A recent model with underlying A4 symmetry for the neutrino mixing matrix also leads to degenerate neutrino masses 0.2 eV, consistent with the present result from decay [57, 60]. The result is further consistent with the theoretical paper of [61]. Starting with the hypothesis that quark and lepton mixing are identical at or near the GUT scale, Mohapatra et al. [61] show that the large solar and atmospheric neutrino mixing angles can be understood purely as result of renormalization group evolution, if neutrino masses are quasi-degenerate (with same CP parity). The common Majorana neutrino mass then must be, in this model, larger than 0.1 eV.
For WMAP a limit on the total neutrino masses of
| (5) |
is given by the analysis of ref. [64]. It has been shown, however, that this limit may not be very realistic. Another analysis shows that this limit on the total mass should be [66]
| (6) |
The latter analysis also shows, that four generations of neutrinos are still allowed and in the case of four generations the limit on the total mass is increased to eV. If there is a fourth neutrino with very small mass, then the limit on the total mass of the three neutrinos is even further weakened and there is essentially no constraint on the neutrino masses. In our Fig. 12 we show the contour line for WMAP assuming .
Comparison of the WMAP results with the effective mass from double beta decay rules out completely (see [65]) a 15 years old old-fashioned nuclear matrix element of double beta decay, used in a recent analysis of WMAP [67]. In that calculation of the nuclear matrix element there was not included a realistic nucleon-nucleon interaction, which has been included by all other calculations of the nuclear matrix elements over the last 15 years.
As mentioned in section 1 the results from double beta decay and WMAP together may indicate [16] that the neutrino mass eigenvalues have indeed the same CP parity, as required by the model of [61].
The range of fixed in this work is, already now, in the range to be explored by the satellite experiments MAP and PLANCK [9, 64, 66]. The limitations of the information from WMAP are seen in Fig. 12, thus results of PLANCK are eagerly awaited.
The neutrino mass deduced leads to 0.002 0.1 and thus may allow neutrinos to still play an important role as hot dark matter in the Universe [42].
8 Future of experiments - GENIUS and other proposals
With the HEIDELBERG-MOSCOW experiment, the era of the small smart experiments is over. New approaches and considerably enlarged experiments (as discussed, e.g. in [12, 33, 14, 36, 51, 35, 38, 42]) will be required in future to fix the neutrino mass with higher accuracy.
Since it was realized in the HEIDELBERG-MOSCOW experiment, that the remaining small background is coming from the material close to the detector (holder, copper cap, …), elimination of any material close to the detector will be decisive. Experiments which do not take this into account, like, e.g. CUORE and MAJORANA will allow at best only rather limited steps in sensitivity. Furthermore there is the problem in cryodetectors that they cannot differentiate between a and a signal, as this is possible in Ge experiments.
Another crucial point is the energy resolution, which can be optimized only in experiments using Germanium detectors or bolometers. It will be difficult to probe evidence for this rare decay mode in experiments, which have to work - as result of their limited resolution - with energy windows around Qββ of several hundreds of keV, such as NEMO III, EXO, CAMEO.
Another important point is the efficiency of a detector for detection of a signal. For example, with 14 efficiency a potential future 100 kg NEMO experiment would be, because of its low efficiency, equivalent only to a 10 kg experiment (not talking about the energy resolution).
In the first proposal for a third generation double beta experiment, the GENIUS proposal [33, 12, 34, 36, 51, 35], the idea is to use ’naked’ Germanium detectors in a huge tank of liquid nitrogen. It seems to be at present the only proposal, which can fulfill both requirements mentioned above - to increase the detector mass and simultaneously reduce the background drastically. GENIUS would - with only 100 kg of enriched - increase the confidence level of the present pulse shape discriminated 0 signal to 4 within one year, and to 7 within three years of measurement (a confirmation on a 4 level by the MAJORANA project would need according to our estimate at least 230 years, the CUORE project might need - ignoring for the moment the problem of identification of the signal as a signal - 3700 years). With ten tons of enriched GENIUS should be capable to investigate also whether the neutrino mass mechanism or another mechanism (see, e.g. [14]) is dominating the decay amplitude.
9 GENIUS-TF
As a first step of GENIUS, a small test facility, GENIUS-TF, is under installation in the Gran Sasso Underground Laboratory [47, 45] since March 2001. With up to 40 kg of natural Ge detectors operated in liquid nitrogen, GENIUS-TF could test the DAMA seasonal modulation signature for dark matter [44]. No other experiment running like, CDMS, IGEX, etc., or projected at present, will have this potential [42]. Up to summer 2001, already six 2.5 kg Germanium detectors with an extreme low-level threshold of 500 eV have been produced.
The idea of GENIUS-TF is to prove the feasibility of some key constructional features of GENIUS, such as detector holder systems, achievement of very low thresholds of specially designed Ge detectors, long term stability of the new detector concept, reduction of possible noise from bubbling nitrogen, etc.
After installation of the GENIUS-TF setup between halls A and B in Gran Sasso, opposite to the buildings of the HEIDELBERG-MOSCOW double beta decay experiment and of the DAMA experiment, the first four detectors have been installed in liquid nitrogen on May 5, 2003 and have started operation [43, 26] (Fig.13).
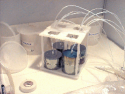
This is the first time ever, that this novel technique for extreme background reduction in search for rare decays is tested under realistic background conditions in an underground laboratory.
10 Conclusion
The status of present double beta decay search has been discussed, and recent evidence for a non-vanishing Majorana neutrino mass obtained by the HEIDELBERG-MOSCOW experiment has been presented. Additional support for this evidence has been presented by showing consistency of the result - for the signal, a n d for the background - with other double beta decay experiments using non-enriched or enriched Germanium detectors. In particular it has been shown that the lines seen in the vicinity of the signal (including those which at present cannot be attributed) are seen also in the other experiments. This is important for the correct treatment of the background. Furthermore, the sensitivity of the peak identification procedures has been demonstrated by extensive statistical simulations. It has been further shown by new extensive simulations of the expected background by GEANT4, that the background around should be flat, and that no known gamma line is expected at the energy of . The 2039 keV signal is seen o n l y in the HEIDELBERG-MOSCOW experiment, which has a by far larger statistics than all other double beta experiments.
The importance of this first evidence for violation of lepton number and of the Majorana nature of neutrinos is obvious. It requires beyond Standard Model Physics on one side, and may open a new era in space-time structure [53]. It has been discussed that the Majorana nature of the neutrino tells us that spacetime does realize a construct that is central to construction of supersymmetric theories.
With the successful start of operation of GENIUS-TF with the first four naked Ge detectors in liquid nitrogen on May 5, 2003 in GRAN SASSO, which is described in [44, 43] a historical step has been achieved of a novel technique and into a new domain of background reduction in underground physics in the search for rare events.
Future projects to improve the present accuracy of the effective neutrino mass have been briefly discussed. The most sensitive of them and perhaps at the same time most realistic one, is the GENIUS project. GENIUS is the only of the new projects which simultaneously has a huge potential for cold dark matter search, and for real-time detection of low-energy neutrinos (see [12, 33, 38, 40, 13, 14, 48, 52, 50]).
References
- [1] H.V. Klapdor-Kleingrothaus et al. Mod. Phys. Lett. A 16 (2001) 2409 - 2420.
- [2] H.V.Klapdor-Kleingrothaus,A.Dietz,I.V.Krivosheina, Part. and Nucl. 110 (2002) 57.
- [3] H.V. Klapdor-Kleingrothaus, hep-ph/0205228, in Proc. of DARK2002, eds. by H.V. Klapdor-Kleingrothaus and R.D. Viollier, Springer (2002) 404.
- [4] H.V. Klapdor-Kleingrothaus, hep-ph/0302248, Proc.DARK2002, Springer(2002)367.
- [5] H.V. Klapdor-Kleingrothaus, A. Dietz and I.V. Krivosheina, Foundations of Physics 31 (2002) 1181and Corr., 2003: http://www.mpi-hd.mpg.de/non_acc/main_results.html.
- [6] H.V. Klapdor-Kleingrothaus et al., (HEIDELBERG-MOSCOW Col.), Eur.Phys.J. A 12(2001)147, Proc. DARK2000, ed. H.V. Klapdor-Kleingrothaus, Springer(2001)520.
- [7] H.V. Klapdor-Kleingrothaus, hep-ph/0303217 and in Proc. of “Neutrinos and Implications for Phys. Beyond the SM”, Stony Brook, 11-13 Oct. 2002.
- [8] H.V. Klapdor-Kleingrothaus et al., to be publ. in 2003.
- [9] H.V.Klapdor-Kleingrothaus,H.Päs,A.Yu.Smirnov, Phys.Rev. D63(2001)073005.
- [10] H.V. Klapdor-Kleingrothaus and U. Sarkar, Mod.Phys.Lett. A 16 (2001)2469.
- [11] H V Klapdor-Kleingrothaus and U Sarkar, hep-ph/0302237.
- [12] H.V. Klapdor-Kleingrothaus, Int. J. Mod. Phys. A 13 (1998) 3953.
- [13] H.V. Klapdor-Kleingrothaus, Springer Tracts in Modern Physics, 163 (2000) 69 - 104, Springer-Verlag, Heidelberg, Germany (2000).
- [14] H.V. Klapdor-Kleingrothaus, ”60 Years of Double Beta Decay - From Nuclear Physics to Beyond the Standard Model”, World Scientific, Singapore (2001) 1281 p.
- [15] H.V. Klapdor-Kleingrothaus and U. Sarkar, hep-ph/0304032.
- [16] H.V. Klapdor-Kleingrothaus, to be publ. 2003, and Proc. BEYOND02, IOP, Bristol 2003.
- [17] J. Hellmig and H.V. Klapdor-Kleingrothaus, NIM A 455 (2000) 638-644.
- [18] J. Hellmig, F. Petry and H.V. Klapdor-Kleingrothaus, Patent DE19721323A.
- [19] B. Majorovits and H.V. Klapdor-Kleingrothaus. Eur. Phys. J. A 6 (1999) 463.
- [20] CERN number generators (see e.g. http://root.cern.ch/root/html/TRandom.html)
- [21] D.E Groom et al., Particle Data Group, Eur. Phys. J. C 15 (2000) 1.
- [22] A. Staudt, K. Muto and H.V. Klapdor-Kleingrothaus, Eur. Lett. 13 (1990) 31.
- [23] R.B. Firestone and V.S. Shirley, Table of Isotopes, 8th Ed., John W.%S, N.Y.(1998).
- [24] G. Gilmore et al.“Practical Gamma-Ray Spectr.”, Wiley and Sons (1995).
- [25] G. Douysset et al., Phys. Rev. Lett. 86 (2001) 4259 - 4262.
- [26] H.V.Klapdor-Kleingrothaus, O.Chkvorets,I.V.Krivosheina,C.Tomei, in press NIM’03.
- [27] Ch. Dörr, Diplomarbeit (2002), Univ. of Heidelberg, unpubl.
- [28] A. Dietz, Dissertation, University of Heidelberg, 2003.
- [29] D. Caldwell, J. Phys. G 17, S137-S144 (1991).
- [30] I.V. Kirpichnikov et al. Mod. Phys. Lett. A 5 (1990) 1299 - 1306. Preprint ITEP, 1991, Moscow 91-91.
- [31] O. Manuel et al., in Proc. Intern. Conf. Nuclear Beta Decays and the Neutrino, eds. T. Kotani et al., World Scientific (1986) 71, J. Phys. G: Nucl. Part. Phys. 17 (1991) S221-S229; T. Bernatovicz et al. Phys. Rev. Lett. 69 (1992) 2341.
- [32] R. Lüscher et al., Phys. Lett. (1998) 407.
- [33] H.V. Klapdor-Kleingrothaus in Proc. of BEYOND’97, IOP Bristol (1998) 485-531.
- [34] H.V. Klapdor-Kleingrothaus, J. Hellmig and M. Hirsch, J. Phys. G 24 (1998) 483 - 516.
- [35] H.V. Klapdor-Kleingrothaus et al. MPI-Report MPI-H-V26-1999, hep-ph/9910205, in Proc. of BEYOND’99, eds. H.V. Klapdor-Kleingrothaus and I.V. Krivosheina, IOP Bristol (2000) 915.
- [36] H.V. Klapdor-Kleingrothaus, in Proc. of NEUTRINO 98, Takayama, Japan, 4-9 Jun 1998, (eds) Y. Suzuki et al. Nucl. Phys. Proc. Suppl. 77 (1999) 357.
- [37] HEIDELBERG-MOSCOW Coll. (M. Günther et al.), Phys.Rev.D55(1997)54.
- [38] H.V. Klapdor-Kleingrothaus, Nucl. Phys. B 100 (2001) 309 - 313.
- [39] J. Bonn et al., Nucl. Phys. B 91 (2001) 273 - 279.
- [40] V.A. Bednyakov and H.V. Klapdor-Kleingrothaus, Phys. Rev. D 63 (2001) 095005.
- [41] H.V. Klapdor-Kleingrothaus, in Proc. eds.: D. Poenaru and S. Stoica, World Scientific, Singapore (2000) 123-129.
- [42] H.V. Klapdor-Kleingrothaus, Int.J.Mod.Phys.A17(2002)3421,Proc. LP01, WS 2002.
- [43] H.V. Klapdor-Kleingrothaus and I.V. Krivosheina, in Proc. of BEYOND02, Oulu, Finland, June 2002, IOP 2003, ed. H.V. Klapdor-Kleingrothaus.
- [44] H. V. Klapdor-Kleingrothaus, et al., NIM 2003, in press.
- [45] T. Kihm, V. F. Bobrakov and H.V. Klapdor-Kleingrothaus NIM A498 (2003) 334.
- [46] H.V. Klapdor-Kleingrothaus et al., Internal Report MPI-H-V32-2000.
- [47] H.V. Klapdor-Kleingrothaus et al., hep-ph/0103082, NIM A 481 (2002) 149.
- [48] H.V. Klapdor-Kleingrothaus and I.V. Krivosheina, in Proc. of “Forum of Physics”, Zacatecas, Mexico, 11-13 May, 2002, eds. D.V. Ahluwalia and M. Kirchbach.
- [49] C.E. Aalseth et al. (IGEX Collaboration), Yad. Fiz. 63, No 7 (2000) 1299 - 1302; Phys. Rev. D 65 (2002) 092007.
- [50] H.V. Klapdor-Kleingrothaus, Part. and Nucl., Lett. iss. 1/2(2001), hep-ph/0102319.
- [51] H.V. Klapdor-Kleingrothaus, hep-ph/0103074 and in NOON 2000, W.S.(2001) 219.
- [52] H.V. Klapdor-Kleingrothaus, LowNu2, WS(2001)116,hep-ph/0104028.
- [53] D.V. Ahluwalia in Proc. of BEYOND02, IOP 2003, ed. H.V. Klapdor-Kleingrothaus; D.V. Ahluwalia, M. Kirchbach, Phys. Lett. B 529 (2002) 124.
- [54] D. Fargion et al., in Proc. of DARK2000, Springer, (2001) 455,in Proc. of BEYOND02, IOP 2003, ed. H.V. Klapdor-Kleingrothaus.
- [55] E. Ma and M. Raidal, Phys.Rev.Lett.87(2001)011802; Erratum-ibid.87(2001)159901.
- [56] Y. Uehara, Phys. Lett. B 537 (2002) 256-260 and hep-ph/0201277.
- [57] E. Ma in Proc. of BEYOND’02, Oulu, Finland, 2-7 Jun. 2002, IOP, Bristol, 2003, ed. H.V. Klapdor-Kleingrothaus.
- [58] KamLAND Coll., Phys. Rev. Lett. 90 (2003) 021802 and hep-ex/0212021.
- [59] G. L. Fogli et al., Phys. Rev. D 67 (2003) 073002 and hep-ph/0212127.
- [60] K. S. Babu, E. Ma and J.W.F. Valle (2002) hep-ph/0206292.
- [61] R. N. Mohapatra, M. K. Parida and G. Rajasekaran, (2003) hep-ph/0301234.
- [62] Z. Fodor, S. D. Katz and A. Ringwald, Phys. Rev. Lett. 88 (2002) 171101; Z. Fodor et al., JHEP (2002) 0206:046, or hep-ph/0203198, and in Proc. of BEYOND’02, IOP, Bristol, 2003, ed. H V Klapdor-Kleingrothaus and hep-ph/0210123.
- [63] J. E. Ruhl et al., astro-ph/0212229.
- [64] D. N. Spergel et al., astro-ph/0302209.
- [65] A. Pierce and H. Murayama, hep-ph/0302131.
- [66] S. Hannestad, astro-ph/0303076.
- [67] P. Vogel in PDG (ed. K Hagiwara et al.) Phys. Rev. (2002) D 66 010001.