hep-ph/0307223
DO-TH 2003/12
DESY 03-095
Muon Spectra of Quasi-Elastic and 1-Pion Production Events in LBL Neutrino Oscillation Experiments
E. A. Paschos1, D. P. Roy1,2, I. Schienbein3, J.-Y. Yu1
1 Theoretische Physik III, Univ. Dortmund, 44221 Dortmund, Germany
2 Tata Inst. of Fundamental Research, Bombay-400005, India
3 DESY/Univ. Hamburg, Notkestrasse 85,
22603 Hamburg, Germany
The muon energy spectra of the quasi-elastic and 1-pion production events in a LBL experiment, like K2K, are predicted to follow closely the neutrino energy spectrum, with downward shifts of the energy scale by and respectively. These predictions seem to agree with the observed muon spectra in the K2K nearby detector. The corresponding muon spectra in the far-away (SK) detector are predicted to show characteristic spectral distortions induced by oscillation. Comparison of the predicted spectral distortions with the observed muon spectra of the 1-Ring and 2-Ring muon events in the SK detector will help to determine the oscillation parameters. The results will be applicable to other LBL experiments as well.
PACS: 13.15.+g; 25.30.Pt; 95.55.Vj
Keywords: Long-baseline experiment; Neutrino oscillation;
Neutrino cross-section
Recently the KEK to Kamioka long-baseline neutrino oscillation experiment (K2K) has published its result [1], which confirms the existence of oscillation as seen in the Super-Kamiokande (SK) atmospheric neutrino data [2]. It uses an accelerator-produced beam, which has a peak energy of and a spread of about on either side – the full width at half maximum being [1, 3]. The beam passes through a nearby neutrino detector (ND), comprising of a 1 kiloton water Cerenkov (1KT) and a fine-grained detector (FGD) system, and then travels a distance of to enter the SK 50 kiloton water Cerenkov detector. The charged- and neutral-current event rates measured in the ND are used to predict the corresponding event rates at the SK detector in terms of the oscillation parameters. They report 56 fully contained (FC) events against the expectation of 80 without oscillation. The observed deficit agrees well with the neutrino mass and mixing angles deduced from the atmospheric neutrino oscillation data [2]
| (1) |
We estimate that the QE, 1-pion production and multi-pion events constitute and at . In this region the resonance contribution accounts for of the 1-pion events [4], with the remainder produced from the and resonances.
In this note we use kinematic considerations to predict the muon energy spectra of the QE and 1-Pion resonance production events which constitute the bulk of the charged-current scattering events in the K2K experiment. These predictions can be checked with the observed muon energy spectra from the ND. We also present the distortion of these muon spectra due to oscillation, which one expects to see at the SK detector. Comparison of the predicted muon spectra with those of the observed QE and 1-Pion events at the SK detector will be very useful in determining the oscillation parameters.
Since the resonance width of is very small compared to the spread of the beam energy, one can make a narrow resonance approximation for . A common property of QE and narrow resonance production processes is a highly restricted kinematics, i.e.,
| (2) |
where represents the nucleon mass for QE and for resonance production. The other variables are as usual the neutrino energy (), the muon energy () and the 4-momentum squared () transferred between them. We can approximate the production cross-section for the narrow resonance as
| (3) |
where we have replaced the Breit-Wigner factor by the -function. Note that this relation holds exactly for QE scattering with . Thus we get from eqs. (2) and (3)
| (4) |
where , which is 0 for QE scattering. Convoluting this cross-section with the neutrino beam spectrum gives the flux averaged cross-section
| (5) |
Moreover to a first approximation one can integrate over to write
| (6) |
where for both QE and production and the neutrino energy for the K2K experiment [1]. It assumes the effective range of integration to be small, so that over the corresponding neutrino energy range the and can be approximated by their mean values. Thus we see from eq. (5) or (6) that for both QE and narrow resonance production the shape of the muon spectrum is predicted to follow the shape of the incident neutrino spectrum, with a downward shift of the energy scale by . One notes an interesting analogy between this result and the quark parton model, where the structure function in deep inelastic scattering follows the shape of the parton energy distribution within the nucleon.
Of course the shape of the muon spectrum is not exactly identical to the shape of the neutrino spectrum, because it is modulated by the QE (Resonance production) cross-section. The QE ( production) cross-section shows a threshold rise over () and becomes flat thereafter. This will be reflected in steepening of the muon spectra at the low energy end, as we shall see below. On the other hand the shape of the muon spectra on the higher energy side of the peak will be practically identical to that of the incident neutrino spectrum for both QE and production processes. Therefore the relative size of the SK to the ND cross-sections over this region provides a direct measure of the spectral distortion and hence the underlying oscillation parameters.
These are simple but very useful results, particularly since accounts for about of the 1-Pion production cross-section and the QE plus 1-Pion production together account for of the charged-current cross-section at the K2K experiment. It means that one can predict the muon energy spectra of the QE and 1-Pion events in terms of the neutrino energy spectrum from general kinematic considerations without practically any model dependent ansatz. These predictions can be verified with the muon spectra of the QE and 1-Pion events observed by their ND. Even more importantly one can then predict the distortions in the corresponding muon energy spectra at the SK detector, induced by oscillation. Thus the predictions corresponding to eqs. (5) and (6) for the SK detector are
| (7) |
with , and
| (8) |
with . Comparing these predictions with the observed muon energy spectra of the QE and 1-Pion events of the SK detector will test the spectral distortion due to oscillation and determine the oscillation parameters.
Let us first present a simple analytic form of QE and production cross-sections for the ND and SK detector corresponding to eqs. (6) and (8) respectively. For this purpose we have approximated the neutrino energy spectrum by the Lorentzian
| (9) |
which agrees with the shape of the K2K neutrino energy spectrum quite well. The normalization factor of 1.25 ensures that the total flux is normalized to 1 when integrated over the experimental range of instead of to . Figure 1 shows a comparison of the K2K neutrino energy spectrum with the parametrisation of eq. (9). Substituting this in eqs. (6) and (8) gives
| (10) |
and
| (11) |
Finally we have approximated the QE and production cross sections by
| (12) | |||||
| (13) |
They correspond to linear threshold rise for the QE ( production) cross-section between 0–1 (0.4–1.4) , which describes the cross-sections quite well. The normalizations correspond to the average cross-section per nucleon for a target [5].
For the sake of completeness we have also calculated the and contributions using the narrow resonance approximation. Of course it may not work so well for the , which has a width of 350 MeV. But since these resonance contributions to the 1-Pion production cross-section are small, the resulting error will be insignificant. Although there are significant differences between the parametrisations of ref. [5, 7] and ref. [8] for the individual resonances, the cumulative contributions are very similar for the two sets of parameters. We have used the parametrisation of ref. [5, 7] for these resonance production cross-sections.
Figure 2a shows the predicted muon energy spectra for the QE and 1-Pion events, the latter being dominated by the contribution (shown separately). One can clearly see the downward shift of the peak from by for the QE and for the contribution. One can also see the reflection of the threshold rise from eqs. (12) and (13), particularly for the contribution. On the other hand the muon energy spectra to the right of the peak closely follow the shape of the neutrino energy spectrum of Fig. 1. Both the curves agree reasonably well with the more exact calculation of QE and 1-Pion production cross-sections, except for a small range near as discussed below. One can see them to be in general agreement with the observed muon spectra of QE and non-QE events of the K2K ND data [1]. But a quantitative comparison will need to include things like the detection efficiency and experimental cuts, which is beyond the scope of the present work.
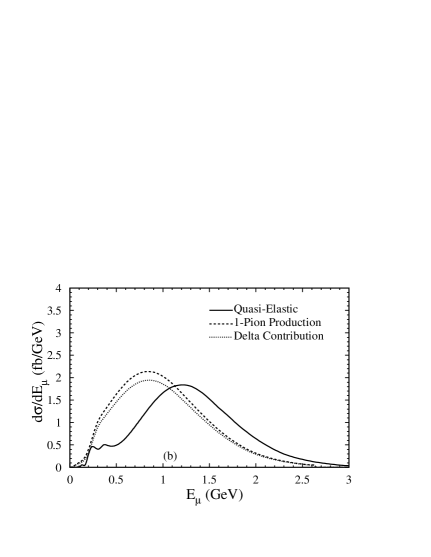
Figure 2b shows the corresponding muon energy spectra of the QE and 1-Pion events for the far away detector, predicted by eqs. (11, 12, 13) along with a small contribution from the higher resonances. One can clearly see the distortion of the muon energy spectra due to oscillation, where we have used the oscillation parameters of eq. (1). They are again in reasonable agreement with the more exact results presented below. It will evidently be very useful to compare these predictions with the observed muon energy spectra of QE and 1-Pion events from the SK detector which is not available to us. Again a quantitative comparison will require taking into account the detection efficiency of the muon and the pion, which can best be done by the K2K Collaboration.
We shall now present the results of an exact calculation. It is based on numerical integration of eqs. (5) and (7) for QE scattering, while for the resonance production it uses the corresponding formulae including the resonance widths. Apart from the leading contribution from the resonance, it includes subleading contributions from the and resonances. We estimate the contribution from the still higher resonances along with the nonresonant background to be no more than of the 1-Pion production cross-section at this energy. Therefore the accuracy of our prediction should be as good as that of the K2K experiment. The parametrisation of the QE and the resonance production cross-sections used in this analysis can be found in [5, 7].
For the excitation of the -resonance we use the formalism of [9, 10] with two distinct form factors for the vector and axial currents. The vector and the axial vector form factors are modified dipoles [11]. For the and resonances we use the form factors from [12].
Fig. 3a shows the predicted muon spectra for the QE and 1-Pion production processes. One can clearly see the downward shift of the peak from by for the QE and for the contribution, dominating the 1-Pion production process. The steepness of the muon spectra at the low energy end reflects the threshold rise. On the other hand they closely follow the shape of the neutrino energy spectrum on the right side of the peak. All these features are in general agreement with the approximate results shown in Fig. 2. One sees however a clear broadening of the muon spectra below compared to the latter. In particular the exact calculation for QE shows a clear excess over the approximate one near as mentioned earlier. This is because the assumption of a small range of integration made in deriving eq. (6) from eq. (5) does not hold here, as the rapid increase of the flux factor upto stretches the effective range of upto . Note that below the range is restricted by the kinematic constraint . So the rapid fall of the spectrum with simply reflects the fall of the flux and the threshold factors with .
The predicted muon spectra of Fig. 3a agree reasonably well with the corresponding spectra of the K2K ND [1] for both the QE and the non-QE parts. In particular one can compare the predicted QE spectrum with their simulated QE spectrum shown in Fig. 1 of ref. [1]. Their Fig. 1a and c show separately the QE muon spectra for the 1-Ring muon () sample of the 1KT and the QE enhanced sample of the FGD respectively. The two play complementary roles in covering the complete muon energy range, as the 1KT and the FGD have high efficiencies at and , respectively [1]. One can not compare our predicted muon spectra with these figures quantitatively without folding in these efficiency factors, which are not available to us. But there is good qualitative agreement between the predicted QE spectrum of our Fig. 3a with their Fig. 1c at and Fig. 1a at . While the former shows the position of the peak and the shape of the spectrum to the right, the latter shows the broadening of spectrum down to as discussed above. Similarly one sees good agreement between the predicted muon spectrum of our Fig. 3a for 1-Pion events with the non-QE spectra of their Fig. 1c,d at and Fig. 1a at . Thus one has a simple and robust prediction for the shape of the muon spectrum in terms of the neutrino spectrum not only for the QE events but also for the 1-Pion events, which dominate the inelastic events.
Fig. 3b shows the corresponding muon energy spectra of the QE and 1-Pion events for the SK detector, predicted by eqs. (1) and (7). Again the curves are in reasonable agreement with the approximate results of Fig. 2b. One can clearly see the distortion of the muon energy spectrum due the oscillation. They should be compared with the observed muon energy spectra of the 1-Ring and 2-Ring muon events at the SK detector, after taking into account the pion detection efficiency. We hope such a comparison will be done by the K2K collaboration.
To estimate the pion detection efficiency one needs to take into account the nuclear absorption, Pauli blocking and charge exchange taking place during the rescattering of the produced pions. We have included these effects following the prescription of ref. [13]. Since the dominant contribution to 1-Pion production process comes from resonance production on Oxygen, we have evaluated the effects of nuclear absorption and rescattering on the produced pion for this case. The relevant subprocesses are , and with relative cross-sections for the dominant contribution from .
Fig. 4 shows the effects of nuclear corrections on the produced and spectra from these processes for the nearby detector averaged over the neutrino spectrum. The results are very similar for the SK detector. Nuclear rescattering effects result in enhancing the events at the cost of the dominant component. But taken together we see a nearly drop in the rate of 1-Pion events due to nuclear absorption of the produced pion. Moreover about of the remaining events corresponds to the pion momentum being less than the Cerenkov threshold of . Therefore one expects about of the events to give a detectable pion ring at the SK detector while the remaining appears like a QE event. Adding the latter to the of genuine QE events would imply that about of the CC events will appear QE-like at the SK detector. This seems to agree with the observation of 1-Ring muon () events at the SK detector out of their FC events. It also agrees with their Monte Carlo simulation of events out of the total of FC events in case of no oscillation. Thus the observed muon energy spectrum of the events should be compared with a weighted average of the predicted spectra for QE and 1-Pion events. Alternatively the observed muon energy spectrum of the sum of 1-Ring and 2-Ring muon events could be compared with the predicted spectrum of the sum of QE and 1-Pion events. Although a part of the 2-Ring events may come from multi-pion production, the resulting error may be small since multi-pion events at the ND constitute only of CC events.
It should be mentioned here that the K2K Collaboration has reconstructed the neutrino energy for the events using the kinematic relation
| (14) |
and used it for testing the spectral distortion due to neutrino oscillation [1]. While this relation holds for genuine QE events, it is not possible to reconstruct the neutrino energy for an inelastic event using only the muon parameters. As we have seen above, about rd of the events may come from 1-Pion production. Hence we can see no reliable way of reconstructing the neutrino energy for this sample on an event by event basis. On the other hand the muon energy is a directly measurable quantity for each event. Therefore it seems to us to be a better variable for testing the spectral distortion phenomenon compared to the reconstructed neutrino energy.
Let us note finally that the above formalism is applicable not only to K2K but also to future long baseline experiments like J2K, MINOS and the CERN-Gran Sasso experiments which plan to use low energy beams [3, 14]. Therefore it will be very useful to extend this analysis for the beam energy spectra and the target nuclei of these experiments.
Acknowledgement
The support of the “Bundesministerium für Bildung, Wissenschaft, Forschung und Technologie”, Bonn under contract 05HT1PEA9 is gratefully acknowledged. The work of D. P. Roy was supported by BMBF. We wish to thank Dr. M. Sakuda for helpful correspondence.
References
- [1] M. H. Ahn et al., K2K Collaboration, Phys. Rev. Lett. 90, 041801 (2003), hep-ex/0212007.
- [2] Y. Fukuda et al., Super-Kamiokande Collaboration, Phys. Rev. Lett. 81, 1562 (1998), hep-ex/9807003.
- [3] Y. Itow, Proc. First Intl. Workshop on Neutrino-Nucleus Interactions in the Few GeV Region (NuInt01), KEK, Japan (2001); Nucl. Phys. B (Proc. Suppl.) 112 (2002) 3.
- [4] For distributions of 2-track events see: M. Sakuda in slides posted for NUINT02-Conference.
- [5] E. A. Paschos, L. Pasquali, and J. Y. Yu, Nucl. Phys. B588, 263 (2000), hep-ph/0005255.
- [6] E. A. Paschos and J. Y. Yu, Phys. Rev. D65, 033002 (2002), hep-ph/0107261.
- [7] E. A. Paschos, Nucl. Phys. Proc. Suppl. 112, 89 (2002), hep-ph/0204138.
- [8] D. Rein and L. M. Sehgal, Ann. Phys. 133, 79 (1981).
- [9] S. L. Adler, Ann. Phys. 50, 189 (1968).
- [10] P. A. Schreiner and F. Von Hippel, Nucl. Phys. B58, 333 (1973).
- [11] E. A. Paschos, M. Sakuda, and J. Y. Yu, hep-ph/0308130.
- [12] G. L. Fogli and G. Nardulli, Nucl. Phys. B160, 116 (1979).
- [13] S. L. Adler, S. Nussinov, and E. A. Paschos, Phys. Rev. D9, 2125 (1974).
- [14] P. Lipari, Proc. First Intl. Workshop on Neutrino-Nucleus Interactions in the Few GeV Region (NuInt01), KEK, Japan (2001); Nucl. Phys. B (Proc. Suppl.) 112 (2002) and references there in.