Final Results on Heavy Quarks at LEP and SLD
Abstract
In the last decade, the LEP and SLD experiments played a central role in the study of B hadrons (hadrons containing a quark). New B hadrons have been observed (, , and ) and their production and decay properties have been measured. In this paper we will focus on measurements of the CKM matrix elements : , , and . We will show how all these measurements, together with theoretical developments, have significantly improved our knowledge on the flavour sector of the Standard Model.
1 Introduction
B physics studies are exploiting a unique laboratory for testing
the Standard Model in the fermion sector, for studying the QCD
in the non-perturbative regime and for searching for New Physics
through virtual processes.
In the last decade, the LEP and SLD experiments played an important role
in the study of B hadrons. At the start of the LEP and SLC accelerator in 1989,
only the and the hadrons were known and their properties were under study.
New weakly decaying B hadrons have been observed (, , ) for
the first time and their production and decay properties have been measured.
New strongly decaying hadrons, the orbitally (L=1) excited B
() mesons have been also observed and their mass and
production rates measured.
In this paper we will focus on the measurements
of the CKM matrix elements : and through B decays
and and using oscillations.
On the other hand many additional measurements on B meson properties
(mass, branching fractions, lifetimes…) are necessary to constrain
the Heavy Quark theories (Operator Product Expansion (OPE) /Heavy Quark Effective Theory (HQET)
/Lattice QCD (LQCD)) to allow for precise extraction of the CKM parameters.
We finally show how these measurements constrain the Standard Model in the fermion sector,
through the determination of the unitarity triangle parameters.
In this paper we try to compare the LEP/SLD results with those obtained from other
collaborations (CLEO at Cornell, CDF at TeVatron and the asymmetric B-factories:
BaBar and Belle) and to present,
when available, the world average result. A detailed description of the results and of
the averaging techniques can be found in [1, 2].
2 B physics at the
At the resonance, B hadrons are produced from the coupling of the
to a quark pair. The production cross section is of 6 nb,
which is five times larger than at the .
Because of the specific (V-A) behaviour of the electroweak coupling at the pole,
hadronic events account for about 70 of the total production rate; among
these, the fraction of events is .
Because of the energy available only and mesons can be
produced at the .
The B particles are produced almost at rest (the average momentum is of about 350 MeV/c),
with no accompanying additional hadrons, and the decay products of the two
B particles are spread isotropically over the space.
At the Z pole, the primary pair, picks up from the
vacuum other quark-antiquarks pairs and hadronizes into B hadrons plus
few other particles.
Therefore not only and mesons are produced, but also
mesons or baryons can be present in
the final state.
The and the hadronize almost independently. quarks
fragment differently from light quarks, because of their high mass as
compared with . B hadrons carry, on average,
about 70 of the available beam energy, whereas the rest of the energy is
distributed among the other fragmenting particles. As a consequence,
the two B hadrons fly in opposite directions and their decay products
form jets situated in two opposite hemispheres.
The hard fragmentation and the long lifetime of the b quark
make that the flight distance of a B hadron at the Z pole, defined
as , on average of the order of 3 mm.
As decay products have a mean charged multiplicity of 5
∗*∗*On average there are as many particles originating from -quark
fragmentation and from B decay.,
it was possible to tag B hadrons using a lifetime tag.
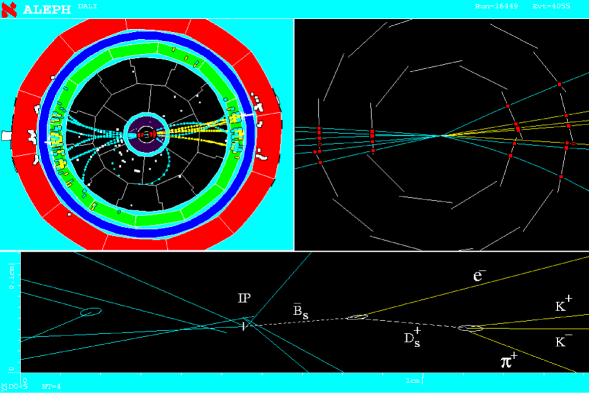
Most of the precision measurements in B physics performed at LEP/SLC, Tevatron and B factories, would not have been possible without the development of Silicon micro vertex detectors. In practice the averaged flight distance of the B hadrons becomes measurable thanks to the precision of silicon detectors, located as close as possible to the beam interaction point. These detectors determine with a precision better than 10 , the position of a charged particle trajectory. In particular the separation between quarks and other quarks is mainly based on the use of vertex detectors. Charged particles produced at the B vertex (secondary vertex) can be separated from those produced at the interaction point (primary vertex) using the precise tracking information. In spite of the relatively small statistics collected by the SLD experiment, it gave very important and competitive contributions to B physics, because of its silicon vertex detectors, which is located very close to the interaction point. A typical LEP event is shown in Figure 1.
Because of the large B mass, B hadrons are expected to decay into several decay modes with branching ratio of the order of a per mil.
According to the registered statistics, at LEP,
inclusive or semi-exclusive -hadron
decays had to be studied in place of exclusive channels for which
very few events are expected††††††with the final LEP statistics,
B rare decays with branching fraction of the order of a few
10-5 could be accessed..
Semileptonic decays benefit of a large branching ratio ( of the order
of 10 ) and of clean and easily distinguishable final states.
Semileptonic decays allow also to distinguish between different types
of hadrons, by reconstructing charmed hadrons.
As an example, a accompanied by a lepton with negative
electric charge, in a jet, signs a -baryon.
For baryons, it is not even necessary to completely reconstruct the
charmed baryon, correlations as or
are sufficient.
Similarly, or events in a jet, provide
event samples enriched in and mesons
respectively.
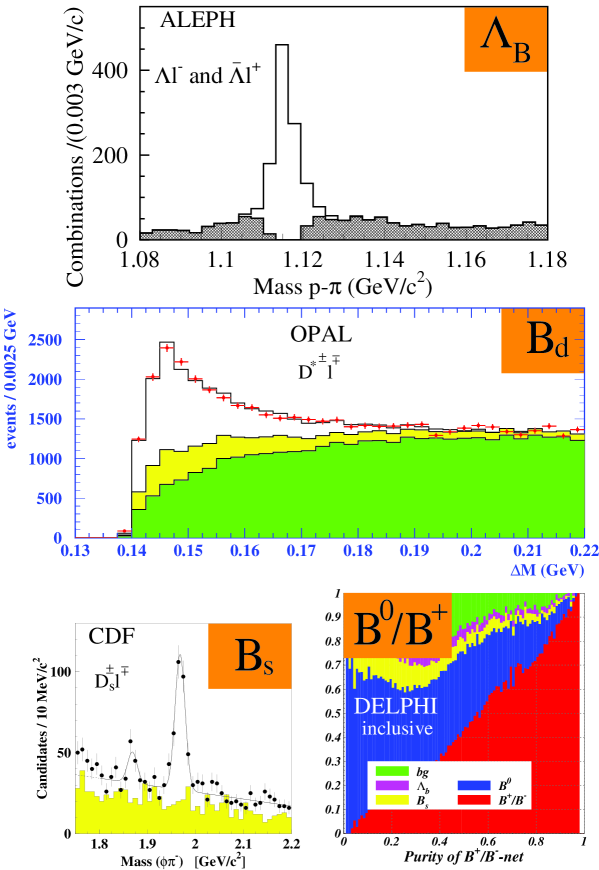
An overview of the signals used to study these new states is given
in Figure 2.
3 Example of historical evolution
We take the example of the meson to illustrate how our knowledge
on the properties of B hadrons has evolved during the last ten years.
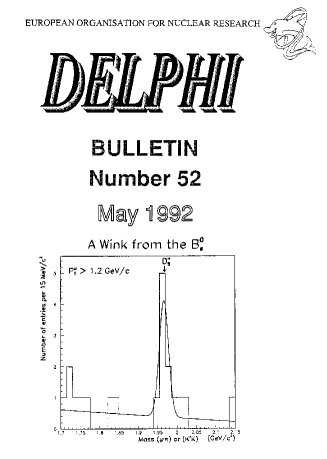
In 1992, 7 events ,
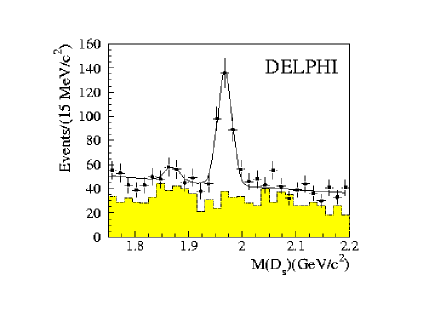
constituted the first evidence for the meson. A few years later the same
signal consists of more than 200 events.
In the mean time our knowledge has much improved: the fraction of mesons in b jets is
precisely measured as well as the mass and lifetime.
-
•
the rate in -jets amounts to: ,
-
•
the meson mass is MeV (CDF mainly)
-
•
the lifetime is .
-
•
the studies on oscillations give
-
•
the ratio
4 Heavy hadron lifetimes
Measurements of B lifetimes test the decay dynamics, giving important information on non-perturbative QCD corrections induced by the spectator quark (or diquark). Decay rates are expressed using the OPE formalism, as a sum of operators developed in series of order . In this formalism, no term of order is present and spectator effects contribute at order ‡‡‡‡‡‡Terms at order 1/ would appear if in this expansion the mass of the heavy hadron was used instead of the mass of the quark. The presence of such a term would violate the quark-hadron duality.. Non-perturbative operators are evaluated, most reliably, using lattice QCD calculations.
4.1 Beauty hadron lifetimes
Since the beginning of the LEP/SLD data taking an intense activity has been concentrated
on the studies of B hadron lifetimes.
Results are given in Table 1 [3].
| B Hadrons | Lifetime [ps] |
|---|---|
| 1.540 0.014 (0.9 ) | |
| 1.656 0.014 (0.8 ) | |
| 1.461 0.057 (3.9 ) | |
| 1.208 0.051 (4.2 ) | |
| = 1.073 0.014 | |
| = 0.949 0.038 | |
| = 0.798 0.052 | |
| = 0.784 0.034 | |
Figure 4 gives the ratios of different B hadron lifetimes, as compared with theory predictions (dark(yellow) bands).
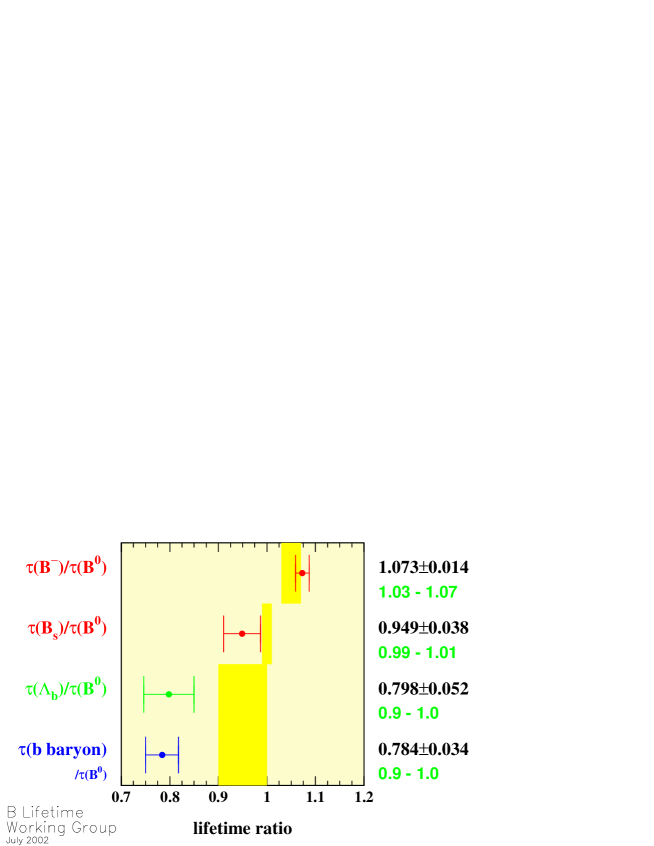
The achieved experimental precision is remarkable and LEP results are
still dominating the scene. The fact that charged B mesons live longer than
neutral B mesons is now established at 5 level and is in agreement with theory.
The and lifetimes are expected (at 1) and found (at 4)
to be equal. A significant measurement in which this ratio differs
from unity will have major consequences for the theory.
The lifetime of the b-baryons is measured to be shorter than the lifetime, but the size
of this effect seems to be more important than predicted (2-3).
Recent calculations of high order terms give an evaluation of
the b-baryon lifetime
in better agreement with the experimental result[4].
New results are expected from B-Factories (which could decrease the relative error on
the lifetimes of the and to 0.4-0.5) and mainly from Tevatron (Run II)
which could precisely measure all B hadron lifetimes, including those for the ,
and the .
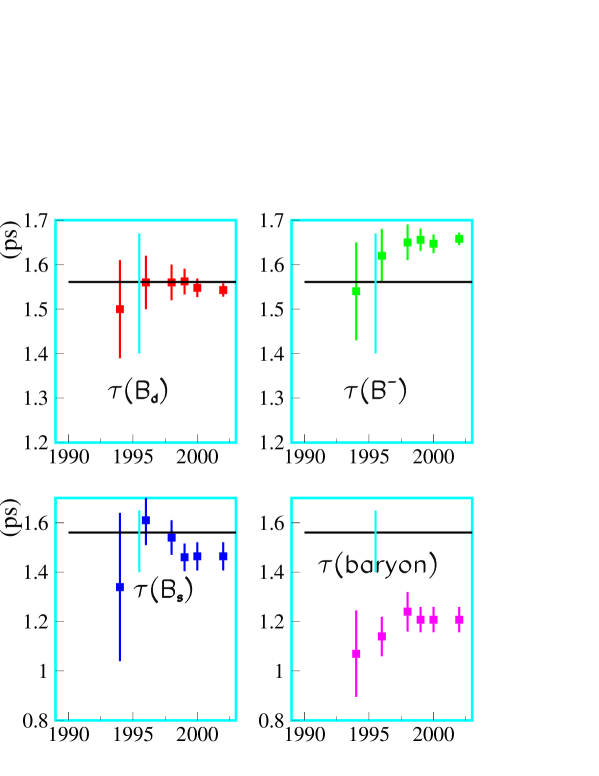
In figure 5 the improvement on the precision of
the measured B hadron lifetimes over the years is shown.
5 Determination of the CKM element:
The element of the CKM matrix can be accessed by studying the rates of inclusive and exclusive semileptonic -decays.
5.1 inclusive analyses.
The first method to extract makes use of the inclusive semileptonic decays of B-hadrons and of the theoretical calculations done in the framework of the OPE. The inclusive semileptonic width is expressed as:
| (1) |
From the experimental point of view the semileptonic width has been measured by the LEP/SLD and experiments with a relative precision of about 2 [5]:
| (2) |
The precision on the determination of is mainly limited by theoretical uncertainties on the parameters entering in the expression of in equation 1.
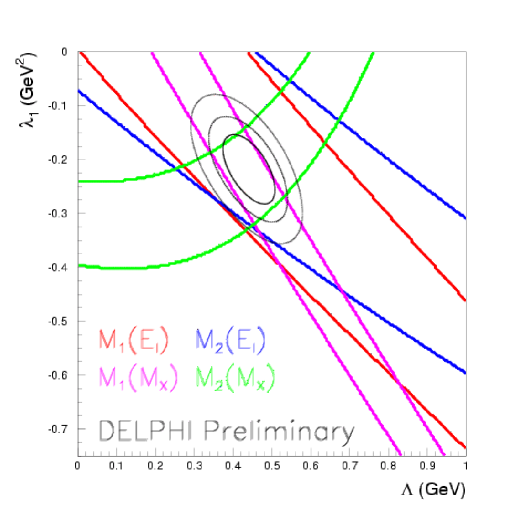
5.2 Moments analyses
Moments of the hadronic mass spectrum, of the lepton energy spectrum and of
the photon energy in the decay are sensitive to the non
perturbative QCD parameters contained in the factor of
equation 1 and in particular to the mass of the and quarks
and to the Fermi motion of the heavy quark inside the hadron,
§§§§§§In another formalism,
based on pole quark masses, the and parameters are used, which can
be related to the difference between hadron and quark masses and to , respectively..
Results from DELPHI collaboration are shown in Figure 6.
Similar results (and with comparable precision) have been obtained by CLEO (which did a
pioneering work in this field) and by the BaBar Coll. [2].
Using the experimental results on and :
| (3) |
This result corresponds to an important improvement on the determination of the element. Part of the theoretical errors (from and ) is now absorbed in the experimental error and the theoretical error is reduced by a factor two. The remaining theoretical error could be further reduced if the parameters controlling the corrections are extracted directly from experimental data.
5.3 : analyses.
An alternative method to determine is based on exclusive decays. Using HQET, an expression for the differential decay rate can be derived
| (4) |
is the relative velocity between the B () and the D systems (). G() is a kinematical
factor and F() is the form factor describing the transition. At zero recoil (=1)
F(1) goes to unity. The strategy is then to measure , to extrapolate
at zero recoil and to determine .
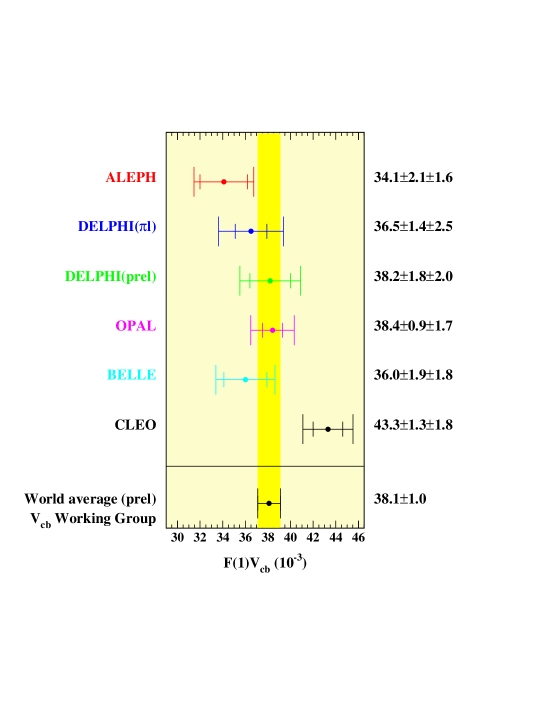
The experimental results are summarised in Figure 7.
Using F(1) = 0.91 0.04 [6], it gives [5]:
| (5) |
Combining the two determinations of (a possible correlation between the two determinations has been neglected) it gives [2]:
| (6) |
6 Measurement of .
The CKM matrix element has been measured at LEP using semileptonic to decays. This measurement is rather difficult because one has to suppress the large background from the more abundant semileptonic to quark transitions. By using kinematical and topological variables, the LEP experiments have succeeded in measuring the semileptonic to branching ratio [7], and obtain :
Using models based on the Operator Product Expansion, a value for is obtained :
| (7) |
Prior to this analysis, the matrix element was firstly obtained, by CLEO and
ARGUS collaborations, by looking at the spectrum of the lepton in B semileptonic decays.
The difference between D meson and masses is reflected in the momentum of
the lepton from the B decays. This analysis has been recently revised by the CLEO Coll..
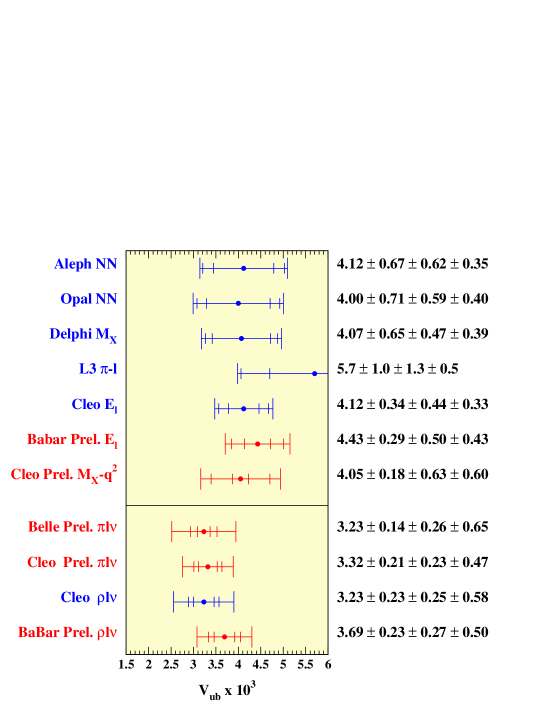
An alternative method to determine consists in the reconstruction of the charmless
semileptonic B decays: . This analysis has been performed
by the CLEO Coll. and now by the b-factories.
Figure 8 shows the full set of results on [8].
7 Study of oscillations
The probability that a meson oscillates into a or remains a is given by:
| (8) |
Where is the proper time, the lifetime of the
meson, and the mass difference
between the two physical mass eigenstates
¶¶¶¶¶¶ is usually given in ps-1: 1 ps-1 corresponds to
6.58 10-4eV..
To derive this formula the effects of CP violation and lifetime differences
for the two states have been neglected.
Integrating expression 8, over the decay time,
the probability to observe a meson starting from a
meson is given by , where . At Z energies, both and
mesons are produced with fractions and . The average mixing parameter
is defined as : .
It has to be noted that for fast oscillations takes values close
to 0.5 and becomes very insensitive to . Even a very precise measurement
of does not allow a determination of .
It is then clear that only the time evolution of the
oscillations allow to measure and .
A time dependent study of oscillations requires:
-
•
the measurement of the proper time t,
-
•
to know if a or a decays at time t (decay tag)
-
•
to know if a or a quark has been produced at t = 0 (production tag).
In the Standard Model, oscillations occur through a second-order process - a box diagram - with a loop of W and up-type quarks. The box diagram with the exchange of a quark gives the dominant contribution :
| (9) |
where .
Thus, the measurement of and gives access to the CKM matrix elements and respectively. The difference in the dependence of these expressions () implies that . It is then clear that a very good proper time resolution is needed to measure the parameter. On the other hand the measurement of the ratio gives the same constraint as but this ratio is expected to have smaller theoretical uncertainties since the ratio is better known than the absolute value of .
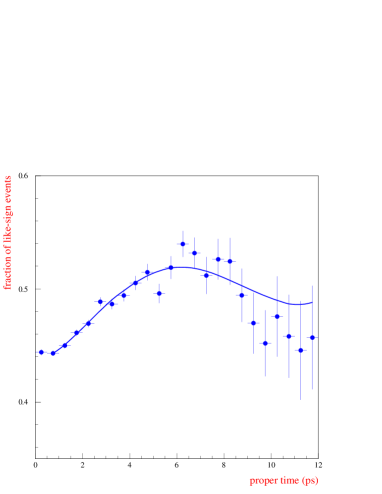
measurements
Analyses using different events sample have been performed at LEP. A typical time distribution is shown in Figure 9. oscillations with a frequency are clearly visible. This can be a textbook plot ! The present summary of these results on , is shown in Figure 10. Combining LEP, CDF and SLD measurements it follows that [9]:
| (10) |
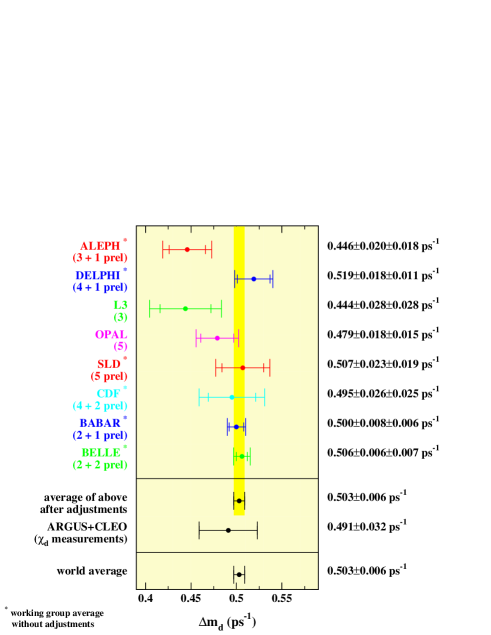
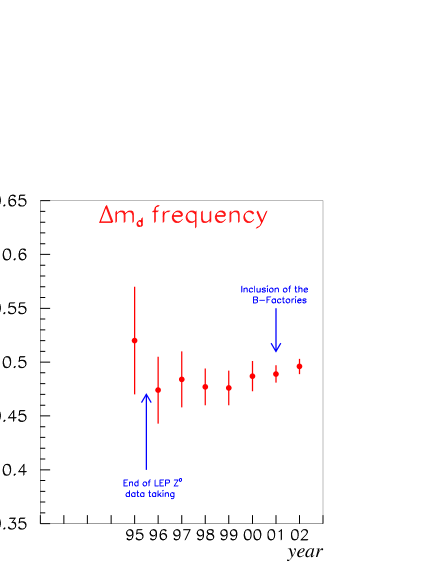
has been first measured with high precision by the LEP/SLD/CDF experiments. The new and precise measurements performed at the B-Factories confirmed these measurements and improved the precision by a factor two. the combined result is now : . The evolution, over the years, of the combined frequency measurement is shown in Figure 11.
Analyses on
The search for oscillations is more difficult because the oscillation frequency is much higher. In the Standard Model one expects . The proper time resolution will therefore play an essential role. Five different types of analyses have been performed at LEP/SLD. An overview is given in Table 2.
| Analysis | N(events) | ||||
|---|---|---|---|---|---|
| Dipole | ps | ||||
| Inclusive lepton | ps | ||||
| ps | |||||
| ps | |||||
| Exclusive | ps |
The so-called amplitude method [10] has been developed to combine data from different experiments. It corresponds to the following change in equation 8:
A and are measured at fixed values of . In case of a clear oscillation signal, the measured amplitude is compatible with A = 1 at the corresponding value of . With this method it is also easy to set an exclusion limit. The values of excluded at 95% C.L. are those satisfying the condition A() + 1.645 . Furthermore, the sensitivity of the experiment can be defined as the value of corresponding to 1.645 (for A(, namely supposing that the “true” value of is well above the measurable value of ).
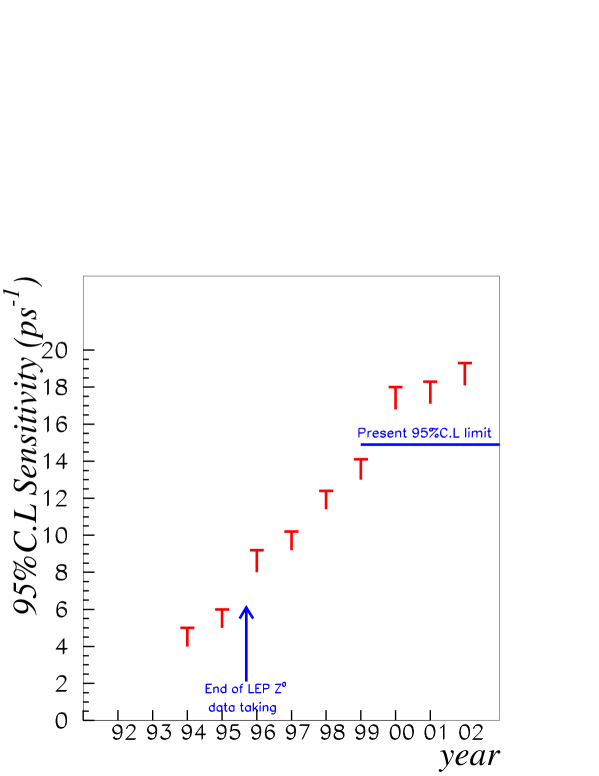
During the last seven years impressive improvements in the analysis techniques
allowed to improve the sensitivity of this search, as it can be seen in
Figure 12.
The combined result of the LEP/SLD/CDF [9] analyses, displayed as an
amplitude vs plot, is shown in Figure 13 and is:
The sensitivity is at .
The summary of the present results on is shown in Figure 14.
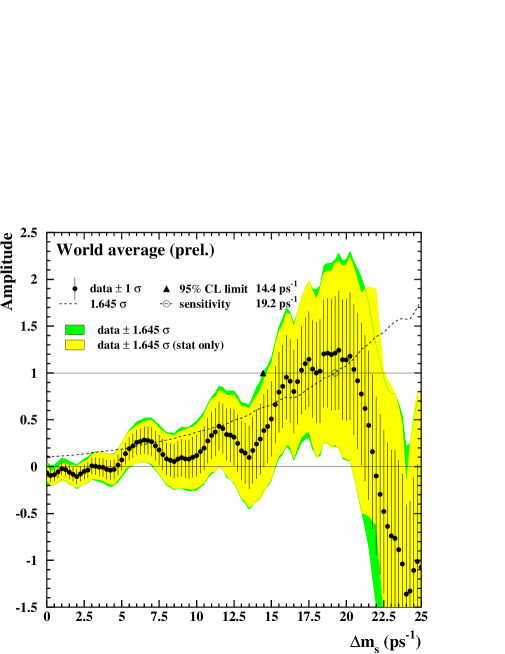
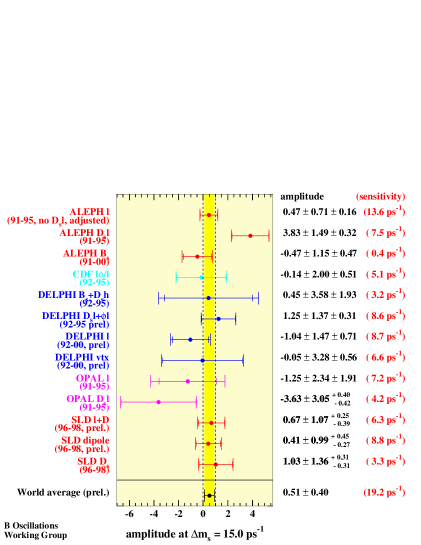
The present combined limit implies that oscillates at least 30
times faster than mesons.
The significance of the “signal”, appearing around 17 ps-1, is about 2.5 and
no claim can be made on the observation of oscillations.
Tevatron experiments, are thus expected to measure soon oscillations…
8 The CKM Matrix
In the Standard Model, the weak interactions among quarks are encoded
in a 3 3 unitary matrix: the CKM matrix.
The existence of
this matrix conveys the fact that quarks weak interaction eigenstates are a
linear combination of their mass eigenstates [11, 12].
| (11) |
The CKM matrix can be parametrized in terms of four free parameters. Here, the improved Wolfenstein [13] parametrization, expressed in terms of the four parameters , , and (which accounts for the CP violating phase) , will be used:
| (12) |
The CKM matrix elements can be expressed as:
| (13) |
where the parameters and have been introduced [14] ∥∥∥∥∥∥ .
The parameter is precisely determined to be
∗∗**∗∗**due to the disagreement between the different determinations
has been recently evaluated to be [7]:
using semileptonic kaon decays. The other parameters: ,
and were rather unprecisely known.
The Standard Model predicts relations between the different processes
which depend upon these parameters; CP violation is accommodated in the CKM
matrix and its existence is related to .
The unitarity of the CKM matrix can be visualized as a triangle in the
plane. Several quantities, depending upon
and can be measured and they must define compatible values for
the two parameters, if the Standard Model is the correct description of these
phenomena. Extensions of the Standard Model can provide different predictions
for the position of the upper vertex of the triangle, given by the
and coordinates.
| Parameter | Value | Gaussian | Uniform | Ref. |
| half-width | ||||
| 0.0020 | - | [7] | ||
| (excl.) | - | [16] | ||
| (incl.) | [16] | |||
| (excl.) | [7] | |||
| (incl.) | [7] | |||
| – | [9] | |||
| 14.4 ps-1 at 95% C.L. | sensitivity 19.2 ps-1 | [9] | ||
| – | [17] | |||
| [18] | ||||
| 1.18 | 0.04 | [18] | ||
| 0.86 | 0.06 | 0.14 | [18] | |
| sin 2 | 0.734 | 0.054 | - | [19] |
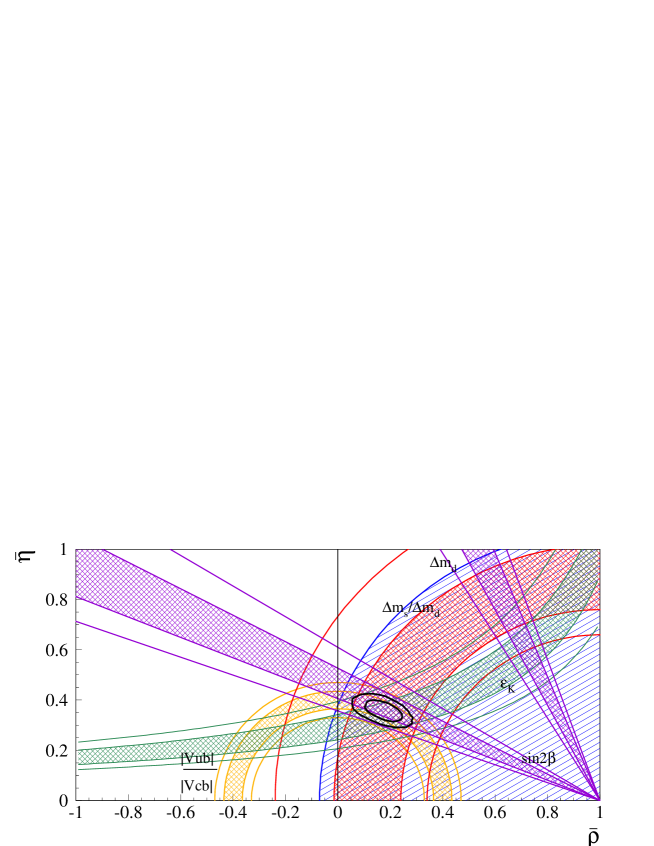
Different constraints can be used to select the allowed region for the apex of the triangle
in the - plane.
Five have been used so far: , , , the limit on
and sin 2 from the measurement of the CP asymmetry in decays.
These constraints are shown in Figure 15 [15].
These measurements provide a set of constraints which are obtained by comparing measured
and expected values of the corresponding quantities, in the framework of the Standard Model (or
of any other given model). In practice, theoretical expressions for these constraints involve several
additional parameters such as quark masses, decay constants of B mesons and bag-factors. The values of
these parameters are constrained by other measurements (e.g. the top quark mass)
or using theoretical expectations.
Different statistical methods have been defined to treat experimental and theoretical errors.
The methods essentially differ in the treatment of the latter and can be classified into two main
groups: frequentist and Bayesian. The net result is that, if the same inputs are used, the different
statistical methods select quite similar values for the different CKM parameters [21].
The results in the following are shown using the Bayesian approach.
Central values and uncertainties taken for the relevant parameters used in
these analyses are given in Table 3 [20].
The most crucial test is the comparison between the region selected by the measurements which are sensitive only to the sides of the Unitarity Triangle and the regions selected by the direct measurements of the CP violation in the kaon () or in the B (sin2) sector. This test is shown in Figure 16.

It can be translated quantitatively in the comparison between the value of sin2 obtained from the measurement of the CP asymmetry in decays and the one determined from triangle “sides“ measurements [2],[20]:
| (14) |
The spectacular agreement between these values shows the consistency of the Standard
Model in describing the CP violation phenomena in terms of one single parameter .
It is also an important test of the OPE,HQET and LQCD theories which have been used to extract the
CKM parameters.
The ranges within parentheses correspond to 95 probability.
The results on and are predictions for those quantities
which will be measured in near future.
9 Conclusions
During the last ten years, our understanding of the flavour sector of the Standard Model
improved. LEP and SLD played a central role.
At the start of LEP and SLD, only the and the hadrons were known and
their properties were under study. Today B hadrons have been carefully
studied and many quantities have already been measured with good precision.
The hadron lifetimes are now measured at the one/few percent level.
LEP experiments are the main contributors for the measurement of , which is known with
a relative precision better than 2. In this case, not only, the decay width has
been measured, but also some of the non-perturbative QCD parameters
entering in its expression. It is a great experimental
achievement and a success for the theory description of the non-perturbative
QCD phenomena in the framework of the OPE.
LEP experiments have been pioneering in determining using inclusive methods and reaching
a precision of about 10, defining a road for future measurements at B-factories.
The time behaviour of oscillations has been studied and precisely measured in the
sector. The new and precise measurements performed at the B-Factories confirmed these measurements
and improved the precision by a factor two. The oscillation frequency is known with
a precision of about 1. oscillations have not been measured so far,
but this search has pushed the experimental limit on the oscillation frequency
well beyond any initial prediction for experimental capabilities.
SLD experiment has played a central role in this search.
Today we know that oscillates at least 30 times faster than mesons.
The frequency of the oscillations will be soon measured at the Tevatron.
Nevertheless the impact of the actual limit on for the determination of the unitarity
triangle parameters is crucial.
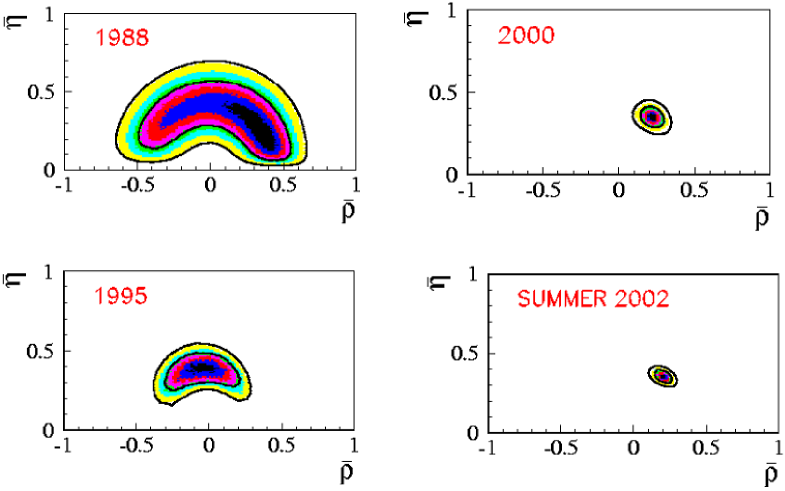
The unitarity triangle parameters are today known within good precision.
The evolution of our knowledge concerning the allowed region in the -
plane is shown in Figure 17. The reduction in size of the error bands, from the year 1995
to 2000, is essentially due to the analyses
described in this paper and to the progress in the OPE, HQET and LQCD theories.
The reduction between 2000 and 2002 is also driven by the precise measurements of sin 2
at the -factories.
A crucial test has been already done: the comparison between the unitarity triangle parameters, as determined with quantities sensitive to the sides of the unitarity triangle (semileptonic B decays and oscillations), with the measurements of CP violation in the kaon () and in the B (sin2) sectors. This agreement tells us that the Standard Model is also working in the flavour sector and it is also an important test of the OPE,HQET and LQCD theories which have been used to extract the CKM parameters. On the other hand, these tests are at about 10 level accuracy, the current and the next facilities can surely push these tests to a 1 level.
10 Acknowledgements
I would like to thank the organisers for the invitation and for having set up a very
interesting topical conference in a stimulating and nice atmosphere during and after the talks.
Thanks to all the LEP and SLD members which have made all of it possible ! I would also like to remember the
important work made from the members of the Heavy Flavour Working Groups who prepared
a large fraction of the averages quoted in this note. They are all warmly thanked.
Thanks to P. Roudeau for the careful reading of the manuscript.
References
- [1] ALEPH, CDF, DELPHI, L3, OPAL, SLD Collaborations, CERN-EP/2001-050
- [2] A. Stocchi, plenary talk given at the XXXIst ICHEP, Amsterdam 24-31 July 2002, hep-ph/0211245.
-
[3]
LEP B Lifetime Working Group:
http:lepbosc.web.cern.ch/LEPBOSC/lifetimes/lepblife.html - [4] E. Franco, V. Lubicz, F. Mescia, C. Tarantino, Nucl. Phys. B633 (2002) 212. (hep-ph/02030890).
- [5] Working Group: http:lepvcb.web.cern.ch/LEPVCB/
- [6] L. Lellouch, plenary talk given at the XXXIst ICHEP, Amsterdam 24-31 July 2002 ; A. S. Kronfeld, P. B. Mackenzie, J. N. Simone, S. Hashimoto, S. M. Ryan, proceedings of FPCP, May 16–18, Philadelphia, Pennsylvania (hep-ph/0110253); Phys. Rev. D66 (2002) 014503.
-
[7]
Results presented at the CKM Unitarity Triangle
Workshop, CERN Feb. 2002:
http:ckm-workshop.web.cern.ch/ckm-workshop/ in particular see also:
LEP Working group on : http:lepvcb.web.cern.ch/LEPVCB/ Winter 2002 averages.
LEP Working group on :
http:battagl.home.cern.ch/battagl/vub/vub.html. - [8] M. Battaglia, talk given at the XXXIst ICHEP, Amsterdam 24-31 July 2002.
-
[9]
LEP Working group on oscillations:
http:lepbosc.web.cern.ch/LEPBOSC/combinedresults/amsterdam2002/. - [10] H.G. Moser and .A. Roussarie, Nucl. Instrum. Meth. A384 (1997) 491.
- [11] N. Cabibbo, Phys. Rev. Lett. 10 (1963) 531.
- [12] M. Kobayashi and K. Maskawa, Prog. Theor. Phys. 49 (1973) 652.
- [13] L. Wolfenstein, Phys. Rev. Lett. 51 (1983) 1945.
- [14] A.J. Buras, M.E. Lautenbacher and G. Ostermaier, Phys. Rev. D50 (1994) 3433.
- [15] For details see : M. Ciuchini et al., JHEP 0107:013, 2001 hep-ph/0012308.
- [16] M. Artuso and E. Barberio, hep-ph/0205163.
-
[17]
F. Abe et al., CDF Collaboration,
Phys. Rev. Lett. 74 (1995) 2626.
S. Abachi et al., D0 Collaboration, Phys. Rev. Lett. 74 (1995) 2632. - [18] L. Lellouch, plenary talk given at the XXXIst ICHEP, Amsterdam 24-31 July 2002.
- [19] Average from Y. Nir see these proceedings based on: R. Barate et al., (ALEPH Collaboration) Phys. Lett. B492 (2000), 259-274; K. Ackerstaff et al., (OPAL Collaboration) Eur. Phys. C5 (1998) 379; T. Affolder at al., Phys. Rev. D61 (2000) 072005; B. Aubert et al., (Babar Collaboration) hep-ex/0207042; K. Abe at al., (Belle Collaboration) hep-ex/0207098.
- [20] F. Parodi, talk given at the XXXIst ICHEP, Amsterdam 24-31 July 2002.
-
[21]
Results presented at the CKM Unitarity Triangle
Workshop, CERN Feb 2002.
http:ckm-workshop.web.cern.ch/ckm-workshop/
For the description of the methods see:
M. Ciuchini et al., JHEP 0107 (2001) 013 (hep-ph/0012308).
A. Höcker, H. Lacker, S. Laplace, F. Le Diberder, Eur. Phys. J. C21, 225 (2001).
G. P. Dubois-Felsmann D. G. Hitlin, F. C. Porter and G. Eigen, CALT 68-2396 June 2002.