Meson model for production in peripheral pion-nucleon reactions
Abstract
The Jülich model for -scattering, based on an effective meson-meson Lagrangian is applied to the analysis of the -wave production amplitudes derived from the BNL E852 experiment for a pion momentum of 18.3 GeV and the GAMS experiments performed at and . The unexpected strong dependence of the S-wave partial wave amplitude on the momentum transfer between the proton and neutron in the vicinity of the resonance is explained in our analysis as interference effect between the resonance and the the non-resonant background.
pacs:
11.80.Gw,13.85.-t,14.40.Aq,14.40.CsMeson spectroscopy in the scalar-isoscalar channel has received increasing interest motivated by the search for non- mesons, such as glueballsAmsler (1998). The large number of experimentally observed resonances suggests that some of those resonances may have a more complicated structure than the conventional structure Amsler (2002); Abele et al. (2001). The has been a candidate for a non- meson for more than two decadesJaffe (1977); Weinstein and Isgur (1990); Lohse et al. (1990); Barnes (1985); Pichowsky et al. (2001); Oller et al. (1998); Achasov and Shestakov (1998).
Recently, the scalar-isoscalar partial wave amplitudes have been deduced from two pion interaction obtained via the charge-exchange reaction measured for incident pion momentum of 18.3 GeV by the E852 collaboration at the Brookhaven National LaboratoryGunter et al. (2001). In the vicinity of the invariant two-pion mass MeV, a peculiar behavior of the -wave amplitude has been observed. Such an effect has also previously been reported by the GAMS collaboration for a beam momentum of 38 GeV Alde et al. (1995). While for small momentum transfers between the proton and the neutron the scalar amplitudes show a dip around 1 GeV, a sharp peak is seen at the same energy for large momentum transfers .
This observation has been interpreted as evidence for a hard component in the which would make the interpretation of this scalar meson as a molecule unconvincing Klempt (2000); Kondashov (1999); Anisovich et al. (1995); Anisovich (2002). Here we want to show that the strong dependence of the -production on the momentum transfer between the proton and the neutron is not in contradiction with a strong contribution to the . Actually we will show in the following that this -dependence is due to the interference between the resonance structure and the non-resonant background and does not depend on the detailed structure of the .

For ultrarelativistic beam momenta in the present kinematical regime the reaction is a peripheral one. This implies a relatively simple reaction mechanism which suppresses especially the excitation of nucleon resonances. The relevant Feynman diagrams are displayed in Fig.1. In a peripheral reaction one assumes that the incoming pion interacts with the meson cloud of the proton only once. On the other hand one fully considers the final state interaction between the produced mesons. In a peripheral charge-exchange reaction, only isovector mesons have to be considered. The -meson cannot contribute because of G-parity. This leaves the pion and the -meson as the only relevant mesons with parity to be exchanged in the t-channel. The for example cannot contribute in the reaction since it has quantum numbers . However the -exchange is known to be important in peripheral -reactionsKaminski et al. (1997); Achasov and Shestakov (1998).
The final state interaction of the produced mesons is described by an improved version of the Jülich meson-exchange modelLohse et al. (1990); Krehl et al. (1997). This means we use the Blankenbecler Sugar scattering equationBlankenbecler and Sugar (1966) to generate our pion pion -matrix.
Here and are the momenta of the initial and final particles in the center of mass frame and is the total energy of the system. The propagator has been constructed in a way that ensures unitarity for the -matrix and is given by:
with . Furthermore is calculated in the one boson exchange approximation including - and -channel graphs. The subscripts to the transition matrix , the propagator and the potential indicate the coupled channels used in our analysis. They are the and the channel as well as the newly added reaction channels. When adding the latter we used the Wess-Zumino LagrangianWess and Zumino (1967) for the -coupling.
We also investigated whether our -molecule was artifically generated by the independent choice of - and -channel form factors.
Correlating the form factors by dispersion relations we found no hint in this direction. In the original model, only one scalar meson was included. Now we consider both the and the mesons as -channel diagrams. The couplings of these mesons to the three reaction channels considered were adjusted to reproduce the two-pion decays of the resonances. We found , , and . These are effective couplings which also simulate the influence of decay channels. This is a minimal extension of the original Jülich model which allows to discuss the structure of the , which is our main point of interest. To analyze the decay structure of the and the mesons, the inclusion of decays would be required, however Abele et al. (2001). The phase shifts obtained in the new model are very similar to the ones of Ref. Lohse et al. (1990).
Given the large beam momentum, we describe the initial - and -meson exchanges by the corresponding Regge trajectories. In ultrarelativistic two-pion production reactions, the cross sections decrease exponentially with the momentum transfer . In the partial wave analysis of the data, one therefore attaches a slope factor . The analysis of the BNL data required the introduction of two different slope factors. We interprete the two slope factors as effective form factors of the - and the -vertices. Choosing and , the model can reproduce the experimental slope up to , see Fig.1. The full -dependence is given by:
| (1) | |||||
Please note that and are not constant and that adding the absolute values squared is to account for the helicity structure as will be explained later. Furthermore should be considered a free parameter as explained in Achasov and Shestakov (1998) where our value of was taken from.
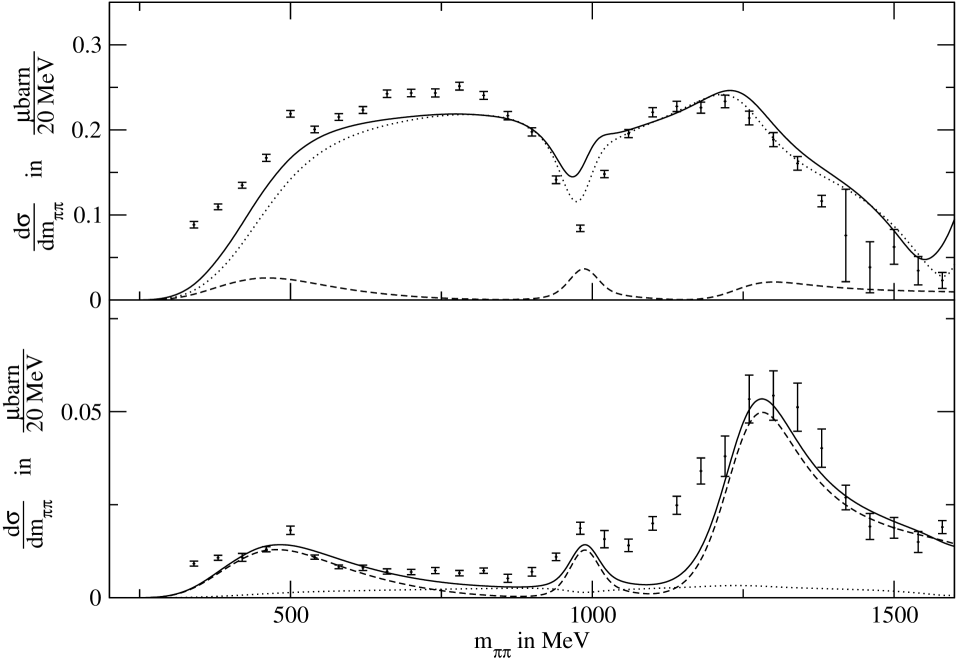
In Fig.2, the -wave contribution to the total cross section is shown as a function of the invariant two-pion mass. In the upper part, the data integrated over the momentum range show a broad strength distribution from threshold to about 1.5 GeV, interrupted by a dip near 980 MeV. Our microscopic meson-theoretical model is able to reproduce this behavior nearly quantitatively. The model includes the , , and reaction channels, but no coupling to the -channel. For the small momentum transfers displayed in the upper part of Fig.2, the contribution due to the exchange of a pion in the initial -channel is dominant. For invariant masses ranging from threshold to about 1 GeV, the experimental phase shifts in the -wave rise almost linearly to about . The corresponding partial wave amplitude therefore becomes negative in the vicinity of . This implies a destructive interference with the amplitude which describes the meson and generates the dip seen in the data. At even higher energies the shows a similar behavior. At larger momentum transfers, the broad bump has disappeared in the data and one observes a narrow peak around 1 GeV. In that momentum regime (lower part of Fig.2) the contribution due to the pion in the initial -channel is negligibly small within our meson exchange model and the exchange gives the dominating contribution. (This can be traced back to the different slope factors.) Due to the spin structure interference effects between - and -exchange can be neglected since the -emission mainly conserves the helicity of the nucleon whereas the -emission dominantly flips the nucleon helicity. But since the resonant contribution is now in phase with the non-resonant background we observe the opposite behavior compared to the upper part: the resonance shows as a peak.
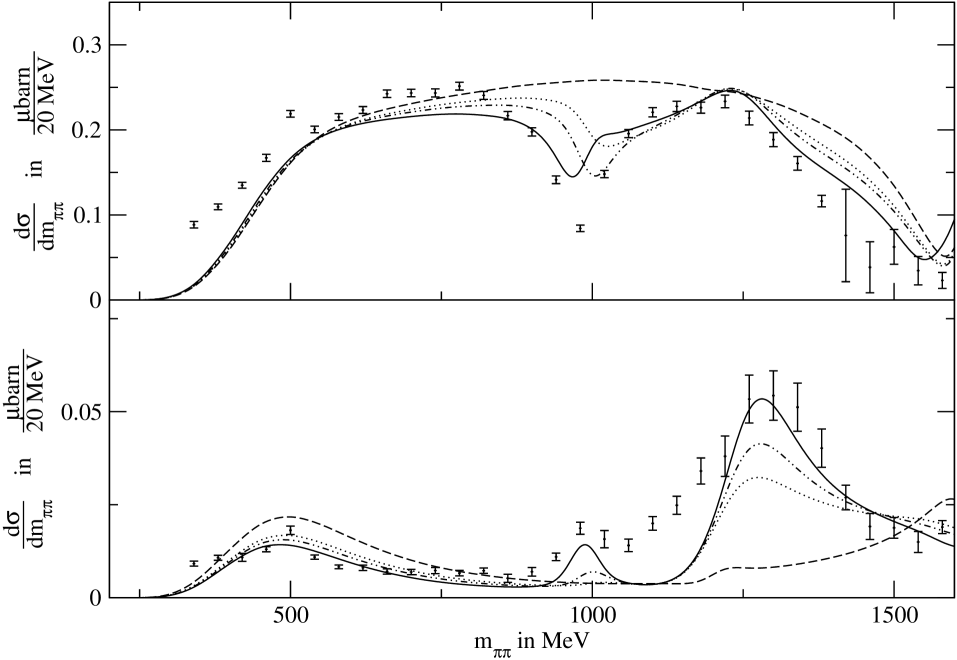
In contrast to an empirical analysis which assumes a smooth background to which parameterized resonances are added Anisovich et al. (1995); Achasov and Shestakov (1998), the present approach derives the background in a consistent way within our model. This is essential for interference effects. To illustrate this point, we performed a series of calculations in which the transition potentials connecting the channel and the channel via -channel meson exchanges were multiplied by a scaling factor which we changed from 0 to 1. The -channel meson exchanges within the channel were scaled by the same factor. For , the and channel can interact only via -channel diagrams. The corresponding contributions to the -wave total cross sections are shown in Fig.3.
For small momentum transfers between the proton and the neutron (upper part of Fig.3), one finds a broad strength distribution extending up to 1500 MeV, if the -channel coupling to the channel is switched off (). Allowing a small coupling to the channel (), the cross section decreases in the energy region between MeV and the onset of the resonance at about MeV. As the scaling strength is further increased, a dip develops near MeV. For large momentum transfers between the proton and the neutron (lower part of Fig.3), a bump in the vicinity of MeV appears when the coupling to the channel is switched on.
Near MeV, a calculation without coupling to the channel overestimates the data. With increasing coupling strength the shape of the experimental strength distribution and the relative size of the bumps centered at MeV and MeV are reproduced. It is important to realize that this feature emerges in a natural way from a model for the phase shifts when proper Regge production amplitudes are used. Here for example the part of (1), which already appears in early analysis of scattering data e.g. Kimel and Owens (1977), is essential to the low energy part of the high momentum transfer case.
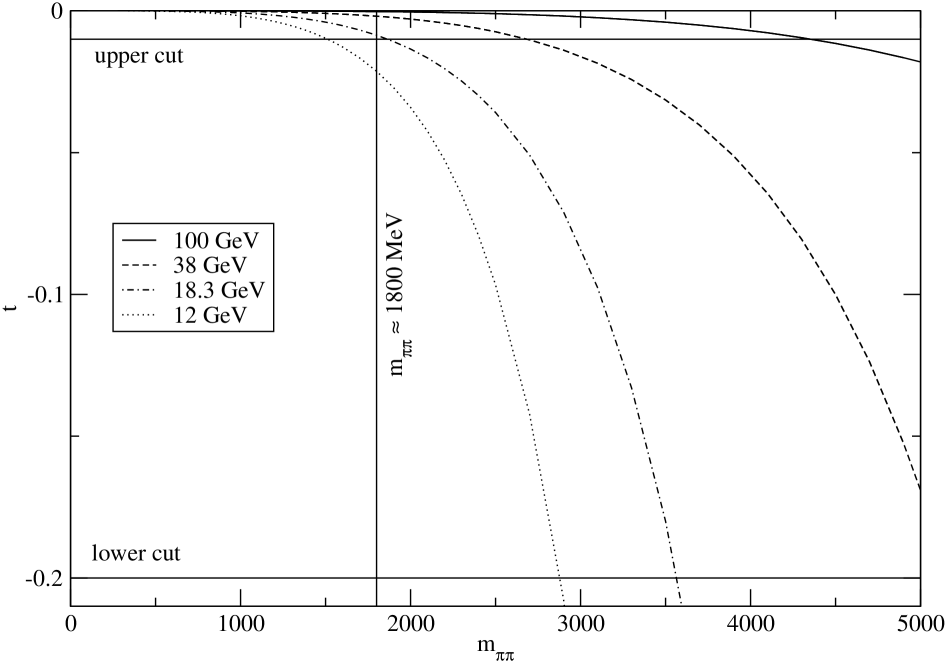
One should further notice that a cross check with data from other experiments with different -binning and beam energy is of course interesting but can only contribute limited information in our case. To arrive at this conclusion let us have a look at the influence of the beam energy on the production. Firstly the beam energy enters as a factor of , which cannot be observed by us, since the data is not normalized. Secondly it enters by limiting the range of the -integration. This is shown in Fig. 4 for several beam energies together with the cut () applied to the momentum transfer in the analysis. One observes that for the beam energies for which experimental data is available, the limits on are essentially determined by the analysis and not by kinematics if one looks at invariant two pion masses below . This is strictly true for the data under consideration here since we do not consider the KEK data which are only available as an extrapolation to the pion pole. This means that below an invariant two pion mass of the data sets should be identical up to an overall scaling.
The invariant mass range to which our model is applicable extends up to at most . This means that the sets of data stemming from different beam energies should be identical in our invariant mass region of interest. Thus we compare the two sets of GAMS data at and at and the BNL Data as is shown in Fig. 5. The upper panel shows the BNL data (filled circles) together with the GAMS data at (crosses) and at (open squares) for the low momentum transfer case . We see that the data sets and our calculations are up to scaling in good agreement. Only the GAMS data deviates in shape from the other two data sets in the invariant two pion mass region and above .
Comparing the sets of data in the case of high momentum transfer is not that easy since BNL only quotes a -binning of whereas GAMS quotes . Nevertheless a comparison might be more rewarding since looking at different -binning means looking at a different ratio of the two production mechanisms. To have at least a common upper limit we join bins for the BNL case to get a momentum transfer range of and plotted it together with the GAMS data and our calculations for both -ranges. Having a common upper limit and knowing that production mainly takes place at low absolute momentum transfers makes this approach justifiable. This comparison is shown in the lower panel of Fig. 5. The data coincide up to from where on they start to deviate strongly. It is tempting to assign the difference to the production in the momentum transfer range and to interpret this as the being a very compact object which can be produced at large momentum transfers. Our calculation shows a different behavior: The BNL data is reasonably well described (solid curve compared to circles), but our model predicts a much too strong production above in the case of the GAMS data. The dashed line is our prediction in the case of the GAMS data which are shown as squares. In the following section we will point out that the BNL and GAMS data are inconsistent and that we are not in a position to judge which one is correct so we also introduce a fit to the GAMS data (dotted line) by just varying the coupling of the -channel to the and thus not changing the low momentum transfer behavior. The good agreement of this second fit to the GAMS data also at other momentum transfers (as can be seen in Fig. 6) demonstrates that our conclusions on the contribution to the stand firm for both sets of data but only the parameters for the admixture of the need to be questioned.

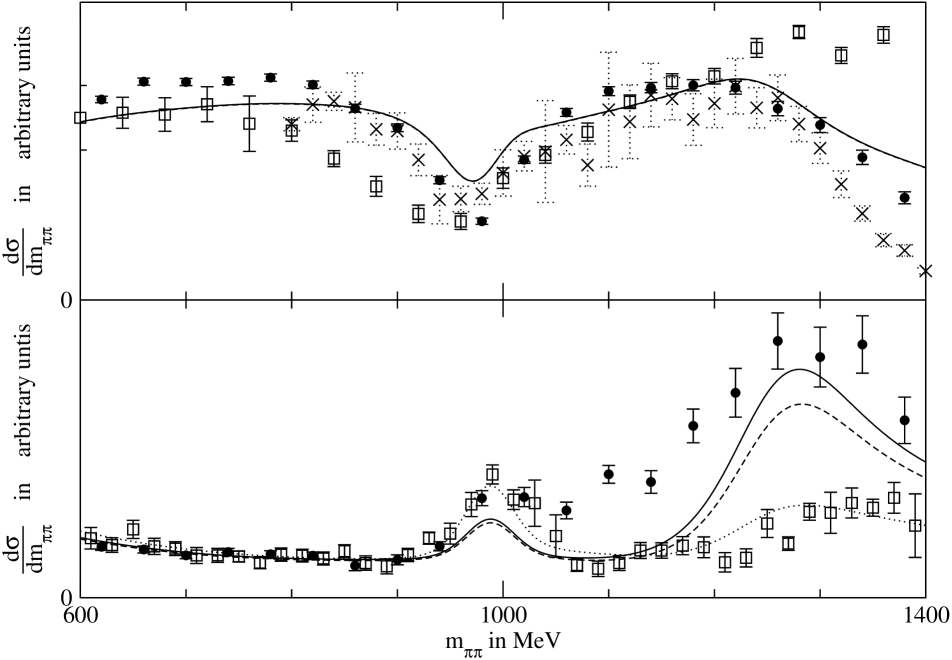
To come to the conclusion that the GAMS and BNL Data are inconsistent we looked at the highest momentum transfer range where data from both GAMS and BNL are available, . We show these data in the upper panel of Fig. 6. The GAMS data needed to be derived from the data published in Alde et al. (1995) by subtracting two sets of data. The resulting errors have been scaled down by a factor of four so that the errors shown here roughly correspond to the spreading of the data. We believe this to be a more realistic estimate of the error. Already at this momentum transfer range the two sets of data start to deviate in shape at about even though they should be identical up to a scaling factor. Our calculation again reproduces the BNL data whereas the GAMS data are overestimated. When using the coupling parameter for the which has been fitted against the high momentum data of GAMS (dotted lines in Fig. 5 & 6) instead of the parameter fitted to the BNL data a good description is achieved, however we find that our model reproduces the -dependence in the data very well, both if we look at the BNL data only or at the GAMS data only. Of course we cannot resolve the discrepancy between the two data sets.
A comparison of our model to the intermediate -range is problematic since our predictions in this case are very sensitive to the slope parameters for and exchange, which in turn cannot be fixed to a sufficient accuracy by the fit to the plot. This problem arises because our predictions strongly depend on the point where the production mechanisms become equally important and this point changes rapidly with the slope parameters. Fitting the data in this case would mean stronger fine tuning of the parameters than would be appropriate for a microscopic model like ours. In the lower panel of Fig. 6 we nevertheless show our results for this momentum transfer range (). In order to demonstrate that there is also a strong variation with the coupling to the we show both the calculation with an as demanded by the BNL data (solid line) as well as the calculation with the which has been fitted to the GAMS data(dotted line). Even though there is no GAMS data available in this momentum transfer range we can infer from the data shown in the upper panel in Fig. 6, which displays a subset of the -range shown the lower panel, that above invariant two pion mass the data points of the GAMS experiment should be lower than the BNL data. Keeping in mind which size of discrepancies has to be expected between the different experiments we conclude that even for the medium momentum transfer range our calculation reproduces the main features of the data as good as one might expect from a microscopic model like ours.
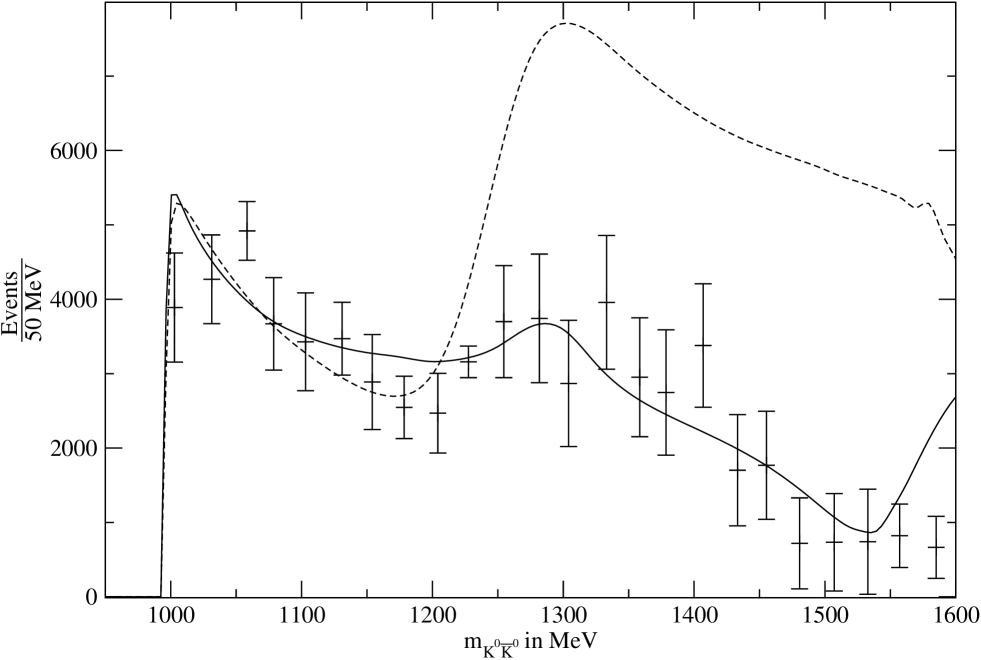
Finally, we compare the results of our model for the reaction with the published dataEtkin et al. (1982). The model works satisfactorily from threshold up to about 1200 MeV. Beyond that energy, our model strongly overestimates the production of neutral kaons (Dashed line in Fig.7). This is understood when comparing our effective couplings to the decays of the and resonances as listed in Hagiwara et al. (2002). We used a strong coupling to the to simulate decays which in reality go to -channels thus naturally overestimating the kaon production. The solid line in Fig.7 shows a version of the model where this shortcoming has been removed by a mock -channel to account for -decays. A good description of the data is obtained even beyond MeV where the partial wave amplitudes are strongly dominated by resonances.
We conclude that the Jülich model which predicts a strong molecule contribution in the can explain the strong dependence of the -wave production on the momentum transfer between the proton and the neutron near MeV by an interference mechanism.
I Acknowledgment
The support of this work by the Deutsche Forschungsgemeinschaft (DFG 447AUS 113/14/0) is gratefully acknowledged.
References
- Amsler (1998) C. Amsler, Rev. Mod. Phys. 70, 1293 (1998), eprint [http://arXiv.org/abs]hep-ex/9708025.
- Amsler (2002) C. Amsler, Phys. Lett. B541, 22 (2002), eprint [http://arXiv.org/abs]hep-ph/0206 104.
- Abele et al. (2001) A. Abele et al. (CRYSTAL BARREL), Eur. Phys. J. C21, 261 (2001).
- Jaffe (1977) R. L. Jaffe, Phys. Rev. D15, 267 (1977).
- Weinstein and Isgur (1990) J. D. Weinstein and N. Isgur, Phys. Rev. D41, 2236 (1990).
- Lohse et al. (1990) D. Lohse, J. W. Durso, K. Holinde, and J. Speth, Nucl. Phys. A516, 513 (1990).
- Barnes (1985) T. Barnes, Phys. Lett. B165, 434 (1985).
- Pichowsky et al. (2001) M. A. Pichowsky, A. Szczepaniak, and J. T. Londergan, Phys. Rev. D64, 036009 (2001), eprint [http://arXiv.org/abs]nucl-th/0101036.
- Oller et al. (1998) J. A. Oller, E. Oset, and J. R. Pelaez, Phys. Rev. Lett. 80, 3452 (1998), eprint [http://arXiv.org/abs]hep-ph/9803242.
- Achasov and Shestakov (1998) N. N. Achasov and G. N. Shestakov, Phys. Rev. D58, 054011 (1998), eprint [http://arXiv.org/abs]hep-ph/9802286.
- Gunter et al. (2001) J. Gunter et al. (E852), Phys. Rev. D64, 072003 (2001), eprint [http://arXiv.org/abs]hep-ex/0001038.
- Alde et al. (1995) D. Alde et al. (GAMS), Z. Phys. C66, 375 (1995).
- Klempt (2000) E. Klempt (2000), eprint [http://arXiv.org/abs]hep-ex/0101031.
- Kondashov (1999) A. A. Kondashov, Nucl. Phys. Proc. Suppl. 74, 180 (1999), eprint [http://arXiv.org/abs]hep-ph/9811207.
- Anisovich et al. (1995) V. V. Anisovich, A. V. Sarantsev, A. A. Kondashov, Y. D. Prokoshkin, and S. A. Sadovsky, Phys. Lett. B355, 363 (1995).
- Anisovich (2002) V. V. Anisovich (2002), eprint [http://arXiv.org/abs]hep-ph/0208123.
- Kaminski et al. (1997) R. Kaminski, L. Lesniak, and B. Loiseau, Phys. Lett. B413, 130 (1997), eprint [http://arXiv.org/abs]hep-ph/9707377.
- Krehl et al. (1997) O. Krehl, R. Rapp, and J. Speth, Phys. Lett. B390, 23 (1997), eprint [http://arXiv.org/abs]nucl-th/9609013.
- Blankenbecler and Sugar (1966) R. Blankenbecler and R. Sugar, Phys. Rev. 142, 1051 (1966).
- Wess and Zumino (1967) J. Wess and B. Zumino, Phys. Rev. 163, 1727 (1967).
- Kaminski et al. (2002) R. Kaminski, L. Lesniak, and K. Rybicki, Eur. Phys. J. direct C4, 4 (2002), eprint [http://arXiv.org/abs]hep-ph/0109268.
- Kimel and Owens (1977) J. Kimel and J. Owens, Nucl. Phys. B122, 464 (1977).
- Alde et al. (1998) D. Alde et al. (GAMS), Eur. Phys. J. A3, 361 (1998).
- Etkin et al. (1982) A. Etkin et al., Phys. Rev. D25, 1786 (1982).
- Hagiwara et al. (2002) K. Hagiwara et al. (Particle Data Group), Phys. Rev. D66, 010001 (2002).