DFUB 15/2002
Bologna 12/11/2002
MACRO results on atmospheric neutrino oscillations
Y. Becherini for the MACRO collaboration
Physics Department, University of Bologna and INFN,
viale C. Berti Pichat 6/2,
I-40127 Bologna, Italy
Yvonne.Becherini@bo.infn.it
Proceedings for the International School of Physics “Enrico Fermi”,
CLII course “Neutrino Physics”,
Varenna, Italy, 23 July - 2 August 2002.
Abstract
In this paper I shall resume the results of the MACRO experiment on atmospheric muon neutrino oscillations.
1 Atmospheric neutrinos and MACRO
A high energy primary cosmic ray interacts in the upper atmosphere producing a large number of pions and kaons, which decay yielding muons and muon neutrinos; the muons decay generating muon and electron neutrinos. These neutrinos are produced in a spherical shell at km above ground and travel towards the Earth. The can be detected by an underground experiment as muons, after their charged current interactions with the material inside or outside the detector ().
MACRO was a large area multipurpose underground experiment optimized to search for rare events in the cosmic radiation. The detector was located in the Gran Sasso laboratory, which is well shielded from downgoing cosmic ray muons by a mean rock thickness of 3700 m.w.e.. MACRO was composed of three sub-detectors: liquid scintillation counters for energy and T.O.F. measurements, limited streamer tubes for particle tracking and nuclear track detectors for magnetic monopoles and nuclearites searches. It had a modular structure: it was divided into six sections referred to as supermodules, each of which had a size of m3. A cross section of the detector is shown in Fig. 1 on the left, with the different event topologies of interactions in or around the detector: Internal Upgoing (IU), Upgoing Stopping (UGS) and Internal Downgoing (ID), and Up throughgoing muons. Data were taken from March 1989 till April 1994 with the detector under construction and from the middle of 1994 till the end of 2000 with the full detector.
2 Neutrino oscillations analysis
Neutrino oscillations. In the simple case of only two neutrinos with flavour eigenstates the survival probability of a pure beam is:
| (1) |
where is the oscillation probability, is the mixing angle, () are the mass eigenstates, (eV2), (km) is the distance travelled by the neutrino from the production point to the detection point, and (GeV) the neutrino energy.

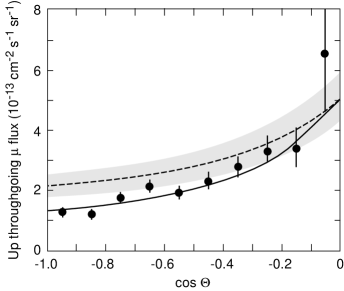
Up throughgoing muons. The up throughgoing muons come from interactions below the detector. These neutrinos have an average energy of GeV [1],[2]. The data (6.16 years of livetime) deviate in absolute value and in zenith angle distribution from Monte Carlo (MC) predictions without oscillations, see Fig. 1 on the right. Fig. 2 upper left shows the allowed region for oscillations in the plane, computed according to [3] for the up throughgoing muon events; our allowed region is compared with those obtained by the SuperKamiokande (SK) [3] and Soudan 2 [4] experiments.
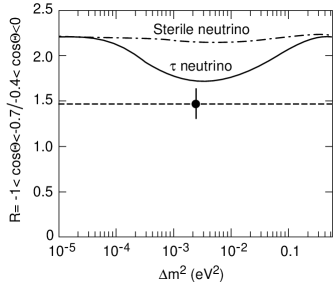
Matter effects due to the difference between the weak interaction effective potential for muon neutrinos with respect to sterile neutrinos would produce a different total number and a different zenith distribution of up throughgoing muons [6]. In Fig. 2 on the upper right the measured ratio between the nearly vertical events with and the horizontal events with is shown as a black point. In this measurement most of the theoretical uncertainties on neutrino flux and cross section cancel. The remaining theoretical error combined with the experimental error is estimated to be . We measured 305 events with and 206 with ; the ratio is R = . For and maximal mixing, the expected value of the ratio for is while for is . oscillations are disfavoured at 99% c.l. compared to the channel [2], [5].
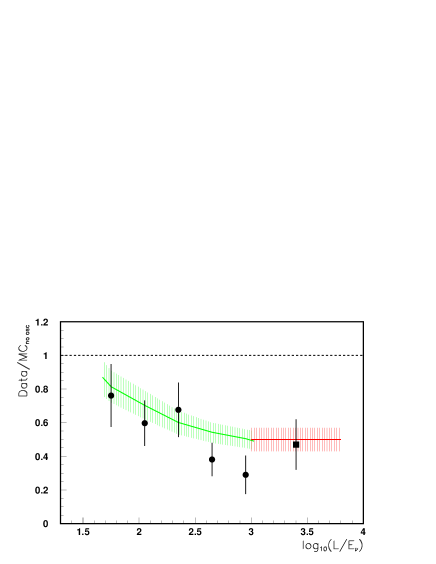
The oscillation probability is a function of the ratio , see Eq. 1. In MACRO the neutrino energy was estimated for each event by measuring the muon energy , via Multiple Coulomb Scattering (MCS) of the induced muon in the horizontal absorbers in the lower MACRO (Fig. 1, left). The r.m.s. of the lateral displacement for a muon crossing the apparatus on the vertical is cm / (GeV). A first analysis was made studying the deflection of up throughgoing muons with the streamer tubes in “digital mode”. This method could reach a spatial resolution of which implies a maximum measurable energy of 10 GeV [6]. To improve the spatial resolution of the detector, a second analysis was performed with the streamer tubes used in “drift mode” and the resolution achieved was . The method allowed the separation of the up throughgoing muons in 4 subsamples corresponding to average neutrino energies of 12, 20, 50 and 102 GeV, respectively. The comparison of the 4 zenith angle distributions with the predictions of the no oscillations MC shows a disagreement at low energies, while the agreement is restored at the higher neutrino energies. The distribution of the ratios obtained by this analysis is plotted in Fig. 2 in the lower part as a function of [7].
Low energy muons. An analysis was done also for the lower energy samples. These low energy muons come from neutrinos which have an average energy of GeV [8]. The Internal Upgoing (IU) muons come from interactions in the lower apparatus; for these events two scintillation counters are intercepted; the T.O.F. is applied to identify upward going muons.

The upgoing stopping muons (UGS) are due to external interactions yielding upgoing muons stopping in the detector. The internal downgoing muons (ID) are due to -induced downgoing muon tracks with vertex in the lower MACRO, see Fig. 1 on the left. A summary table of the number of events is presented with MC predictions in Table 1. The data show a uniform deficit for the whole angular distribution with respect to predictions, for IU, 75% for ID + UGS; there is a good agreement with the predictions based on neutrino oscillations with the parameters obtained from the up throughgoing muons. The average value of the double ratio over the measured zenith angle range is ; the error includes statistical and theoretical uncertainties; is expected in case of no oscillations.
In conclusion, MACRO atmospheric neutrino flux analysis gives strong evidence to the oscillation hypothesis, with eV2 and maximal mixing.
| Events | MC-No oscillations | ||
|---|---|---|---|
| Up throughgoing | |||
| Internal Up | |||
| Up Stop + In Down | 262 |
I thank the members of the MACRO collaboration, in particular G. Giacomelli and M. Spurio.
References
- [1] M. Ambrosio et al., Phys. Lett. B 357 (1995) 481; 434 (1998) 451.
- [2] M. Ambrosio et al., hep-ex/0206027.
- [3] SK Coll., Y. Fukuda et al., Phys. Rev. Lett. 81 (1998)1562; 85 (2000) 3999; hep-ex/0105023.
- [4] Soudan 2 Coll., W.W.M. Allison et al., Phys. Lett. B 449 (1999) 137.
- [5] M. Ambrosio et al., Phys. Lett. B 517 (2001) 59.
- [6] D. Bakari et al., hep-ex/0105087.
- [7] The MACRO collaboration, NIM A 492 (2002) 376.
- [8] M. Ambrosio et al., Phys. Lett. B 478 (2000) 5 and hep-ex/0110021.