New Experimental Constraints on Non-Newtonian Forces below m
Abstract
We have searched for large deviations from Newtonian gravity by means of a finite-frequency microcantilever-based experiment. Our data eliminate from consideration mechanisms of deviation that posit strengths times Newtonian gravity at length scales of m. This measurement is 3 orders of magnitude more sensitive than others that provide constraints at similar length scales.
pacs:
04.80.CcPhysics beyond the standard model will be explored at the Large Hadron Collider in a few years, but gravitational measurements at small length scales are capable of investigating this region now. These measurements become particularly important in light of recent theoretical developments. Moduli, massive scalar particles that could mediate forces with strengths possibly times Newtonian gravity, could have Compton wavelengths in the range of m– mm. These particles would manifest themselves as strong gravitylike forces. The hierarchy problem, the seeming disparity ( orders of magnitude) between the standard model energy scale and the Planck scale, suggests other reasons to study this regime. This problem can be recast by asking why gravity is so weak compared to the other known forces in nature. Recent theoretical work add suggests that extra spatial dimensions, possibly as large as mm and accessible only to gravitons, may supply a solution. Because of spreading into the extra dimensions, gravity would be diluted compared to the other forces, and therefore would seem quite weak. As gravity has not been well tested below the centimeter scale until recently adel ; review , there are many reasons to investigate gravitylike forces at length scales of m.
Exotic massive scalar particles would modify the standard Newtonian potential with an additional Yukawa-type term scalar . A similar correction would exist for observation of gravity at length scales roughly the size of any compactified extra dimensions add . This leads to the following equation for the gravitational potential in the presence of such non-Newtonian effects:
| (1) |
Here is Newton’s constant, and are the masses, is the center of mass separation, and is the strength (relative to Newtonian) of any new effect with a length scale of . Non-Newtonian effects are typically parameterized in terms of and .
In this Letter we present data obtained for attracting-mass surface separations down to m, enabling investigation of interaction scales below m.
The experiment is reminiscent of torsion pendulum gravity measurements, though an ac drive force is employed, and the masses are much smaller. In place of the typical torsional fiber force sensor, a microcantilever was used. A mass attached to this cantilever was subjected to a time-varying force of a gravitational type, and the deflection of the cantilever (measured using fiber-optic interferometry rugar ) provided a measure of this force. The experiment was performed at low temperature and in cryogenic vacuum to exploit the high quality factors attainable in microcantilevers under these conditions.
The force sensors for these experiments were single-crystal silicon diving-board-shaped oscillators m in length, m in width, and m thick. The cantilevers were fabricated using standard micromachining techniques atto and have quality factors in the range (in vacuum). Spring constants of these sensors were – mN/m, and the resonant frequency of the lowest flexural mode of the cantilever was shifted from Hz to Hz upon mass attachment.
Microcantilever sensitivity is usually limited by thermal noise, i.e., Brownian motion of the beam. This noise limit, analogous to the Johnson noise in a resistor, can be used to obtain the minimum detectable force of a cantilever: . Here is the Boltzmann constant, is the temperature, is the spring constant, is the resonant frequency (rad/s), is the quality factor, and is the measurement bandwidth. The typical force sensitivity for these (thermal noise limited) measurements was N/. With averaging times of a few hours, the present devices could reach an ultimate sensitivity below N ( times the expected Newtonian gravitational force).
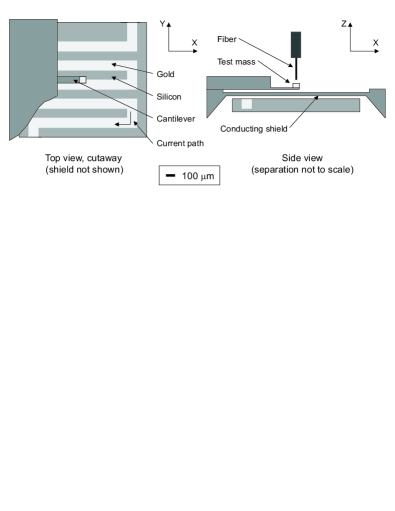
The force measured was that between a mass placed on the end of the cantilever (the test mass) and a larger mass oscillated a small distance away (the drive mass). The test masses were gold rectangular prisms, m3 in size and g in mass, and were attached to the cantilevers with a thin (typically m) layer of epoxy. The drive mass was constructed of ten bars: five gold bars alternating with five silicon bars. Each bar was mm long. (See Fig. 1 for schematic representation.) This construction, when oscillated in the plane of the drive mass and perpendicular to the direction of the long dimension of the bars, is expected to gravitationally excite the test mass at a harmonic of the oscillation frequency. This shift of the gravitational signal frequency with respect to that of the drive mass oscillation helped prevent spurious excitation of the cantilever due to unwanted vibration at the signal frequency.
To test the system and precisely align the drive mass with the test mass on the cantilever, as well as to provide an in situ equivalent measurement, a magnetic analog of the gravitational experiment was used. The gold bars in the drive mass were connected electrically at alternating ends (see Fig. 1) to form a meander. When a dc electric current is driven through the path defined by the gold bars and their interconnects, a space-varying magnetic field (with a spatial periodicity half that of the gravitational response) is created above the drive mass. This field couples to the test mass through an evaporated layer of nickel on the test-mass surface closest to the drive mass. The oscillation of the drive mass creates a time-varying magnetic field at the location of this layer. A signal proportional to current through the meander verifies the system’s functionality.
To fabricate drive and test masses, bulk silicon was etched to form a mold into which gold was evaporated. After evaporation, the mold was ground and polished. In the case of the test masses, the silicon was then dissolved to release the gold prisms (for fabrication details, see our_rsi ).
The oscillation of the drive mass beneath the test mass was facilitated by attachment of the drive mass to the free end of a clamped piezoelectric bimorph actuator. The actuator was mm thick and mm wide and had a free length of mm.
The actuator’s motion was characterized ex situ using a laser beam-bounce method. In the experimental probe, the actuator’s motion was measured capacitively using a calibration obtained from this initial characterization. The actuator’s drive frequency was tuned to one-third of the cantilever resonant frequency by means of magnetic excitation. The amplitude of actuator motion was 987 m. Finite element calculations were performed to determine the expected Newtonian and non-Newtonian response of the test mass.
The nonlinearity in the piezoelectric actuator caused a small amount () of actuator vibration at the cantilever resonance (the third harmonic of the actuator frequency) and could lead to a spurious signal. Therefore, two mass-spring vibration isolation stages separated the cantilever mount from the actuator mount. Each stage had a resonant frequency of Hz for both vertical and horizontal motion, and thus together the stages provided an attenuation of at Hz between the mounts.
A stiff metallized shield was placed between the drive and test masses to minimize the effects of electrostatic and Casimir forces by preventing direct ac coupling between the masses. The shield was a mm by mm silicon-nitride membrane m thick onto both sides of which was evaporated nm of gold. Supported by a 1 cm2 silicon wafer die, the shield was attached to the cantilever wafer m from the cantilever.
The vertical and in-plane relative displacements of the test and drive masses were determined by means of a capacitive position sensor (CPS) similar to that described in field_cps . Two simpler capacitors, in conjunction with the CPS, provided measurement of relative tilt. After cooling, the position was adjusted until the original capacitive readings were regained, using a three-axis translation stage. Because of the drive mass geometry, the position in (the direction along the drive mass bars) need only be determined to an accuracy of m. In the direction, greater precision was required as the gravitational response was expected to vary by % over 50 m in . The CPS enabled determination of relative position in this direction to m. The tilt was adjusted by differential heating of the upper vibration isolation stage support springs.
After lateral realignment, an absolute value of the vertical separation between the masses was determined by means of direct mechanical contact (sensed by the cantilever) between the drive mass and the shield. Subsequent motion away from the shield was measured with the CPS, and the separation between the masses was thus known to an accuracy of m.
The cantilever, actuator, and vibration isolation stages were suspended in a vacuum can at the end of a probe that was inserted into a liquid helium research dewar. An exchange gas space separated the inner vacuum can from the liquid helium in order to reduce external vibrations due to helium boiloff. The entire system was supported by m long Hz springs for additional isolation. The experiments were performed at – K, and at gas pressures of less than torr (room temperature reading) with further cryopumping while cold.
The sinusoidal actuator voltage and the cantilever displacement signal were sampled and stored simultaneously at kHz using an analog-to-digital converter. The displacement data stream was then sorted into bins using the phase of the actuator drive voltage and averaged by actuator phase. As the actuator phase is a measure of the lateral position of the drive mass, this technique is similar to a lock-in technique in that signals that are not phase coherent with the actuator drive signal are rejected.
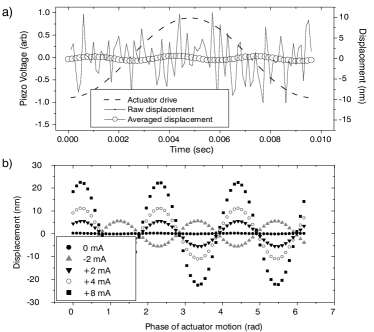
The third harmonic of the Fourier transform of the averaged data is the motion of the cantilever that is phase correlated with the third harmonic of the drive mass motion, i.e., the gravitational-like response of the test mass [see Fig. 2(a)]. Using the spring constant and the measured quality factor of the cantilever, the force on the test mass due to the drive mass can be determined.
Data were collected as a function of drive mass meander current and position in order to align the drive mass to the test mass. Figure 2(b) shows data for one period of the drive mass actuator motion as a function of drive mass meander current. The phase of the magnetic response changes by as the current is changed from negative to positive. Also present is a small asymmetry in the magnitude of the magnetic signal for positive and negative values of the nominally same current magnitude. The observed zero-current signal adds phasewise to the signal for a particular current, producing this asymmetry.
The third harmonic of two sets of data acquired over sec and averaged as a function of measurement time is plotted in Fig. 3 ( for these data). Also plotted is a line representing the theoretical thermal noise of the cantilever. Data taken while the actuator was oscillating far from the test mass match the theoretical curve within error footnote1 and imply that the dominant experimental noise is thermal in nature. (Note that the theoretical curve depends on experimental parameters.) Data taken with the drive mass oscillating and in close proximity to the test mass show a signal that clearly is not diminished with averaging and is patently above the thermal noise. According to finite-element calculations yielding an expected gravitational response of 4.0 N, this anomalous signal is too large (by a factor of ) to be of Newtonian origin. Within experimental error, the magnitude of the signal (relative to the actuator drive) as a function of -direction offset is not consistent with a mass-dependent force.
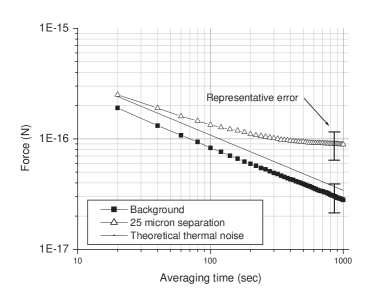
These data lead to the conclusion that the experiment’s force resolution is presently limited by an environmental effect, most likely an electrostatic interaction between the shield and the cantilever as discussed below. While the shield prevents direct coupling of this sort between the masses, a secondary effect due to shield motion could spuriously drive the cantilever. Other possible non-mass-dependent effects are too small to appear at this level. For instance, randomly quenched magnetic impurities in the gold of the drive mass produce a moment that would result in a force below the level of Newtonian gravity, and coordinated pressure variations in the ballistic, residual gas in the probe are similarly small.
Shield motion was characterized (using the fiber interferometer) under standard experimental conditions. The response was not sensitive to the current through the drive mass meander or relative mass position. With the actuator swinging its full amplitude, the shield motion at the first harmonic was pm. The signal at the third harmonic was an order of magnitude less.
Motion of the membrane could drive the cantilever by creating an ac Casimir force. An upper bound can be calculated assuming the cantilever is a conductor and using the Casimir result casimirp for two conducting planes (force per unit area), . For pm of motion of the shield, the oscillatory force is on the order of N, much less than the thermal noise of the cantilever for experimental measurement times.
The motion of the membrane could also induce cantilever motion if there were a significant potential difference between the metallized top of the shield and the cantilever. Making a worst-case assumption of two parallel plates with an area the size of the cantilever, a voltage difference V would produce a force on the cantilever of N. Potentials of this size have been observed in other experiments stipe , and we cannot yet exclude the possibility that such a force currently limits our experimental sensitivity. Shield motion was most likely due to inhomogeneities in the drive mass surface caused by the use of electrically dissimilar materials. The design of upcoming experiments contains insulating and conducting layers above the drive mass bars; the conducting layer will shield the effect of any drive mass surface variations.
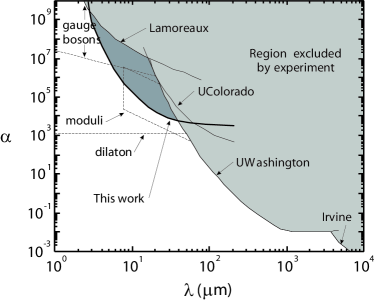
The existence of a spurious force of average magnitude N allows calculation of an upper limit on the magnitude of any gravitylike force. Figure 4 displays the region of non-Newtonian interaction strength versus interaction distance parameter space that can be excluded by these results footnote2 , as well as other current experimental bounds. For a length scale of m, the present data improve constraints on the strength of non-Newtonian effects by orders of magnitude. The region eliminated is an important one, as it contains previously unexplored space for scalar moduli particles.
We have presented results from a search for gravitylike deviations from Newtonian theory at distance scales below m using a microcantilever approach, with masses of size on the order of these scales. Our data offer a new limit on non-Newtonian effects in the range of m, constraining theoretical predictions of moduli.
We thank Thomas Kenny and Savas Dimopoulos for useful discussions. J.C. and D.M.W. thank DoD for support. S.J.S. thanks NSF for support. This work made use of the National Nanofabrication Users Network facilities supported by the National Science Foundation under Award No. ECS-9731294.
Note added.—After submission of this manuscript, results for larger length scales were published from a similar experiment at the University of Colorado pricenature .
References
- (1) N. Arkani-Hamed, S. Dimopoulos, and G. Dvali, Phys. Rev. D 59, 086004 (1999).
- (2) C. D. Hoyle et al., Phys. Rev. Lett. 86, 1418 (2001).
- (3) For a review, see, e.g., J.C. Long et al., Nucl. Phys. B539, 23 (1999) or E. Fischbach et al., Phys. Rev. D 64, 075010 (2001).
- (4) S. Dimopoulos and G. F. Giudice, Phys. Lett. B 379, 105 (1996).
- (5) D. Rugar, H. J. Mamin, and P. Guethner, Appl. Phys. Lett. 55, 2588 (1989).
- (6) T. D. Stowe et al., Appl. Phys. Lett. 71, 288 (1997).
- (7) J. Chiaverini et al. (unpublished).
- (8) S. B. Field and J. Barentine, Rev. Sci. Instrum. 71, 2603 (2000).
- (9) The error displayed in Fig. 3 is the sum of the following errors in quadrature: voltage measurement, 2%; laser wavelength, 0.1%; interferometer fringe size, 5%; quality factor, 10%; fiber position, 5%; and spring constant, 10%.
- (10) H. B. G. Casimir, Proc. K. Ned. Akad. Wet. 51, 793 (1948).
- (11) B. C. Stipe et al., Phys. Rev. Lett. 87, 096801 (2001).
- (12) S. K. Lamoreaux, Phys. Rev. Lett. 78, 5 (1997).
- (13) J. C. Long, A. B. Churnside, and J. C. Price, hep-ph/0009062.
- (14) J. K. Hoskins et al., Phys. Rev. D 32, 3084 (1985).
- (15) D. B. Kaplan and M. B. Wise, J. High Energy Phys. 08, 037 (2000).
- (16) S. Dimopoulos (unpublished).
- (17) The error used in this determination is the sum of the following errors in quadrature propagated through Eq. (1) for each value of : mass-to-mass distance, 4%; actuator amplitude, 7%; gold density, 3%; silicon density, 1%; test and drive mass lateral dimensions, 2% and 1%; test and drive mass thickness, 5% and 3%.
- (18) J. C. Long et al., Nature (London) 421, 922 (2003).