Microscopic modelling of defects production and their annealing after irradiation in silicon for HEP particle detectors
Abstract
In this contribution, the production of defects in radiation fields and their evolution toward equilibrium in silicon for detector uses has been modelled. In the quantitative model developed, the generation rate of primary defects is calculated starting from the projectile - silicon interaction and from recoil energy redistribution in the lattice. Vacancy-interstitial annihilation, interstitial migration to sinks, divacancy and vacancy-impurity complex (, , , and ) formation are considered.
The results of the model support the experimental available data.
The correlation between the initial material parameters, temperature, irradiation and annealing history is established. The model predictions could be a useful clue in obtaining harder materials for detectors at the new generation of accelerators or for space missions.
PACS:
61.80.Az: Theory and models of radiation effects.
61.70.At: Defects formation and annealing processes.
29.40.Pe: Semiconductor detectors.
keywords:
radiation damage, bulk defects, defect concentrations, kinetics of defects, annealing processes., and
1 Introduction
Silicon is the most used semiconductor material for detectors in particle physics experiments. The principal obstacles to long term operation in the extreme radiation conditions are the changes in detector parameters, consequence of the modifications in material properties during and after irradiation, ultimately related to the defects induced this way in the lattice.
A point defect in a crystal is an entity that causes an interruption in the lattice periodicity. In this paper, the terminology and definitions in agreement with M. Lannoo and J. Bourgoin [1] are used in relation to defects.
We denote the displacement defects, vacancies and interstitials, as primary point defects, prior to any further rearrangement.
The microscopic model developed in this contribution is able to explain quantitatively, without free parameters, the production of primary defects in silicon, and their evolution toward equilibrium because in silicon, these defects are essentially unstable and interact via migration, recombination, and annihilation or produce other defects.
The generation rate of primary defects is considered in a large range of values, and is calculated starting from the projectile - silicon nucleus interaction, and from the analytical extensions of the Lindhard theory [2].
Silicon used for detectors in high energy physics is n-type high resistivity () phosphorus doped FZ material. The concentrations of interstitial oxygen and substitutional carbon in silicon are strongly dependent on the growth technique. In high purity Float Zone Si, oxygen interstitial concentrations are around cm-3, while in Czochralski Si these concentrations can reach values as high as cm-3. Because Czochralski silicon is not available in detector grade quality, an oxygenation technique developed at BNL produces Diffusion Oxygenated Float Zone in silicon, obtaining a concentration of the order cm-3. These materials can be enriched in substitutional carbon up to [C cm-3.
Vacancy-interstitial annihilation, interstitial migration to sinks, divacancy and vacancy-impurity complex (, , , and ) formation are considered.
Model predictions are compared with experimental data.
The correlation between the initial material parameters, temperature, irradiation and annealing history is established.
2 Production of primary defects and their kinetics
The basic assumption of the present model is that the primary defects, vacancies and interstitials, are produced in equal quantities and are uniformly distributed in the material bulk. They are produced by the incoming particle, or as a consequence of the subsequent collisions of the primary recoil in the lattice.
Prior to the irradiation process, in silicon there are thermally generated defects (only Frenkel pairs are considered).
After the irradiation, the following stable defects have been identified in silicon (see References [1, 3]): , , , , , , and .
The pre-existing thermal defects and those produced by irradiation, as well as the impurities, are assumed to be randomly distributed in the solid. An important part of the vacancies and interstitials annihilate. The sample contains certain concentrations of impurities, which can trap interstitials and vacancies respectively, and form stable defects.
Vacancy-interstitial annihilation, interstitial migration to sinks, divacancy, vacancy and interstitial impurity complex formation are considered. The role of phosphorus, oxygen and carbon is taken into account, and the following stable defects: , , , , , and are considered. Other possible defects as , , [4], are not included in the present model.
The following picture describes in terms of chemical reactions the mechanisms of production and evolution of the defects considered in the present paper:
| (1) |
| (2) |
| (3) |
is the centre.
| (4) |
is the centre.
| (5) |
| (6) |
| (7) |
| (8) |
| (9) |
| (10) |
The reaction constants (i = 1, ) have the general form:
| (11) |
with the vibration frequency of the lattice, the associated activation energy and a numerical constant that accounts for the symmetry of the defect in the lattice.
The reaction constant related to the migration of interstitials to sinks could be expressed as:
| (12) |
with the sink concentration and the jump distance.
The system of coupled differential equations corresponding to the reaction scheme (1) (10) cannot be solved analytically and a numerical procedure was used.
The following values of the parameters have been used: = = 0.4 eV, = 0.8 eV, = 1.4 eV, = 1.1 eV, = 1.3 eV, = 1.6 eV, = 1.7 eV, = 1013 Hz, = 1015 cm2, = 1010 cm-2.
The generation term is the sum of two components:
| (13) |
where accounts for the generation by irradiation, and for thermal generation.
The concentration of the primary radiation induced defects per unit fluence () in silicon has been calculated using the explicit formula (see details, e.g. in references [5, 6]):
| (14) |
where is the kinetic energy of the incident particle, is the atomic density in silicon, is the silicon atomic number, - the average threshold energy for displacements in the semiconductor, - the recoil energy of the residual nucleus produced in interaction , - the Lindhard factor that describes the partition of the recoil energy between ionisation and displacements and - the differential cross section of the interaction between the incident particle and the nucleus of the lattice for the process or mechanism , responsible in defect production. is Avogadro’s number. The formula gives also the relation with the non ionising energy loss ().
Due to the important weight of annealing processes, as well as to their very short time scale, is not a measurable physical quantity.
If the anisotropy of the silicon lattice is not considered, the simplifying hypothesis of random distribution of for all particles could be introduced: the identity of the particle is lost after the primary interaction, and two different particles could produce the same generation rate () of vacancy-interstitial pairs if the following condition:
| (15) |
is fulfilled. Here, is the flux of particles () and () respectively, and and their corresponding kinetic energies.
3 Results and discussion
3.1 Comparison between model predictions and experimental data
The model predictions have been compared with experimental measurements. A difficulty in this comparison is the insufficient information in published papers regarding the characterisation of silicon, and the irradiation parameters and conditions for most of the data.
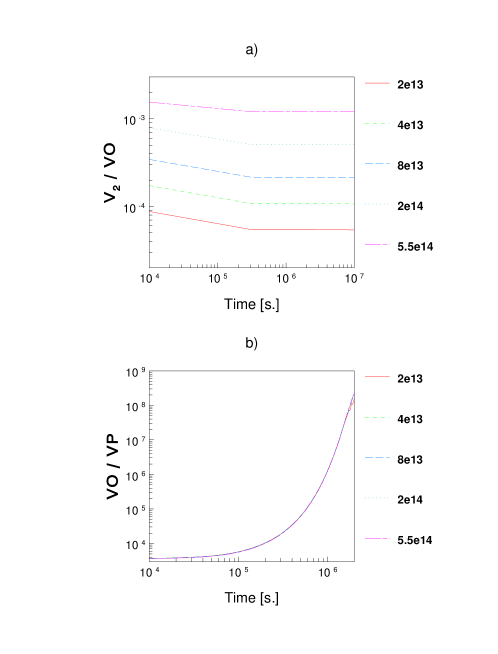
It was underlined in the literature [7] that the ratio of to centres in electron irradiated silicon is proportional to the ratio between the concentrations of oxygen and phosphorus in the sample. For electron irradiation, in Reference [8] a linear dependence of the versus centre concentration has been found experimentally. In the present paper, the ratios of concentrations of to centres and to ones has been calculated respectively in the frame of the model, for the material with the characteristics specified in Reference [8], and irradiated with 12 MeV electrons, in the conditions of the above mentioned article. The time dependence of these two ratios is represented in Figures 1a and 1b; annealing is considered both during and after irradiation. It could be seen that for the ratio of and concentrations, the curves corresponding to different irradiation fluences are parallel, while the ratio of to concentrations is fluence independent, in the interval cm-2, in good agreement with the experimental evidence. The ratio between and concentrations is determined by the generation of primary defects by irradiation, while the ratio between and concentrations is determined by the concentrations of oxygen and phosphorus in silicon.
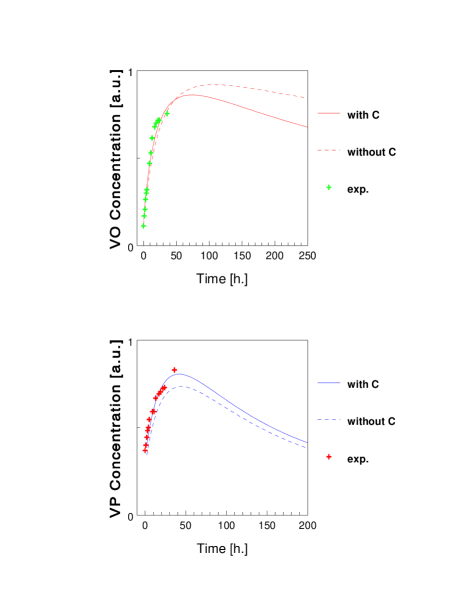
Our estimations are also in agreement with the measurements presented in reference [9], after electron irradiation, where defect concentrations are presented as a function of the time after irradiation. In Figure 2, both measured and calculated dependencies of the and concentrations are given. The irradiation was performed with 2.5 MeV electrons, up to a fluence of cm-2. The dependencies put in evidence the important role played by the carbon-related defects. The relative values are imposed by the arbitrary units of experimental data.
A good agreement has also been obtained between the absolute values of concentrations of and centres predicted by the model, and the experimental results after 1 MeV neutron irradiation at a total fluence of cm-2, reported in reference [10]. The calculated cm-3 and cm-3 concentrations for and respectively, are in accord with the values of cm-3 and cm-3 , measured experimentally. For the concentration, a poorer concordance has been obtained.
The formation and time evolution of stable defects depends on various factors, e.g. the concentrations of impurities pre-existent in the sample, the rate of generation, and the temperature and the irradiation history.
3.2 The variation of the concentration of stable defects in respect to the irradiation rate and the influence of oxygen
The effect of oxygen in irradiated silicon has been a subject of intensive studies in remote past. In the last decade a lot of studies have been performed to investigate the influence of different impurities, especially oxygen and carbon, as possible ways to enhance the radiation hardness of silicon for detectors in the future generation of experiments in high energy physics - see, e.g. references [11, 12]. Some authors consider that these impurities added to the silicon bulk modify the formation of electrically active defects, thus controlling the macroscopic device parameters. Empirically, it is considered that if the silicon is enriched in oxygen, the capture of radiation-generated vacancies is favoured by the production of the pseudo-acceptor complex vacancy-oxygen. Interstitial oxygen acts as a sink for vacancies, thus reducing the probability of formation of the divacancy related complexes, associated with deeper levels inside the gap.
Two types of silicon have been considered in the model calculations: ”standard” material, with the following doping concentrations: cm-3 phosphorous content, cm-3 oxygen, and cm-3 carbon, and ”oxygenated” material, with the same concentrations of phosphorous and carbon, but with 200 higher oxygen content, cm-3 .
These two types of materials are considered to be exposed to continuous irradiation, with varying from pairs/s, to 50 pairs/s, from half to half order of magnitude, at 20oC, during 10 years.
Thermal generation has been considered each time in the calculations. The results are illustrated in Figure 3.
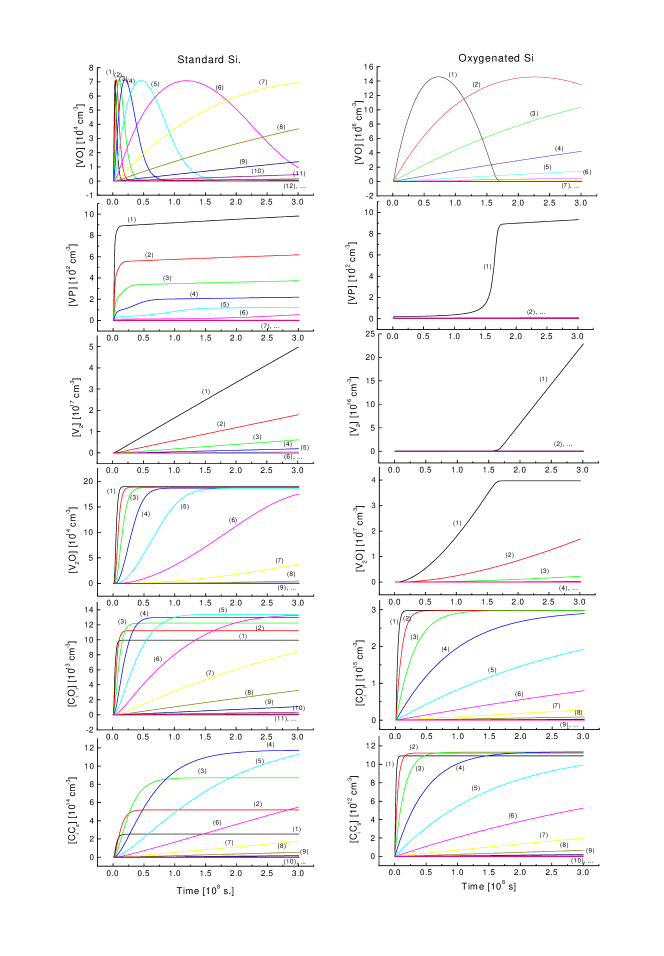
The highest generation rate corresponds here to a value 10 times higher than that estimated for the forward position in the tracker silicon detector at the new LHC hadron accelerator (determined from integration over the energy range of interest of the convoluted function between simulated hadron flux spectra [13] and the ), while the smallest generation rate corresponds to a value 10 times smaller than the rate produced by protons from cosmic rays, in an orbit near the Earth, at about 380 Km, as measured by the AMS Collaboration [14].
It could be seen that the presence of oxygen slows down the formation of all defects related to oxygen and vacancy, i.e. , , , and , and increases the rate of formation of centres. It could also be observed that the highest concentrations attained by the centres during this period, as well as those corresponding to the ones increase, from ”standard” to ”oxygenated” silicon, in the same ratio as the corresponding oxygen content. Because the process of formation of both divacancies and centres is, in an important measure, slowed down in oxygenated silicon, and the maximum values of divacancy concentrations are reduced with the increase of oxygen concentration, the generation current in the depleted regions of p-n junction detectors could be decreased by oxygen addition, especially at smaller rates than those associated with curves (1).
3.3 The effect of the temperature
Both ”standard” and ”oxygenated” silicon are considered to be exposed to similar continuous irradiations, characterised by a generation rate pairs/s, during ten years, at temperatures between -20oC and 20oC. Thermal generation has been considered for each temperature. The results are represented in Figure 4 for the concentrations of , and centres respectively.
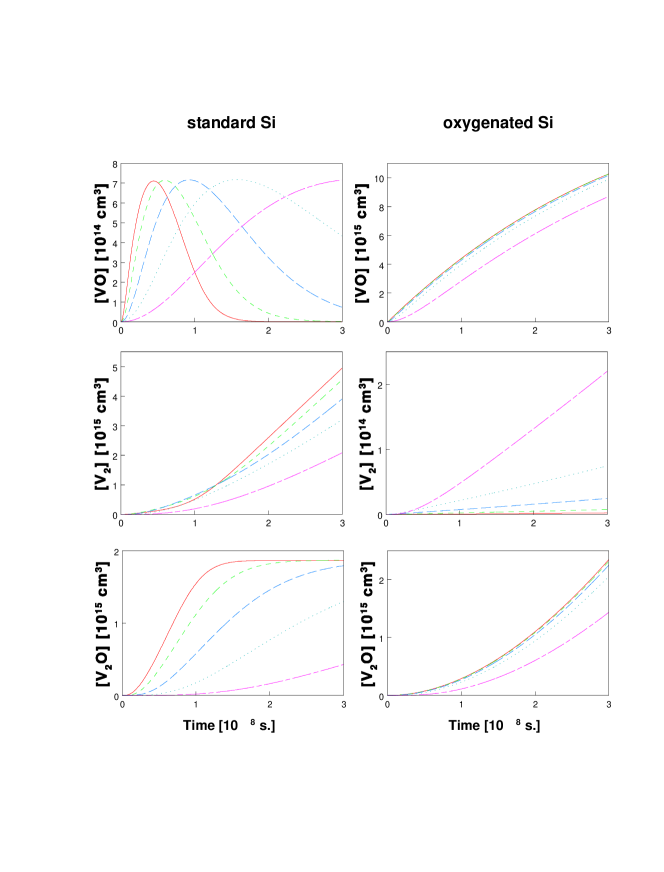
While in ”standard” silicon the decrease of the temperature slows down the rate of formation, a much weaker dependence has been found in silicon enriched in oxygen.
For the centres, the maximum concentrations correspond to the highest temperature, 20oC, and similar values are found at the end of the time interval considered, although the introduction rate of this defect has different behaviours in the two types of silicon considered.
In contrast to oxygen related centres, the concentration is more sensitive to temperature in ”oxygenated” silicon, where its values are much lower in respect to the corresponding ones for ”standard” material. More, the concentration of centres increases with the decrease of the temperature from 20 to -20oC in ”oxygenated” silicon, and decreases in the ”standard” material.
3.4 The correlation between the history of the irradiation process and defect concentrations
In some previous papers [15, 16], we demonstrated in concrete cases the importance of the sequence of irradiation processes, considering that the same total fluence can be attained in different situations: the ideal case of instantaneous irradiation, irradiation in a single pulse followed by relaxation, and respectively continuos irradiation process. As expected, after instantaneous irradiation the concentrations of defects are higher in respect with ”gradual” irradiation.
After this analysis, the specific importance of the irradiation and annealing history (initial material parameters, type of irradiation particles, energetic source spectra, flux, irradiation temperature, measurement temperature, temperature and time between irradiation and measurement) on defect evolution must be underlined.
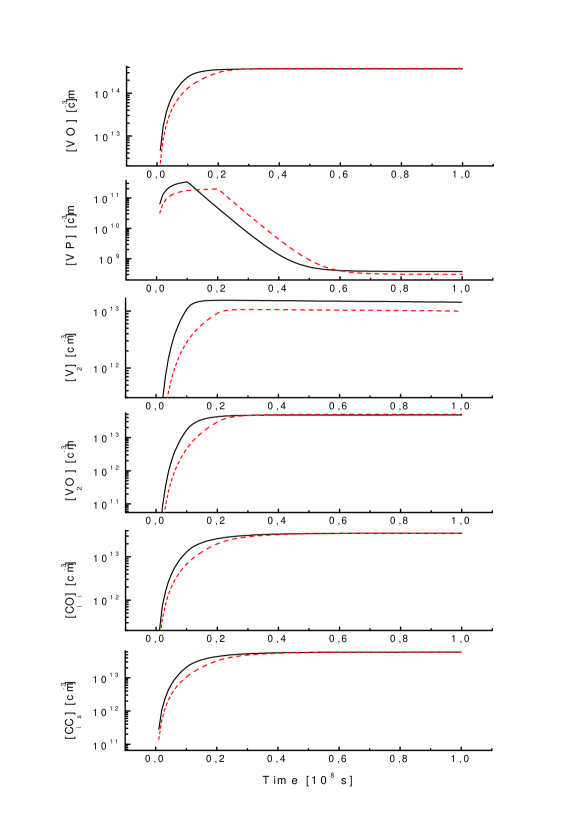
Now, we present comparatively in Figure 5 the time evolution of stable defects in standard silicon, irradiated during s, when pairs/s have been generated (continuous line), and during s, with pairs/s (dashed line), respectively. The values have been chosen to produce the same amount of vacancy - interstitial pairs. The behaviour of stable defect concentrations is analysed after irradiation. It could be seen that a shorter and stronger irradiation conduces to higher concentrations of and centres in the asymptotic limit, with important consequences for the leakage current, due to the position in the band gap of silicon of these defect levels.
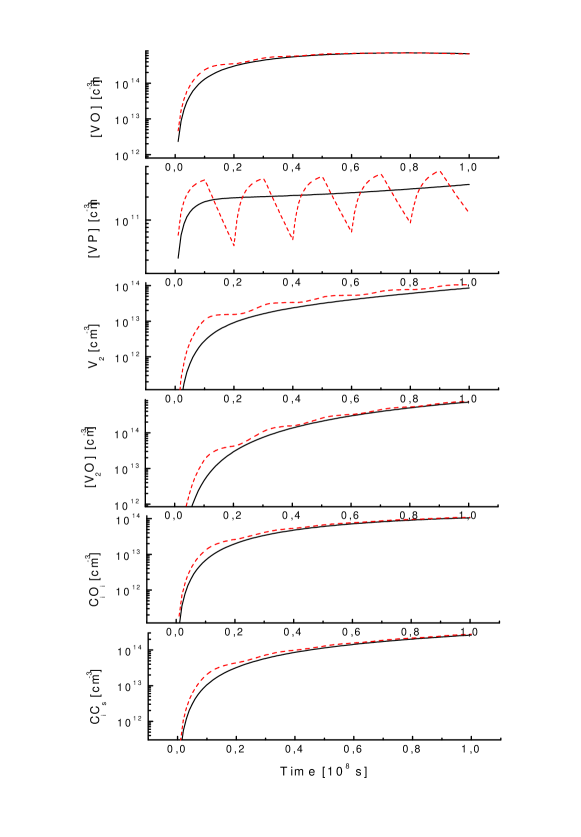
Another scenario that could be of interest is the comparison of the effects of continuous and pulsed irradiation, with the same integral rate of primary defect production. The time evolution of the concentrations of stable defects is represented in Figure 6. The effects of continuous irradiation of standard silicon, at 20oC, with a rate of pairs/s (continuous line) are compared with pulsed one: s. irradiation, with pairs/s, and s. relaxation. As in the previous case (Figure 5), the concentration of centres follows the best the irradiation type, while for the other defects the succession irradiation - relaxation is almost not observable.
4 Summary and conclusions
The production of defects in radiation fields, in silicon for detector uses, and their evolution toward equilibrium, has been microscopically modelled in the frame of a quantitative model, without free parameters. Vacancy-interstitial annihilation, interstitial migration to sinks, divacancy and vacancy-impurity complexes (; ; , and ) formation is considered.
The model supports the experimental data and confirms the different studies performed to investigate the influence of oxygen in the enhancement of the radiation hardness of silicon for detectors. The defects in oxygen enriched silicon are favoured in respect to the other stable defects, so, for detector applications it is expected that the leakage current decreases after irradiation. At high oxygen concentrations, this defect saturates starting from low fluences at high generation rates of defects.
The generation rate of primary defects, calculated starting from the projectile - silicon nucleus interaction and from the extended Lindhard theory, is considered in a large range of values.
The obtained results suggest the importance of the conditions of irradiation, temperature and annealing history on defect kinetics.
References
- [1] J. Bourgoin, and M. Lannoo, ” Point Defects in Semiconductors”, (edited by M. Cardona, P. Fulde, H. J. Quisser), (Springer Verlag, Berlin, 1983) Springer Series in Solid State Sciences, vol. 35.
- [2] S. Lazanu, I. Lazanu, Nucl. Instr. Meth.Phys. Res. A 462 (2001) 530.
- [3] M. Bruzzi, IEEE Trans. Nucl. Sci, NS-48 (2001) 960.
- [4] Y. H. Lee and J. W. Corbett, Phys. Rev. B 13: (1976) 2653.
- [5] I. Lazanu, S. Lazanu, U. Biggeri, E. Borchi, M. Bruzzi, Nucl. Phys. 61B (1998)
- [6] S. Lazanu, I. Lazanu, U. Biggeri, S. Sciortino, Nucl. Instr. Meth.Phys. Res. A 413 (1998) 242.
- [7] Z. Su, A. Husain,, J. W. Farmer, J. Appl. Phys. 67 (1990) 1903.
- [8] S.D.Brotherton and P. Bradley, J. Appl. Phys. 53 (1982) 5720.
- [9] L. W. Song, B. W. Benson, G. D. Watkins, Phys. Rev. B 33 (1986) 1452.
- [10] U. Biggeri, E. Borchi, M. Bruzzi, Z. Li, S. Lazanu, IEEE Trans. Nucl. Sci. NS 41, 964 (1994).
- [11] M. Moll, E. Fretwurst, G. Lindstrom, Nucl. Instrum. Meth. Phys. Res. A 439 (2000) 282.
- [12] B. C. Mac Evoy, A. Santacchia, G. Hall, Physica B 273-274 (1999) 1054.
- [13] The CMS Collaboration, CMS Technical Proposal, CERN / LHCC 94-38 (1994).
- [14] J. Alcaraz et al., Phys. Lett B 472 (2000) 215, J. Alcaraz et al., Phys. Lett B 490 (2000) 27.
- [15] S. Lazanu, I. Lazanu, Nucl. Instr. Meth. Phys. Res. B 183 (2001) 383.
- [16] I. Lazanu, S. Lazanu, Physica Scripta 66 (2002) 125.