Jet Production at CDF ***Presented on behalf of CDF collaboration at “ Corfu 2001: Summer School and Workshop on High Energy Physics, September 1-14, 2001.”
Christina Mesropian
CDF Collaboration
The Rockefeller University
1230 York Avenue
New York, NY 10021
USA
Abstract
In this talk I present the results from the measurement of the inclusive jet cross section and strong coupling constant based on the CDF Run 1B data, and discuss prospects for Run 2.
1 Introduction
Jet production at hadron colliders provides an excellent opportunity for testing the theory of strong interactions, Quantum Chromodynamics (QCD). QCD has achieved remarkable success in describing hadron interactions at short distances (large momentum transfers), owing to the property of asymptotic freedom. Processes with large momentum transfer can then be described by an expansion in powers of . Higher energy collisions produce jets of higher energy particles, while the value of decreases, improving the validity of perturbative expansion. Since the first measurements of the inclusive jet cross section by UA2, many experiments studying jet production published comparisons between theoretical predictions and experimental measurements. In particular, results from the CDF Run 1A data (1992-1993) inclusive differential jet cross section measurement, which showed significant excess of the data over the theoretical predictions at high , generated lot of excitement due to the possibilities of new physics, and motivated the re-evaluation of all components of theoretical calculations.
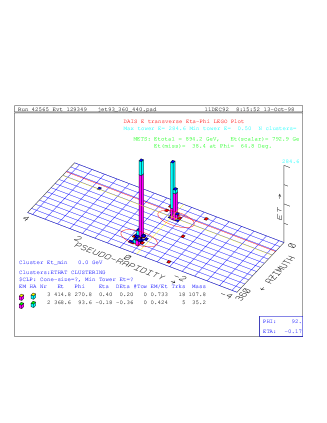
The cornerstone of data to theory comparisons is the question of jet identification. In theoretical calculations, jets are manifestations of partons as relatively isolated sprays of energetic hadrons observed in the final state of high energy collisions. From the experimental point of view jets are defined as large energy deposits in a localized group of calorimeter cells, see Fig. 1.
To minimize the difference between parton level predictions and measured jet properties, the clustering algorithms are used which could be implemented for both situations. Jet algorithms start from a list of “particles” that are taken to be calorimeter towers in experimental case and partons for theoretical calculations, and associate clusters of these particles into jets in such a way that the kinematic properties of the jets can be related to the properties of the energetic partons produced in the hard scattering process. This way jet algorithms allow us to see the partons in the final hadronic state. Differences in the properties of reconstructed jets when going from parton to hadronic or calorimeter level are of major concern for a good jet algorithm.

Historically cone algorithms were used for jet measurements in hadron-hadron colliders. In Snowmass algorithms, two partons are combined into a jet if they fall within a cone of radius in space, where and , are the separation of the partons in pseudo-rapidity and azimuthal angle. It is further required that the axis of the cone coincides with the jet direction as defined by weighted centroid of the particles within the cone, where is the transverse energy. A similar algorithm with is used in the experimental data analysis by using calorimeter towers instead of partons. The latest modification of this algorithm when applied to the theoretical calculations introduces an ad hoc parameter [8] which is used to regulate the merging and separation of parton clusters in manner similar to the experimental analysis. In addition to the difficulty with merging/splitting rules which were not addressed in the original Snowmass algorithm, cone algorithms turned out to be sensitive to the soft radiation at the NNLO calculations. The second type of algorithm, is so-called algorithm which is infrared and collinear safe to all orders of calculations and gives close correspondence with jets reconstructed in calorimeter with jets reconstructed from partons, since it successively merges pairs of “particles” in order of increasing relative transverse momentum. The difficulties of applying this algorithm are due to the question of the subtraction of the underlying event energy and problem of minimizing computing time.
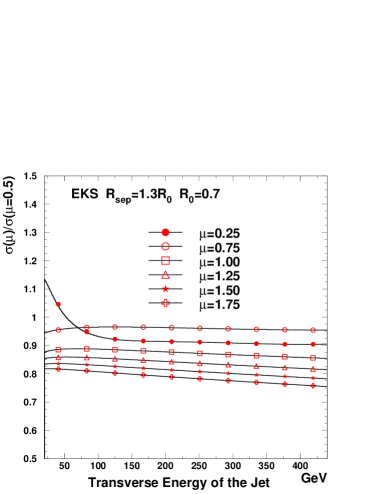
There are additional issues which affect sensitivity of the measurements. First is the limited accuracy of the fixed order perturbative calculations due in part to the intrinsic uncertainties associated with the choice of renormalization and factorization scales, and , see Fig. 2(left). For the usual range of to the variation in prediction is around 20%.
The variation in above mentioned parameter attributes to some 5-6% uncertainty, Fig. 2(right). But the limited knowledge or parton distribution functions (PDFs), which are obtained from global fits to deep inelastic scattering (DIS), Drell-Yan production and other collider data, are the largest source of uncertainty for the calculations. The effect of this uncertainty will be discussed later.
2 Inclusive Jet Cross Section
The inclusive jet cross section measurement is based on a data sample of integrated luminosity collected by the Collider Detector at Fermilab (CDF) during the 1994-95 run (Run 1b) of the Fermilab Tevatron collider operating at TeV. The CDF detector is described elsewhere [1]. Details of the measurement of the inclusive jet differential cross section can be found in [2]. Briefly, jets are reconstructed using the iterative fixed cone algorithm mentioned above.
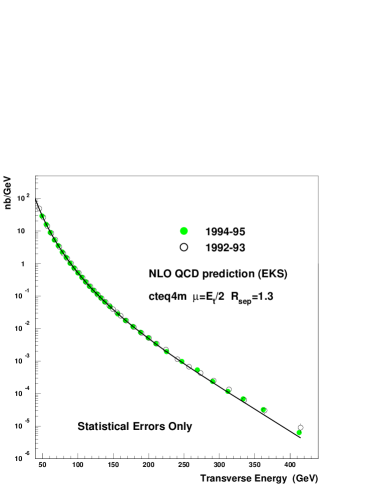

The inclusive jet cross section includes all jets in an event in the pseudorapidity range . The measured spectrum is corrected for the calorimeter response, resolution and the underlying event energy using an iterative unsmearing procedure which changes both the energy scale and the normalization simultaneously. Figure 3(left) shows the corrected Run 1B cross section compared to a QCD prediction and Run 1A results. As we see, the results of Run 1B and Run 1A are in good agreement.
The majority of experimental systematic uncertainty arises from the uncertainty in the simulation of the response of the detector to jets. The simulation is tuned to the data for charged hadron response, jet fragmentation , and response. Additional uncertainty is associated with the jet energy resolution, the definition of underlying event, the stability of the detector calibration over the long running periods and an overall normalization uncertainty from the luminosity determination. For each source of systematic uncertainty described above, except normalization, the inclusive jet cross section was re-evaluated by varying the corresponding parameter in the detector response by 1 . For the normalization uncertainty it was changed by a scale factor, see Fig. 3 (right).
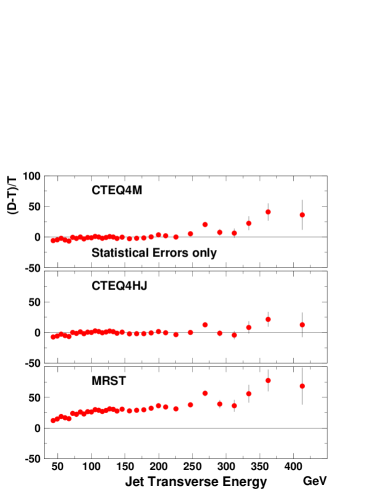
Figure 4 shows the cross section compared to QCD predictions using three recent PDFs. Good agreement is observed using conventional (CTEQ4M and MRST) PDFs except at high values of transverse energy, starting at 200 GeV, where an excess is observed. Similar deviation have been observed in other CDF jet cross section measurements such as the dijet mass [3], dijet differential [4], and [5] analyses. One possible explanation for the excess of high jets is that the gluon distribution at high is larger than conventional PDFs have indicated. We see that CTEQ4HJ, (special PDF set, which was created to explore the flexibility in the gluon distribution at high , and was generated by including CDF jet data in the global fit with higher statistical weight assigned to high points and a new parameterization of the gluon distribution [6]), gives the best overall agreement with the data in overall shape and normalization.
3 Strong Coupling Measurement
The value of , a free parameter of QCD, is one of the fundamental constants of nature. Its determination is the essential measurement of QCD, and the observation of its evolution, or running, with momentum transfer is one of the key tests of the theory.
The value of is determined by comparing the jet cross section with the next to leading order (NLO) perturbative QCD predictions [7]. In the region studied, the non-perturbative contributions to the inclusive jet cross section are estimated to be negligible [8]. The procedure of extracting can be summarized by the equation
| (1) |
where is the transverse energy distribution of the inclusive jets, and are the renormalization and factorization scales, is the leading order (LO) prediction for the inclusive jet cross section, and the NLO contribution. Both and are calculated with the jetrad Monte Carlo program [9]. All calculations are performed in the modified minimal subtraction, , scheme. The jetrad Monte Carlo program has as an input parameters: jet cone radius , , PDF set and .
The inclusive jet data are divided into 33 bins, from which we obtain statistically independent measurements of for 33 different values of . The values derived for using cteq4m [6] parton distribution functions (PDFs) are presented in Fig. 5 (left). For 250 GeV, there is good agreement with QCD predictions for the running of the coupling constant. The behavior of at higher values is a direct reflection of the excess observed in the inclusive jet cross section [2].
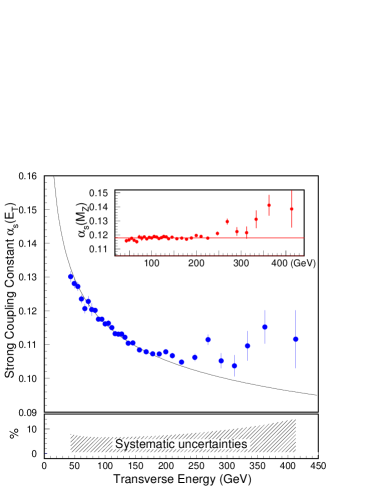
The measured values of are evolved to the mass of the boson, , by using the solution to the 2-loop renormalization group equation. The values of for all 33 measurements are shown in the inset of Fig. 5(left). Averaging over the range 40-250 GeV, we obtain [10]
Inclusion of the data with 250 GeV results in an increase of the average value by 0.0001.
The experimental systematic uncertainties on the value of are derived from those on the inclusive jet cross section and when summed in quadrature yield uncertainty.
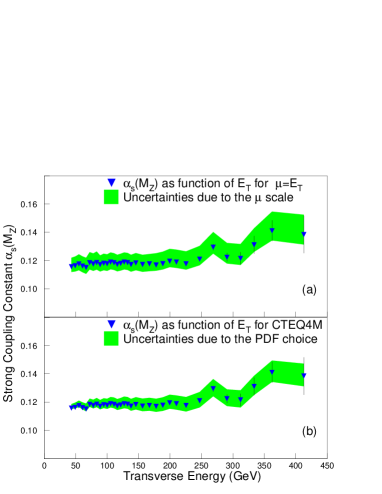
The theoretical uncertainties are mainly due to the choice of renormalization and factorization scales and parton distribution functions. The scales and are expected to be of the same order as the characteristic scale of the process, which in this case is the jet . We have evaluated the changes in resulting from independently varying and from to and found that the largest changes occur for . For all results presented in this letter the two scales were set equal. The sensitivity of the measured to changes in these scales is indicated by the shaded band in Fig. 5(right)(a). Over the range from 40 to 250 GeV, the shift in induced by changing the scale from to is approximately , independently of . We use the cteq4a series to study the dependence on the PDFs. In addition, we have studied using PDF sets which do not include Tevatron jet results, such as the mrst(g) set [11], the mrsa′ series [12], and two mrs-r sets [13]. The , calculated by comparing the data with the theoretical prediction in the restricted range of 40-250 GeV, is used to quantify the agreement. The minimal is obtained for cteq4m (=0.116), therefore we use this PDF in our final fit. Excluding the PDFs which have obvious disagreement (), we estimate the uncertainty on the due to the PDF choice to be , see Fig. 5(right)(b).
The resulting value of is in good agreement with the world average . But what is more important running of is shown over a very large energy range in the single experiment.
4 Dijet Triply Differential Cross Section
The rapidity dependence of the dijet differential cross section provides information about new regions of and . Assuming a 22 hard scattering, the event kinematic variables are related to the jet’s transverse energy and pseudorapidity as
where the sum is over all jets in the event. The are parton momentum fractions and is the two body four momentum transfer of the interaction. CDF measured the dijet differential cross section [4] where one jet is restricted to the central region and the other jet is constrained to different rapidity regions. Fig. 6 (left) shows the CDF data compared to the theoretical predictions. An excess similar to that of the inclusive jet cross section is observed.

5 Run 2 Prospects
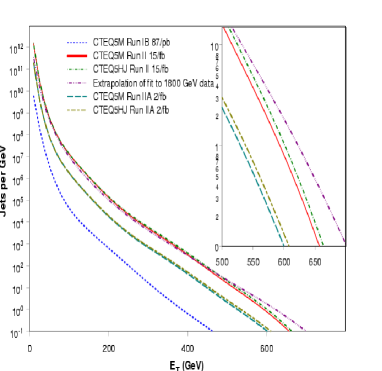
One of the goals of the Run 2 is to obtain higher precision for QCD measurements. A data sample of 2 will enable the jet cross section to be probed for higher and values, than were possible at Run 1. In addition to the high statistics the increase in the center-of-mass energy from 1800 GeV to 1960 GeV has a large effect on the high jet rate. For the full Run 2A sample the numbers of jets above 400 GeV are expected to increase from 11 to , with energy reach extending to 550 GeV, see Fig. 6 (right). For jet identification CDF will use both standardized jet cone and algorithms.
The Run 2 calorimeter upgrade provides calorimetry as precise in the forward region as in the central one. The inclusive jet cross section will be measured out to rapidity values of 3 in Run 2, and dijet differential measurement can be enhanced by allowing both jets to be non-central. In Run 2 the measurement of the strong coupling constant will be possible from a of 100 GeV2 to 300000 GeV2. With more luminosity delivered by Tevatron every day, we are looking forward to new QCD precision measurements at CDF.
Acknowledgments It is a great pleasure to thank Prof. G. Zoupanos and organizers for opportunity to give this talk and for their very warm hospitality in Corfu.
References
- [1] F. Abe et al., Nucl. Instrum. Methods A 271, 387 (1988).
- [2] T. Affolder et al., Phys. Rev. D 64, 032001 (2001).
- [3] T. Affolder et al., Phys. Rev. D 61, 091101 (2000).
- [4] T. Affolder et al., Phys. Rev. D 64, 012001 (2001).
- [5] F. Abe et al., Phys. Rev. Lett. 80, 3461 (1998).
- [6] H. L. Lai et al., Phys. Rev. D 55, 1280 (1997).
- [7] W. Giele et al., Phys. Rev. D 53, 120 (1996).
- [8] S. D. Ellis et al., Phys. Rev. Lett. 69, 3615 (1992).
- [9] W. Giele et al., Phys. Rev. Lett. 73, 2019 (1994).
- [10] T. Affolder et al., Phys. Rev. Lett. 88, 042001 (2002).
- [11] A. D. Martin et al., Eur. Phys. J. C 4, 463 (1998).
- [12] A. D Martin et al., Phys. Lett. B 356, 89 (1995).
- [13] A. D. Martin et al., Phys. Lett. B 387, 419 (1996).
- [14] D. E. Groom et.al., Particle Data Group, Eur. Phys. J. C 15, 1 (2000).