Hard Scattering Based Luminosity Measurement at Hadron Colliders
Walter T. Giele
Fermi National Accelerator Laboratory, Batavia, IL 60510
and
Stéphane A. Keller
Theory Division, CERN, CH 1211 Geneva 23, Switzerland 111Supported by the European Commission under contract number ERB4001GT975210, TMR - Marie Curie Fellowship
Abstract
A strategy to determine the luminosity at Hadron Colliders is discussed using the simultaneous -boson and -boson event counts. The emphasis of the study will be on the uncertainty induced by the parton density functions. Understanding this source of uncertainties is crucial for a reliable luminosity determination using the -boson and -boson events. As an example we will use the D0 run 1 results to extract the luminosity using the vector boson events and compare the result with the traditional method. Subsequently we will look at the implications for the top cross section uncertainties using the extracted luminosity.
1 Introduction
A luminosity measurement based on a well understood hard scattering process is desirable. Such a method gives good control over the theoretical uncertainties and a systematic approach to further reduce the uncertainties is possible. Also, the measured luminosity will be correlated with other hard scattering processes in the same experiment. This leads to a smaller uncertainty in the comparison between experiment and theory as the correlated luminosity uncertainty partly cancels. Only when comparing results between different experiments is the full luminosity uncertainty relevant.
The method to determine the luminosity outlined in this paper is based on the principle of comparing the theoretical cross section to the measured number of -boson events [1]. However, because of the presence of the PDF uncertainties the theoretical prediction is a probability density and a more sophisticated formalism to extract the luminosity is needed. Furthermore, by looking at the correlated -boson and -boson events simultaneously we not only measure the luminosity but also provide a consistency check. This because the ratio of the -boson over the -boson cross sections is independent of the luminosity.
In section 2 we will review some of the theoretical considerations needed for the calculations. In particular the use of the optimized PDF sets of ref. [2] together with the needed physics parameters used in the predictions of the -boson and -boson cross sections.
Before extracting the luminosity we will first look in section 3 at the published D0 -boson and -boson cross sections [3, 4]. Comparing the measured cross sections with the theory predictions, which now include the PDF uncertainties, will give us a better understanding of some of the issues involved.
Section 4 will outline the method and as an example use the D0 run 1a [3] and run 1b [4] results to determine the luminosity. Next, in section 5 we will look at the top quark pair predictions in relation to the measured luminosity. First of all we want to predict the measured cross section which can be compared to other experiments. Secondly, we want to compare the measured number of topquark pair events to the theory. In the latter comparison the luminosity uncertainty is strongly reduced and potentially challenging the theory further than currently is possible.
Section 6 summarizes our findings and outlook for future hadron collider experiments
2 Theoretical Considerations
| (GeV) | (GeV) | |||
|---|---|---|---|---|
| ()% | ()% |
The most important aspect of the method is to be able to quantify the dominant source of uncertainty in the theory prediction of the -boson and -boson cross sections. The physics parameters used in the prediction (such as the vectorboson mass and width, the electroweak coupling constants, etc) are known up to a high precision relative to the experimental uncertainties. The values used are listed in table 1. However, the PDF’s carry a large uncertainty incurred by the experimental data used to determine the PDF’s. We will use the optimized PDF sets of ref. [2]. These PDF sets have been optimized with respect to deep inelastic proton scattering data. As we will see the employed method of numerical integration over the functional space of all possible PDF’s is well fitted to handle the uncertainty estimates in the cross section calculations. Important issues such as the correlation between the -boson and -boson cross section predictions induced by the PDF’s and the non-gaussian aspect of the predictions can be handled without any effort.
The cross section predictions will be performed at next-to-leading order in the strong coupling constant using the DYRAD Monte Carlo [5]. While the next-to-next-to-leading order matrix elements are known [6], the PDF evolution is not known up to the matching order. Moreover, we want to use the extracted luminosity to predict the number of events for other observables. To be consistent in such a procedure all theoretical predictions should be at the same order. We can use the next-to-next-to-leading order matrix element calculation to get an estimate of the remaining uncertainties due to the truncation of the perturbative expansion. For the -boson and -boson cross sections this uncertainty is around 2% and is well below current experimental uncertainties. We will also make next-to-leading order cross section predictions for the topquark pair production using the HVQ Monte Carlo of ref. [7]. This Monte Carlo is based on the calculations of ref. [8].
A word of caution has to be given to the acceptance corrections needed for the -boson and -boson events given the incomplete leptonic coverage of the detector. These acceptance corrections have to be calculated using the theory model and hence are dependent on the parton density functions. While this can be easily incorporated in a full analysis the current published results for the -boson , -boson and top quark pair production cross sections use a particular parton density function for the calculation of the acceptance corrections. For this paper we have to neglect this effect which most likely is small compared to other uncertainties in the problem. However, it can introduce a bias and only the experiments themselves could properly take the correlation of the acceptance correction with the parton density functions into account.
3 Cross Section Results and Comparisons
| D0 1a | D0 1b | |
|---|---|---|
| (nb) | 2.360.020.080.13 | 2.310.010.050.10 |
| (nb) | 0.2180.0080.0080.011 | 0.2210.0030.0040.010 |
| 10.820.410.35 | 10.430.200.10 | |
| (pb-1) | 12.80.7 | 84.53.7 |
| (nb) | (nb) | |
|---|---|---|
| D0 1a | 2.36+0.15-0.15 | 0.218+0.016-0.016 |
| D0 1b | 2.31+0.11-0.11 | 0.221+0.011-0.011 |
| MRS99 | 2.49 | 0.218 |
| CTEQ5M | 2.55 | 0.222 |
| ZEUS-MRST | 2.45+0.06-0.06 | 0.227+0.007-0.007 |
| NMC-MRST | 2.35+0.11-0.09 | 0.231+0.008-0.011 |
| H1-MRST | 2.10+0.18-0.13 | 0.195+0.013-0.013 |
| H1+LEP-MRST | 2.12+0.13-0.16 | 0.194+0.013-0.013 |
| BCDMS-MRST | 2.41+0.12-0.08 | 0.231+0.011-0.007 |
| BCDMS+LEP-MRST | 2.50+0.09-0.11 | 0.237+0.008-0.011 |
| E665-MRST | 2.34+0.09-0.16 | 0.227+0.005-0.019 |
| E665+LEP-MRST | 2.41+0.06-0.18 | 0.227+0.025-0.015 |
| H1+BCDMS-MRST | 2.48+0.09-0.05 | 0.234+0.004-0.008 |
| H1+BCDMS+LEP-MRST | 2.22+0.06-0.12 | 0.208+0.006-0.007 |
| H1+BCDMS+E665-MRST | 2.44+0.07-0.07 | 0.232+0.007-0.006 |
| H1+BCDMS+E665+LEP-MRST | 2.35+0.04-0.03 | 0.220+0.006-0.004 |
In this section we will look at the quoted D0 -boson and -boson cross sections which uses the nondiffractive inelastic collision based luminosity measurement used by D0. We will compare the individual -boson and -boson results to the theoretical predictions, now including the PDF uncertainty. All the experimental results needed in this paper are collected in table 2.
Using the DYRAD Monte Carlo with the parameter choice of table 1 we make 100 predictions for the -boson and -boson cross sections for each of the optimized PDF sets. The 100 PDF’s randomly selected out of a set of 100,000 PDF’s are sufficient for the analysis in this paper. This leaves us with the basic probability density function for the vector boson cross section
| (1) |
where the sum runs over the optimized PDF’s in the set. The theoretical prediction depends on the PDF . This is a scatter plot representation of the probability density function. To calculate confidence level intervals based on only the theory prediction we use a histogram representation of the probability density function
| (2) |
with the bin width to be chosen 0.1 nb for the -boson cross section and 0.01 nb for the -boson cross section. Using the histogram representation we can define the confidence level probability
| (3) |
with the log-likelyhood given by
| (4) |
and
| (5) |
| D0 1a | D0 1b | |||
|---|---|---|---|---|
| ZEUS-MRST | 51.4 | 57.6 | 23.4 | 64.1 |
| NMC-MRST | 99.9 | 51.7 | 75.1 | 53.0 |
| H1-MRST | 18.2 | 22.6 | 23.6 | 8.8 |
| H1+LEP-MRST | 19.6 | 13.2 | 26.8 | 3.4 |
| BCDMS-MRST | 71.5 | 44.9 | 45.3 | 45.2 |
| BCDMS+LEP-MRST | 48.2 | 34.5 | 23.5 | 30.9 |
| E665-MRST | 85.1 | 84.6 | 94.7 | 95.9 |
| E665+LEP-MRST | 98.6 | 62.7 | 73.3 | 73.4 |
| H1+BCDMS-MRST | 35.3 | 38.5 | 12.5 | 34.7 |
| H1+BCDMS+LEP-MRST | 35.2 | 60.2 | 43.6 | 32.2 |
| H1+BCDMS+E665-MRST | 55.7 | 37.4 | 26.1 | 33.9 |
| H1+BCDMS+E665+LEP-MRST | 100 | 81.1 | 67.3 | 95.0 |
The results for the 12 optimized PDF’s are shown in table 4 together with the MRS99 [9] and CTEQ5 [10] predictions. The predicted one sigma standard deviation uncertainty varies between 1% and 8% depending on the chosen set.
Comparison with the experimental results should be done slightly different than by looking at overlaps in the confidence level intervals. The reason is that the experimental response function can be used. This probability density function gives the probability of measuring given a true nature value and is a condensation of the experimental uncertainty analysis. In this case the experimental response function is simply a one-dimensional gaussian with a width equal to the combined statistical and systematic uncertainties as given in table 2. We no longer have to construct the histogram of eq. 2 with an arbitrary parameter . Instead the PDF probability density for measuring given a particular PDF set is
| (6) |
Using eq. 3 we calculate the confidence level of the particular D0 measurements . That is, the likelihood that a repeat of the experiment renders a worse agreement with the theory. The results for both the D0 run 1a and run 1b are given in table 5. As is clear from the table the agreement with the theory for the run 1a results is excellent, with the H1-MRST and H1+LEP-MRST sets being the most disagreeing. The comparison with run 1b is more challenging as the accuracy of the experimental results was increased dramatically. Yet, with the exception of the two H1 set predictions all other PDF’s render excellent agreement.
4 Luminosity Determinations
We could use the individual -boson or -boson cross section to determine the luminosity. However, such a method would not give us a luminosity independent measure of how well the data describes the theoretical model. This is an important question as not all the optimized sets might be correctly describing the hadron collider data. The ratio of the -boson and -boson cross sections gives us a luminosity independent quantity and could function as a measure of the wellness of the particular PDF set to describe the data. This leads to the obvious method of deriving the luminosity from the correlated -boson and -boson events. Using the D0 results of table 1 we can determine experimental luminosity response function
| (7) |
where
| (8) |
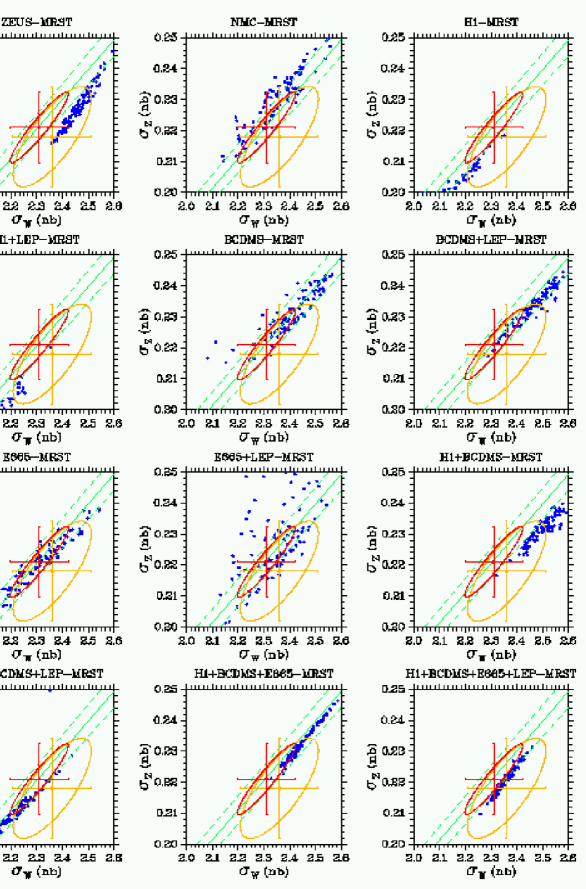
and the error correlation matrix. The run 1a and run 1b one standard deviation ellipses together with the 100 prediction of each of the optimized PDF’s are shown in fig. 1 As is obvious from the figure the increased accuracy of run 1b has a dramatic impact on the experimental result. The D0 one standard deviation ellipses are show using the measured luminosity and the luminosity uncertainty itself is incorporated in the contour. Changing the value of the luminosity will move the ellipse over the green line of constant ratio of the -boson and -boson cross sections.
Now we have to convert the results of fig. 1 into a luminosity measurement including the PDF uncertainty. For the remainder the experimental luminosity uncertainty is excluded from the calculation of the correlation matrix in the experimental luminosity function of eq. 7. The PDF probability function for the combined -boson and -boson cross sections is in the monte carlo approximation given by the scatter function
| (9) |
where . Note that this scatter function is shown in fig. 1. Using this PDF probability function for the -boson and -boson cross section together with the experimental luminosity response function of eq. 7 we can construct the luminosity probability density function given the number of observed -boson , , and -boson events, ,
| (10) | |||||
and the probability measure expressed in the confidence level
| (11) |
| D0 1a | D0 1b | |||
|---|---|---|---|---|
| (pb-1) | (pb-1) | |||
| 12.8+0.7-0.7 | - | 81.5+3.7-3.7 | - | |
| ZEUS-MRST | 12.3+0.5-0.5 | 96 | 79.3+3.1-3.3 | 4.6 (8.6) |
| NMC-MRST | 12.6+0.7-0.6 | 26 | 81.5+4.3-2.9 | 36 (29) |
| H1-MRST | 14.2+1.0-0.9 | 75 | 94.4+6.6-4.5 | 41 (52) |
| H1+LEP-MRST | 14.3+1.0-0.8 | 94 | 97.9+5.5-7.9 | 12 (26) |
| BCDMS-MRST | 12.3+0.6-0.6 | 47 | 80.8+2.8-3.8 | 93 (93) |
| BCDMS+LEP-MRST | 12.1+0.6-0.5 | 61 | 79.1+3.6-2.6 | 52 (66) |
| E665-MRST | 12.8+0.9-0.7 | 51 | 83.7+5.3-3.1 | 80 (92) |
| E665+LEP-MRST | 12.7+0.7-0.6 | 54 | 82.6+3.8-3.1 | 66 (72) |
| H1+BCDMS-MRST | 12.0+0.5-0.5 | 94 | 79.5+2.3-2.3 | 7.4 (12) |
| H1+BCDMS+LEP-MRST | 13.6+0.7-0.7 | 56 | 90.0+2.8-3.7 | 71 (81) |
| H1+BCDMS+E665-MRST | 12.3+0.5-0.5 | 54 | 80.3+2.3-2.8 | 67 (81) |
| H1+BCDMS+E665+LEP-MRST | 12.8+0.5-0.4 | 74 | 83.5+2.3-2.1 | 23 (34) |
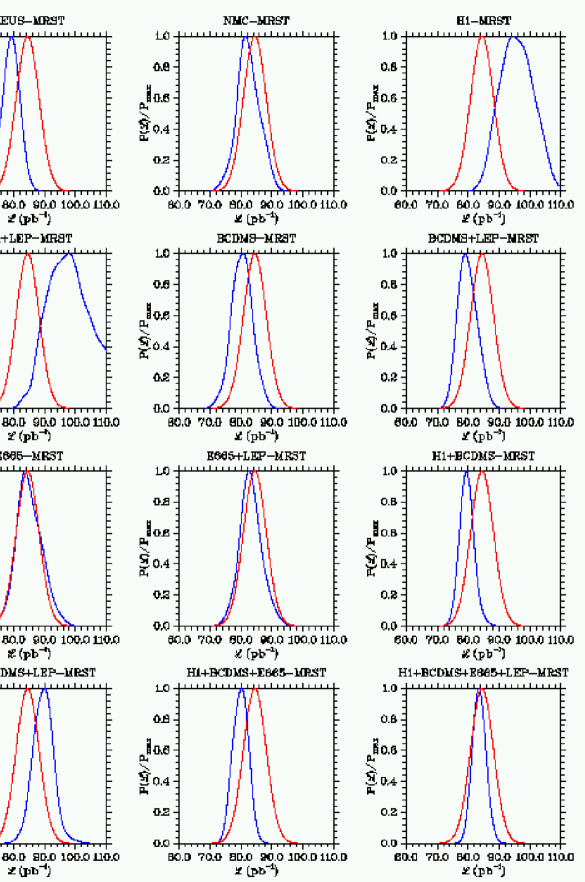
Using we calculate the 31.73% confidence level interval as an estimator of the luminosity based on the experimental observations. The results are listed in table 6. As can be seen the derived luminosities are very competitive with the traditional determination used by D0.
However, the confidence level intervals give no indication how well the experiment is described by the theory for the preferred luminosity. For this we have to calculate the probability a repeat of the measurement gives a worse agreement with the theory at the optimum luminosity. To do this we consider all possible outcomes of the experiment and integrate the PDF probability density function over the regions where the agreement with the theory is worse
| (12) | |||||
Note that the functional dependence is actually one dimensional as this confidence level is scale invariant, i.e. . In this sense the luminosity independent confidence level defined here is equivalent to the more traditional measure of agreement between experiment and theory of the ratio . The results are listed in table 6. For run 1a all optimized PDF’s have a satisfactory agreement at the preferred luminosity. As the experimental uncertainties are strongly reduced for the run 1b results the agreement between this experimental result and the theory is more challenging. Even so most optimized PDF’s do very well. Also indicated in the table for the run 1b results is the confidence level using the next-to-next-to-leading order matrix elements. It is useful to see the effect of the truncation of the perturbative series for the hard matrix element. As is clear the inclusion of higher order seems in general to increase the agreement between experiment and theory. However, for a true estimate of the perturbative component of the uncertainty we need to increase the order of the PDF’s evolution as well. Currently this is not possible and will have to wait until all calculations have been completed [11].
5 Using the measured luminosity.
| (pb) | (pb) | |||
|---|---|---|---|---|
| MRS99 | 5.17 | - | - | - |
| CTEQ5M | 5.39 | - | - | - |
| ZEUS-MRST | 3.15+0.71-0.26 | 5.87+0.26-0.22 | 242+40-10 | 3.8 |
| NMC-MRST | 5.66+1.32-1.20 | 5.71+0.20-0.29 | 415+41-20 | 72.6 |
| H1-MRST | 4.09+1.05-0.52 | 4.93+0.25-0.32 | 410+20-66 | 51.2 |
| H1+LEP-MRST | 5.33+0.19-1.53 | 4.75+0.43-0.27 | 452+28-117 | 65.1 |
| BCDMS-MRST | 4.21+0.27-0.27 | 5.76+0.28-0.20 | 338+22-18 | 27.1 |
| BCDMS+LEP-MRST | 5.29+0.29-0.60 | 5.88+0.20-0.25 | 420+26-26 | 64.6 |
| E665-MRST | 4.05+2.45-0.36 | 5.56+0.22-0.32 | 345+134-16 | 54.0 |
| E665+LEP-MRST | 4.89+2.74-2.44 | 5.63+0.22-0.24 | 400+96-145 | 46.6 |
| H1+BCDMS-MRST | 4.48+0.13-0.16 | 5.85+0.17-0.16 | 356+12-12 | 32.8 |
| H1+BCDMS+LEP-MRST | 4.25+0.13-0.22 | 5.17+0.22-0.15 | 379+14-13 | 43.1 |
| H1+BCDMS+E665-MRST | 4.95+0.42-0.29 | 5.80+0.21-0.15 | 401+17-16 | 53.0 |
| H1+BCDMS+E665+LEP-MRST | 4.35+0.21-0.15 | 5.57+0.15-0.14 | 364+14-11 | 37.5 |
The luminosity determined in the previous section using next-to-leading order perturbative QCD can be used for the other data in the experiment. We will take as an example the topquark pair production. In the first column of table 7 we show the 31.73% confidence level theory predictions including the PDF uncertainties using eqs. 2 and 3 with pb. As can be seen the PDF uncertainties on the topquark pair cross section are substantial. The published D0 run 1b topquark pair event rate is based on an enlarged data set with an integrated luminosity of pb-1. To estimate the efficiency corrected number of topquark pair events for the -boson and -boson sample we simply scale the luminosity down to the quoted D0 run 1b integrated luminosity of 84.5 pb-1. This gives a number of topquark pair events of . Using this number of observed events we can derive the measured cross sections by taking the ratio of the number of observed events over the luminosity measurements. The probability density function is given by eq. 10 with the substitution
| (13) | |||||
The 31.73% confidence level interval is given in the second column of table 7. Note that only the uncertainty induced through the luminosity uncertainty is included. The actual uncertainty on the number of observed topquark pair events is not as it would overwhelm the luminosity uncertainty for the current results. To include the experimental uncertainty in the topquark pair cross section we have to use the experimental response function density (i.e. the detector uncertainty) to get the topquark pair cross section probability function
| (14) |
The advantage of this way of using the luminosity is that one can compare the derived topquark pair cross section with other experiments.
When comparing directly with the theory one can use the luminosity correlation between the vectorboson production and the topquark pair production to further reduce the luminosity uncertainty. This we do by prediction the expected number of topquark pairs given the number of -boson and -boson events. The resulting formula is closely related to eq. 13, however now the luminosity substitution is inside the monte carlo summation over PDF’s as now is dependent on the PDF
| (15) |
where the triplet are the next-to-leading order predictions using PDF (i) out of the optimized set. The results are shown in the third column of table 7.
Using the experimental response function we get the smooth prediction for the probability density function of observing topquark pair events given and vectorboson events, now including the experimental detector uncertainties
| (16) |
By converting this probability density to a confidence level probability one can calculate the likelyhood the observed number of topquark pair events agrees with the theory predictions. The confidence level for the “observed” number of topquark pair events is shown in column 4 of table 7. Note the 32% exerimental uncertainty is now included in the estimate.
6 Conclusions
The luminosity determination using the -boson and -boson event rates can easily compete with the traditional methods with respect to accuracy. An added feature is that when comparing observables to the theory the luminosity uncertainty partly cancels because the observable dependence on the PDF’s is correlated to the -boson and -boson dependence. This leads to more accurate comparisons between theory and experimental result. The traditional luminosity determination offers no such correlations as it is not based on perturbatively calculable processes. Also, by including additional measurements in the PDF optimalization we can systematically improve the luminosity uncertainty to a level required by the physics of the TEVATRON run 2 or the LHC. Furthermore, the method can be extended to next-to-next-to-leading order once the required calculations are completed resulting in an excellent control of theoretical uncertainties.
Using the preferred H1+BCDMS+E665-MRST PDF set, which includes data from three mutually consistant experiments, we find a predicted -boson cross section of nb where the uncertainty is due to the PDF’s. Comparing with the D0 measured cross section in run 1b this leads to a confidence level of 26%. Similar, the predicted -boson cross section of gives a run 1b confidence level of 34%. From this we can conclude the optimized PDF set describes the collider physics well in parton fraction range relevant for the vectorboson physics. This means we can confidently continue to determine the run 1b D0 integrated luminosity for this sample. We find an integrated luminosity of pb-1 with a maximized confidence level of 67%, reflecting the fact that the correlated -boson and -boson data is well described by the PDF set. Using the measured luminosity we can continue to predict the number of observed topquark pair events. Including the PDF and luminosity uncertainty we expect . Comparing to the measured (but scaled) D0 run 1b measurement one finds a confidence level of 53%.
The method described in this paper can at minimum be used as an check on the traditional luminosity measurement. However, given its potential better accuracy and partial cancellation of the correlated luminosity uncertainties one can contemplate replacing the traditional method in future experiments. The TEVATRON run II results will offer an excellent testing ground for these ideas.
References
-
[1]
V. A. Khoze, A. D. Martin, R. Orava and M. G. Ryskin, hep-ph/0010163;
M. Dittmar, F. Pauss and D. Zurcher, hep-ex/9705004 (Phys. Rev. D56 (1997).) 7284 - [2] W. T. Giele, S. A. Keller and D. A. Kosower, hep-ph/0104052.
- [3] The D0 collaboration, hep-ex/9901040 (Phys. Rev. D60 (1999) 052003).
- [4] The D0 collaboration, see the D0 collaboration web page.
- [5] W. T. Giele, E. W. N. Glover and D. A. Kosower, hep-ph/9302225 (Nucl. Phys. B403 (1993) 633).
- [6] R. Hamberg, W. L. van Neerven and T. Matsuura, Nucl. Phys. B249 (1991) 343.
- [7] M. L. Mangano, P. Nason and G. Ridolfi, Nucl. Phys. B373 (1992) 295.
-
[8]
P. Nason, S. Dawson and R .K. Ellis, Nucl. Phys. B303 (1988) 607;
W. Beenakker, H. Kuijf, W. L. van Neerven and J. Smith, Phys. Rev. D40 (1989) 54. - [9] A. D. Martin, R. G. Roberts, W. J. Stirling and R. S. Thorne, hep-ph/9906231 (Nucl. Phys. Proc. Suppl. 79 (1999) 105).
- [10] H. L. Lai, J. Huston, S. Kuhlmann, J. Morfin, F. Olness, J. F. Owens, J. Pumplin and W. K. Tung, hep-ph/9903282 (Eur. Phys. J. C12 (2000) 375).
-
[11]
W. L. van Neerven and A. Vogt,
hep-ph/0006154 (Nucl. Phys. B588 (2000) 345); hep-ph/0007362 (Phys. Lett. B490 (2000) 111); hep-ph/0103123;
A. Retey and J. A. M. Vermaseren, hep-ph/0007294.