BRIS/HEP/2000-08GLAS-PPE/2000-11November 2000 00footnotetext: H. H. Wills Physics Lab., University of Bristol, UK. 00footnotetext: Dept. of Physics & Astronomy, University of Glasgow, UK.
The evolution of the logarithmic scaled energy spectra with energy scale, in the framework of the modified leading logarithmic approximation (MLLA), is investigated. The behaviour of the higher order moments of HERA deep inelastic scattering data are compared with the analytic predictions of MLLA.
1 Introduction
The properties of the hadronic final state cannot be calculated directly in Quantum Chromodynamics (QCD). It is necessary to model the transition from the perturbatively calculable partonic final state to hadrons. One approach that has been successful in describing the general features of the inclusive energy spectra, in both annihilation and deep inelastic scattering (DIS) experiments [1, 2], is the modified leading log approximation (MLLA). This uses the local parton hadron duality (LPHD) approach [3] to relate the MLLA partonic predictions to the hadronic observables.
The hadronic final state reflects the underlying partonic behaviour. At small values of momentum fraction carried by the outgoing parton from the original hard scatter, the parton shower development is dominated by gluon bremsstrahlung. The partonic properties can be calculated, on average, in the framework of the MLLA. These MLLA calculations have two free parameters: a running strong coupling, defined by a QCD scale and an energy cut-off, below which the parton evolution is truncated.
LPHD assumes that a simple normalisation factor, which does not explicitly include either the effect of particle masses or resonance decays, can be used to relate the hadronic distributions to the partonic ones. At large enough energies, away from where the parton evolution is truncated, this ‘hadronisation’ factor should be approximately independent of the energy scale [3] at which the parton spectra are calculated.
In our previous study [4], various approaches were taken to calculate the single particle spectra and their moments within the MLLA framework and compared with data. In this paper the theoretical results are compared with deep inelastic scattering data in the current region of the Breit frame [5].
The event kinematics of DIS are determined by the negative square of the four-momentum of the virtual exchanged boson, , and the Bjorken scaling variable, , where is the four-momentum of the proton. In the Quark Parton Model (QPM), the interacting quark from the proton carries four-momentum
A natural frame in which to study the dynamics of the hadronic final state in DIS is the Breit frame [6]. In this frame, the exchanged virtual boson is completely space-like and has a four-momentum , where is the momentum of the proton in the Breit frame. The particles produced in the interaction can be assigned to one of two regions, known as the current and target regions. The Breit frame allows the maximal separation of the incoming and outgoing partons in the QPM.
The current region in the Breit frame of DIS is analogous to a single hemisphere of annihilation. In the current region, the outgoing struck quark from the proton has a momentum The scaled momentum spectra of the particles in the current region, expressed in terms of are expected to have a dependence on similar to that observed in annihilation [1] at energy It should be noted though, that the current region of DIS will have a different primary quark flavour composition than annihilation, in particular for heavy quarks.
This paper extends the original ZEUS analysis by investigating the effect of introducing an effective mass term into the MLLA predictions (see section 2.) In contrast to the previous analysis of data [4] this effective mass was treated as an additional free parameter of the theoretical models and was fitted to the data.
2 Single Particle Spectra
Given a high-energy parton that fragments via secondary partons into a jet of hadrons, the MLLA evolution equation allows the secondary parton spectra for the logarithmic scaled energy, to be calculated [7]. The variable is defined as where for DIS) is the energy of the original parton and is the energy of the secondary parton. The cut-off, limits the parton energy to where is the transverse energy of the decay products in the jet evolution. In order to reconstruct the distributions an inverse Mellin transformation is performed.
It is convenient to investigate the MLLA spectra in terms of moments. The analytic form of the cumulant moments has been calculated in [7] for the first four moments. This allows the normalised moment, to be calculated and hence the dispersion (), skewness () and the kurtosis () to be constructed, see for example [8]
| (1) | |||||
| (2) | |||||
| (3) | |||||
| (4) |
The so-called limiting spectrum [3] is the case when The distribution, is dependent on one parameter which is given by where is now the only free parameter. For this limiting case, Fong and Webber [9] have also calculated the behaviour of the moments of the spectra with energy scale They point out that the spectra can be represented close to the maximum of the distribution by a distorted Gaussian of the form:
| (5) |
where and is the mean. The differences between the parton spectra for quark (and gluon) jets are Next-to-MLLA effects and have been included in these investigations according to the approximate prescription of Dokshitzer et al. [10].
The MLLA limiting spectra predicts that the -dependence of should have the form
| (6) |
where is expected to be [11].
The mean and peak position, are related, for the skew Gaussian used here, by
| (7) |
Thus the maximum is a function of several variables.
In the MLLA approach discussed above, the partons are assumed massless so the scaled energy and momentum spectra are identical. Experimentally the scaled momentum distribution is usually measured and as the observed hadrons are massive the equivalence of the two spectra no longer holds. In [12] the assumption is made that the cut-off can be related to an effective mass, of the hadrons. This allows the logarithmic scaled momentum distribution, to be written as
| (8) |
where
and the energy of a hadron with a momentum is The limiting momentum spectra based on massless partons or massive partons with the being set to will be referred to as MLLA-0 and MLLA-M spectra, respectively.
3 Comparison with DIS Data
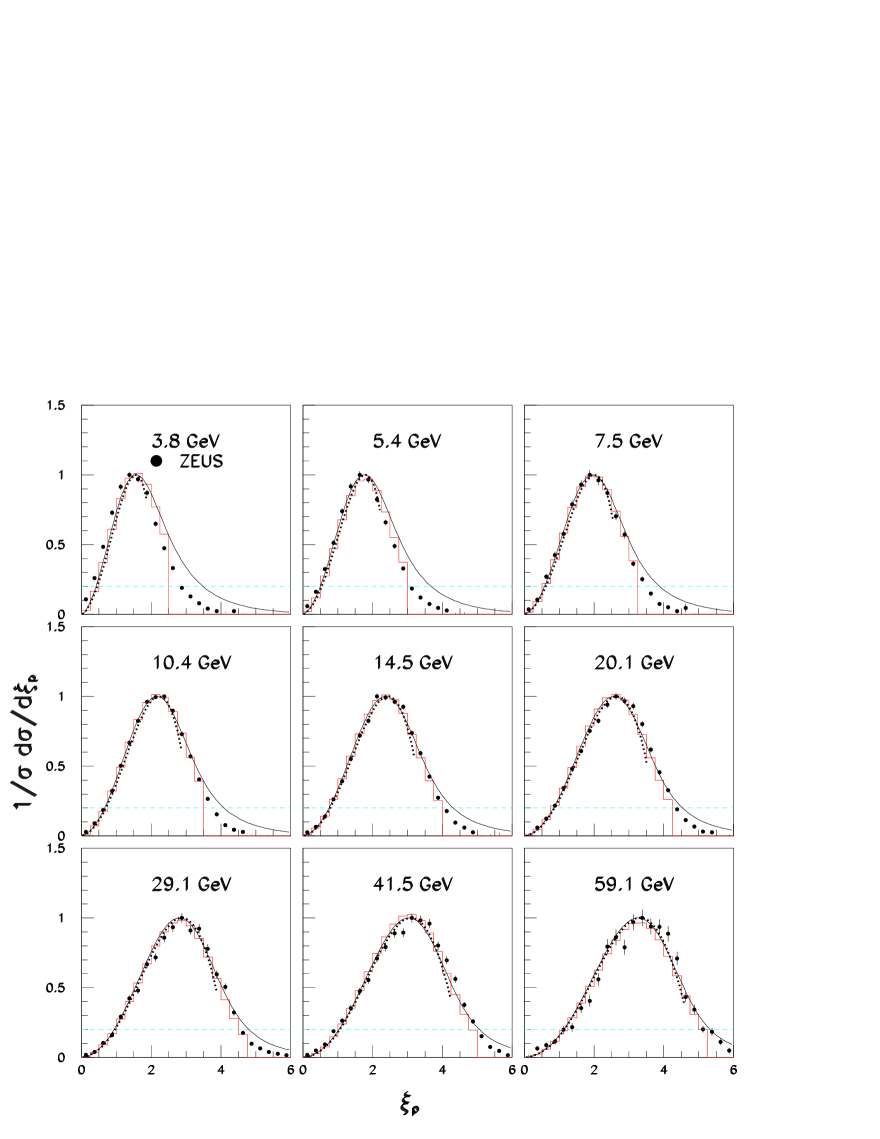
Figure 1 shows the differential distributions, with statistical errors only, for charged particles in the current fragmentation region of the Breit frame for nine values from the ZEUS experiment [5]. These distributions are approximately Gaussian in shape with the mean charged multiplicity given by the integral of the distributions. As increases, the multiplicity increases and, in addition, the peak of the distribution moves to larger values of The data were fitted to the distorted Gaussian of eqn. 5 over a range of units (for ) or units (for ) in around the mean. This is the range used by the ZEUS collaboration in their analysis of the data. The smooth curves in Fig. 1 result from the fit to the data; they represent the data well. The fitted parameters were insensitive to the range of the fit. The values are not quoted here because the measurements are dominated by systematic errors.
The ZEUS data, solid points, are compared with various MLLA curves in Figure 2. For clarity both the data and theory are normalised to a maximum value of unity. The theoretical curves (solid line MLLA-M, dotted line MLLA-0) are calculated for Both the MLLA-0 and MLLA-M describe well the general trend of the data. In particular, MLLA-M describes well the central region of data for There is a trend however, for the MLLA-M distribution to be more positively skew than the data; this is particularly pronounced at low energies. In contrast, MLLA-0 is consistently less skew than the data with the skewness being negative at low MLLA-M and MLLA-0 converge to similar distributions as increases. At low the data are peaked at lower values of than the theoretical predictions while at high the predictions peak lower than the data.
The histogram is a fit of MLLA, in the theoretically allowed region, over the range of data above the horizontal dashed line (80% of the data as measured from the maximum of the distributions), taking both and to be free parameters. The normalisation of the distribution in each bin was allowed to vary. The fit gives and Again, within the errors, the parameters were insensitive to the region of the fit to the data. The fitted MLLA gives a distribution intermediate between MLLA-M and MLLA-0. The data are well fitted for Otherwise, the fit closely follows MLLA-M and shows a similar disagreement with the data.
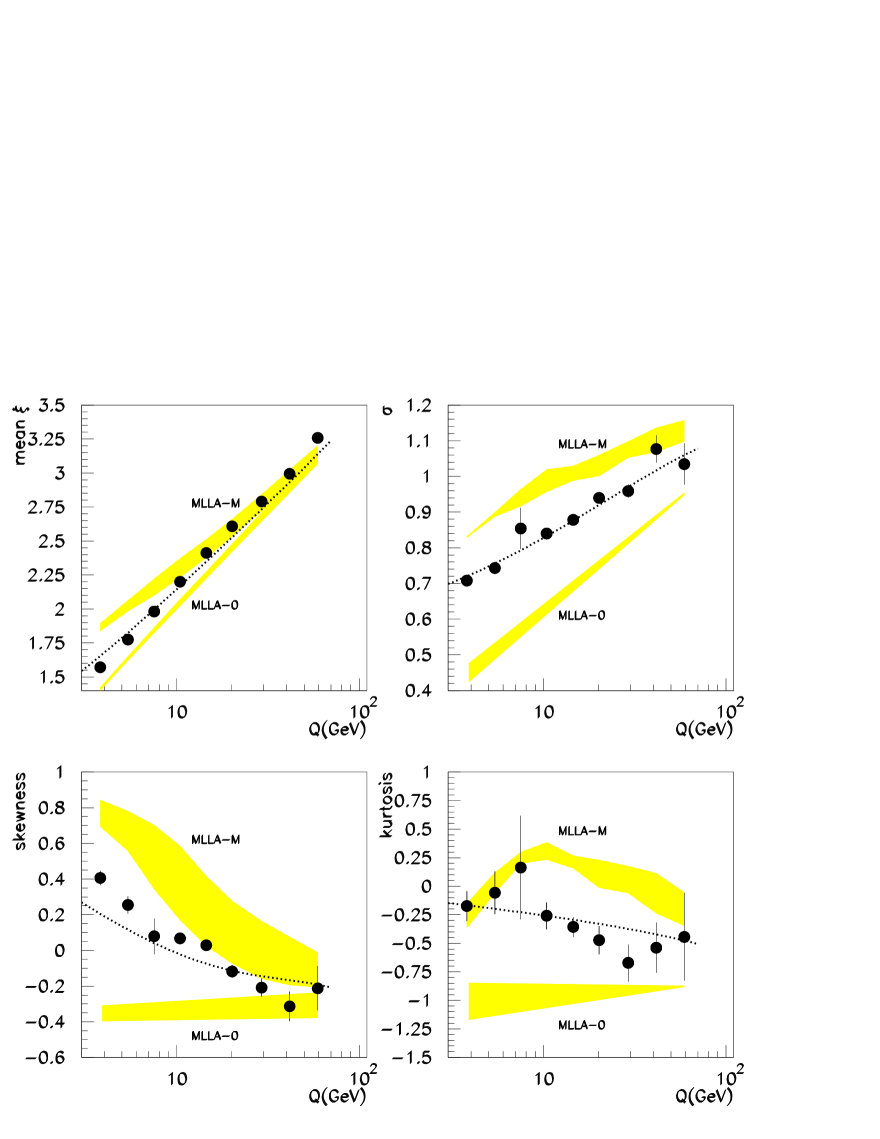
To study further the differences between the MLLA predictions and the data, fits of a skew Gaussian have been made to the MLLA predictions, in a manner similar to the fits made to the data, in order to extract the moments. Figure 3 shows the first four moments of the spectra as a function of For the ZEUS data (solid points), the mean and increase as increases, whilst the skewness and kurtosis fall. Also shown are the results from the fits to the MLLA-M and MLLA-0 spectra, the upper and lower shaded areas respectively. For both MLLA-0 and MLLA-M the range fitted lay between 30% of the spectrum (lower limit of band) to 80% of the spectrum (upper limit of band). The upper limit of the fit in was determined by the limit of the MLLA spectrum if this were less than the percentage range. In all cases the skew Gaussian describes the theory to better than 0.5%.
There are two points to be noted when making these fits: firstly the fitted parameters of the theory depend on the range of spectrum fitted. Secondly, fitting over a range greater than may mean that the skewness and kurtosis are not those of the distribution because the approximations made in deriving the expression become invalid. Consequently the the fitted parameters should be considered as simply a parameterization of the distributions rather than accurate measures of the skewness and kurtosis. Equally because the and kurtosis are correlated, the measured is fit-range dependent.
For skewness and kurtosis, Fig. 3, the DIS data are bracketed by the MLLA-M and MLLA-0 predictions as would be expected from the plots of Figure 2. The skewness predicted by MLLA-M is more positive than the data while MLLA-0 underestimates the skewness; for the highest both models approach the data. There is evidence of a systematic difference in the -dependence of the mean between the models and the data for the energy range studied here.
The dotted line shows the moments obtained from a fit to the massive MLLA spectrum obtained using the fitted and It is evident that a reasonable description of all moments other than the mean is obtained; the mean has an energy dependence that differs from that of the data.
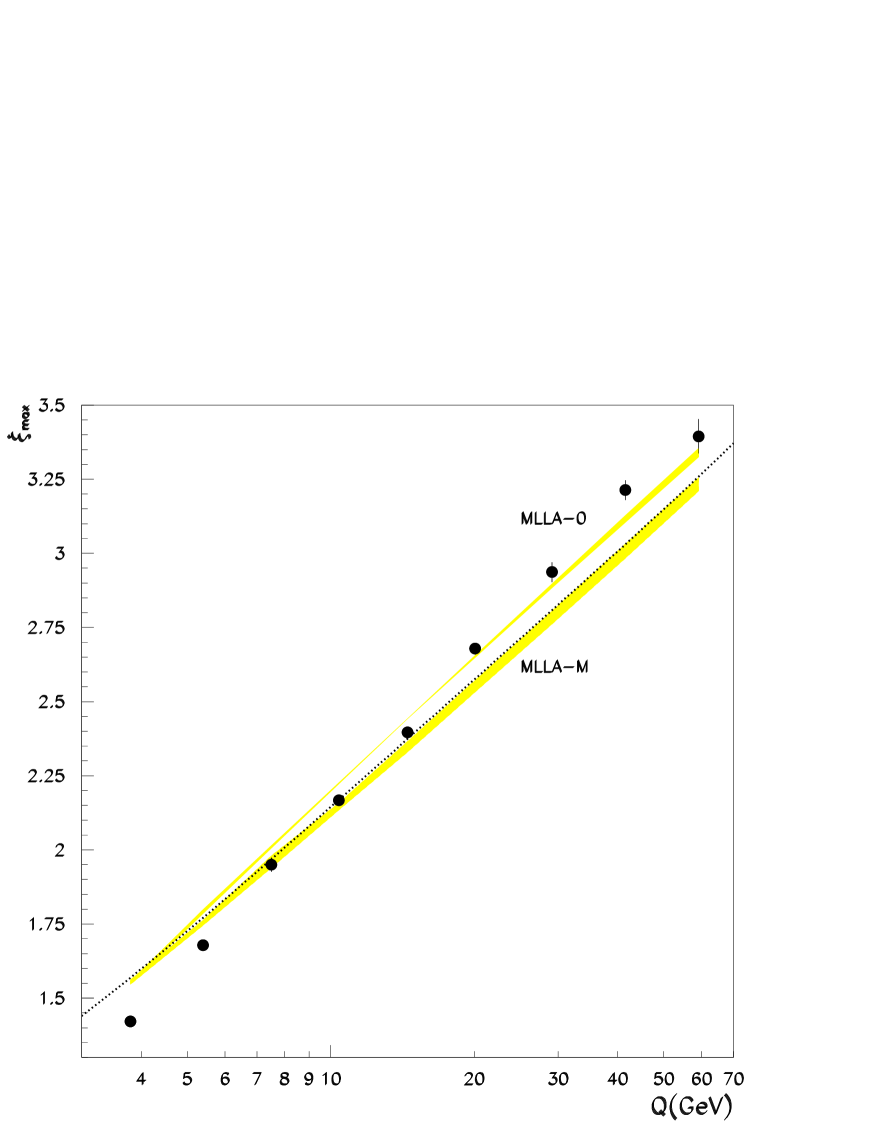
The energy dependence of the distribution has been explored further by studying the dependence of the peak position on This has the advantage, in comparison with the moments, that the maximum is relatively insensitive to the function used to parameterize the shape of the distribution. The -dependence of is shown in Figure 4. The shaded bands show the maxima derived from MLLA-0 and MLLA-M. For both cases the range of fit is from 30% to 80%. As before the dotted line uses the MLLA parameters and from the fit. This plot confirms that the energy dependence of the DIS data differs from that of any of the MLLA predictions.
A good fit of eqn. 6 to the from the experimental data can be achieved with (with set to zero), which is consistent with the value from the fit to the spectrum. However the value of is a factor two larger than expected and indicates again an inconsistency of the energy dependence of the data with the expectations of the MLLA.
These results are consistent with our previous analysis of data [4].
4 Conclusions
The HERA DIS data in the current fragmentation region of the Breit frame have been compared to the MLLA predictions as a function of In general, the data are well described within the LPHD-MLLA approach, with the predictions of MLLA-0 and MLLA-M bracketing the data. With increasing the various predictions of the MLLA converge on the data. A fit has been made to the data using the massive MLLA approach and values of and are found that give a reasonable description of the moments of the distribution.
In detail discrepancies are found between the theoretical predictions and the data. In particular, a consistent description of the evolution of the peak position of the distribution as a function of scale is not possible; no energy-independent combination of and is found that can describe the data.
Acknowledgements
The authors would like to thank Valery Khoze and Wolfgang Ochs for discussion and their many useful comments.
References
- [1] Yu. Dokshitzer et al., Sov. Phys. JETP 68 (1988) 1303.
- [2] V.A. Khoze and W. Ochs, Int. J. Mod. Phys. A12 (1997) 2949.
- [3] Ya. I. Azimov et al., Z. Phys. C27 (1985) 65 and C31 (1986) 213.
- [4] N. H. Brook and I. O. Skillicorn, Phys. Lett. B479 (2000) 173.
- [5] ZEUS Collab., J. Breitweg et al., Eur. Phys. C11 (1999) 251.
- [6] R. P. Feynman, ‘Photon-Hadron Interactions’, Benjamin, N.Y. (1972).
- [7] Yu. Dokshitzer, V. Khoze and S. Troyan, Int. J. Mod. Phys. A7 (1992) 1875.
- [8] A. Stuart and J. K. Ord, ‘Kendall’s Advanced Theory of Statistics’, Griffin (1987).
-
[9]
C. P. Fong and B. R. Webber, Phys. Lett. B229 (1989)
289;
C. P. Fong and B. R. Webber, Nucl. Phys. B355 (1991) 54. - [10] Yu. Dokshitzer et al., ‘Basics of Perturbative QCD’, Editions Frontières (1991).
-
[11]
Yu. Dokshitzer, V. A. Khoze and S. I. Troyan, J. Phys.
G17 (1991) 1602;
Yu. Dokshitzer et al., Phys. Lett. B273 (1991) 319. - [12] V. Khoze, S. Lupia and W. Ochs, Phys. Lett. B386 (1996) 451.