DFF 368/10/2000 Transverse momentum spectra of identified particles in high energy collisions with statistical hadronisation model
Abstract
A detailed analysis is performed of transverse momentum spectra of several identified hadrons in high energy collisions within the framework of the statistical model of hadronisation. The effect of the decay chain following hadron generation is accurately taken into account. The considered centre-of-mass energies range from 10 to 30 GeV in hadronic collisions (p, pp and Kp) and from 15 to 45 GeV in e+ecollisions. A clear consistency is found between the temperature parameter extracted from the present analysis and that obtained from fits to average hadron multiplicities in the same collision systems. This finding indicates that in the hadronisation, the production of different particle species and their momentum spectra are two closely related phenomenons governed by one parameter.
1 Introduction
The idea of a statistical approach to hadron production in high energy
collisions dates back to ’50s [1] and ’60s [2] and
it has been recently revived by the observation that hadron multiplicities
in e+ecollisions agree very well with a thermodynamical-like ansatz
[3, 4].
This finding has also been confirmed in hadronic collisions and it has
been interpreted in terms of a pure statistical filling of multi-hadronic
phase space of assumed pre-hadronic clusters (or fireballs) formed in
high-energy collisions, at a critical value of energy density [5].
In this framework, temperature and other thermodynamical quantities
have a statistical meaning which does not entail the existence of a
thermalised hadronic system on an event-by-event basis.
Stated otherwise, statistical equilibrium shows up only when comparing many
different events, whilst in each of them the Gibbs law of equally likely
multi-hadronic states applies.
So far, this proposed statistical cluster hadronisation model has been
mainly tested against measured abundances of different hadron species
for a twofold reason. Firstly, unlike momentum spectra, they are quantities
which are not affected by hard (perturbative) QCD dynamical effects but are
only determined by the hadronisation process; indeed, in the framework of
a multi-cluster model, they are Lorentz-invariant quantities which are
independent of the cluster’s overall momentum. Secondly, they are quite easy
to calculate and provide a very sensitive test of the model yielding an
accurate determination of the temperature. However, in order to establish
the validity of this approach, it is necessary to test further observables
and to assess their consistency with the results obtained for multiplicities.
Certainly, one of the best suited observables is the transverse momentum of
identified hadrons, where transverse is meant to be with respect to beam
line in high energy hadronic collision, and thrust or event axis in high
energy e+ecollisions. Indeed, such projection of particle momentum is
supposed to be the most sensitive to hadronisation or, conversely, the
least sensitive to perturbative QCD dynamics.
Actually, it has been known for a long time that transverse momentum
distributions are Boltzmann-like in hadronic collisions and this very
observation was pointed out by Hagedorn as a major indication in favour
of his statistical model of hadron production [6]. It must
be emphasized that the prediction of a thermal-like
shape in principle only applies to particles directly emitted from the
hadronising source, whereas measured spectra also include particles produced
by decays of heavier hadrons. However, most analyses do not take into account the
distortion of primordial hadronisation spectrum due the to hadronic decay
chain and try to fit the data straight through it. This problem has been
discussed in literature [7] and an analytical calculation
has been developed to take into account the effect of two and three body
decays [8, 9], which has then been used both for
pp [9] and heavy ion collision
[8, 9, 10] including most abundant resonances.
In this paper we introduce a method allowing to rigorously and exhaustively
determine the contribution of all particle decays. Hence, by taking
advantage of this technique, we have performed an analysis of many measured
transverse momentum spectra of identified hadrons in a wide range of
centre-of-mass energies for several kind of collisions.
2 Statistical hadronisation and transverse momentum spectra
The statistical hadronisation model [12] assumes that in high energy
collisions, as a consequence of strong interaction dynamics, a set of
colourless clusters (or fireballs) is formed having certain values of mass,
volume, internal quantum numbers and momentum, the latter being inherited
from the hard stage of the process. Those clusters are assumed to give rise
to hadrons according to a pure statistical law in the multi-hadronic phase
space defined by their mass, volume and quantum numbers. This approach differs
from another popular cluster hadronisation model [13] mainly because
it gives clusters a volume so that hadron production is ruled by the properly
understood phase space rather than relativistic momentum space. In this framework,
the use of statistical mechanics and thermodynamical quantities, such as
temperature, which need spacial dimension besides momentum space in order to
be meaningful, is allowed.
We emphasize once more that the introduction of such quantities does not
entail any thermalisation process of hadrons after their formation, nor
the existence of a thermalised system event by event.
Although many clusters with different momenta, volumes, masses and quantum
numbers are formed, it can be shown that the average values of many observables,
e. g. particle multiplicites, are the same as those relevant to one
equivalent cluster having suitable values of volume (namely the sum of all
cluster volumes measured in the rest frame of the equivalent cluster itself),
mass and quantum numbers (namely the sum of all cluster quantum numbers).
The proof of this statement [14], a lengthy one, requires the assumption
of special probabilities governing the fluctuations of cluster masses and quantum
numbers for a given set of volumes. If the volume (or mass) of the equivalent
cluster is large enough, it is then reasonable to take a canonical approach (i.e.
introducing a temperature) in order to calculate mean quantities, instead of
carrying out an involved microcanonical calculation. Therefore, even though actual
clusters are small sized and microcanonical calculations would be needed
to determine mean quantities within each of them, the choice of suitable
mass fluctuation probabilities for the clusters allows one to calculate overall
means dealing with only one large global structure and with much
fewer parameters. Arguing the other way around, it is not difficult to be
convinced that the fluctuation probabilities to be chosen in order to achieve
such reduction of the problem are exactly the same as those of obtaining a
given set of masses by splitting a large cluster into a given number of clusters
with volumes . This statement extends a reduction procedure
to the microcanonical case which was proved in the canonical case [5],
where, from the very beginning, clusters were given temperature and volume
instead of mass and volume.
Nevertheless, it is not obvious how large the equivalent cluster should be for
the canonical approximation to apply. For the present, we have adopted a
simple-minded a posteriori method consisting in justifying the canonical
framework by its capability of accordance with the data. A simple argument to
support the canonical approximation even at moderate values of volumes is the
very large number of states (), i.e. hadrons and resonances, which
can be excited in a hadron gas.
As far as single-particle transverse momentum spectra are concerned,
a similar reduction theorem from many clusters to one equivalent cluster
in the averaging procedure applies [14], though only approximately.
In general, it can be shown that the primary spectrum of
hadron species depends on transverse four-velocities
111In fact, we mean by transverse four-velocity the module of the
spacial part of a velocity four-vector with vanishing
longitudinal component. of the clusters:
| (1) |
where is the transverse four-velocities distribution function. If one expands all single-cluster spectra in series of starting from a common value for all clusters, it can be proved that, at the zeroth order, the spectrum in eq. (2) becomes the same as that obtained for the aforementioned equivalent cluster, endowed with a tranverse four-velocity . This reduction possibly allows taking the canonical approach in order to calculate the transverse momentum spectrum since the equivalent cluster size is much larger than single cluster’s:
| (2) |
where , is the temperature, and ,
are modified Bessel functions. Eq. (2) is the
Boltzmann limit of quantum statistics and it is a very good approximation
for all hadrons except pions [3].
For the zeroth order approximation in the expansion to be sufficiently
accurate, the involved transverse four-velocities should be small, i.e.
already for . Since
it is possible to choose the starting point of the series expansion
to make the first order term vanishing [14], the largest neglected term
turns out to be which is very small provided that the
aforementioned condition on is met. The analysis presented in this paper
assumes the validity of this approximation and primary spectra have been
calculated according to eq. (2).
Even though eq. (2) looks like the spectrum from a thermalised source
with a superimposed flow, a popular formula in the heavy-ion community, it is
well worth emphasizing that in fact this formula has nothing to do with flow.
Indeed, the average transverse four-velocity is not meant to be
the mean value of cluster velocity distribution in a single event;
rather, it is the average transverse four-velocity of all clusters over all
collision events. In other words, may well arise from single clusters
emitted at high in some events, e.g. following a hard parton scattering,
and does not imply by any means a collective event-by-event expansion.

3 Method of data analysis
A peculiar prediction of a statistical picture in high energy collisions which is relevant to transverse momentum spectra is the so-called scaling: there should be an apparent common slope for spectra of identified hadrons at a given centre-of-mass energy. By looking at eq. (2) one can easily realize that this holds in the limit . In principle, scaling applies only to primary hadrons, namely those directly emitted from the hadronising source. On the other hand, as stated in Sect. 1, most observed or reconstructed particles in experiments arise from decays of heavier hadrons. Those secondary decays may well distort the primary spectrum shape, thus spoling scaling. Nevertheless, it can be seen in fig. (1) that scaling apparently also holds for measured final hadrons, at least in the examined collision, implying seemingly little distortion from primary to final spectrum. Settling this and other related issues demands a thorough analysis taking into account the effect of decays. Therefore, measured spectrum of the hadron species should be compared with the sum of its primary spectrum and the contribution arising from all heavier hadrons decaying into it:
| (3) |
Whilst is given by eq. (2), the calculation of the second term in the right hand side of eq. (3) within a statistical-thermal framework is a very complicated problem as the number of contributing resonances and decay modes is huge and also owing the presence of cascade decays (e.g. ). In refs. [8, 9, 10] an analytical approach has been taken including two and three body decays of directly emitted resonances. On the other hand, we have adopted [15] a mixed numerical-analytical method which allows a very accurate and exhaustive calculation. Our method can be summarised as follows: for any couple of hadrons , where decays into , either directly or through a cascade process, we have determined the momentum spectrum in the equivalent cluster’s rest frame via a Monte-Carlo method by randomly generating 200,000 ’s decays, according to phase space, by picking ’s three-momenta from a thermal distribution with a given temperature :
| (4) |
Then, we have boosted the obtained distributions in order to compute the for a given transverse four-velocity of the equivalent cluster, to be plugged into eq. (3), with an integral formula derived by the authors [14]:
| (5) |
where F is the elliptic integral of the first kind and:
| (6) |
| collision | (GeV) | (MeV) | |||
|---|---|---|---|---|---|
| K+p | 11.5 | 176.92.6 | 5.850.39 | 0.3470.020 | 68.0/14 |
| p | 21.7 | 170.55.2 | 10.81.2 | 0.7340.049 | 39.7/7 |
| K+p | 21.7 | 175.85.6 | 8.481.05 | 0.5780.056 | 38.0/9 |
| pp | 27.4 | 162.61.6 | 14.170.66 | 0.6440.018 | 313.9/29 |
| collision | (GeV) | (MeV) | |||
| e+e | 14 | 167.310.4 | 9.72.6 | 0.7950.089 | 1.5/3 |
| e+e | 22 | 172.55.3 | 10.61.8 | 0.7670.091 | 1.0/3 |
| e+e | 29 | 159.01.8 | 17.31.1 | 0.7100.039 | 29.3/12 |
| e+e | 43 | 162.55.4 | 16.22.1 | 0.7680.064 | 3.0/3 |
The main advantage of formula (3) is to allow a quick computation of
transverse momentum spectra associated with particle decays for any tranverse
four-velocity once the corresponding momentum spectra at zero velocity are
known. To obtain it, we took advantage of the isotropy of
distributions, which holds as
long as decay products distribution is isotropic, which is true for
simple phase-space decays with no polarisation. The integration in
the variable in eq. (3) has been performed numerically.
The Monte-Carlo generation of
spectra, depending on the temperature, has been performed for all unstable
hadrons and resonances up to a mass of 1.8 GeV and it has been repeated for
temperature values between 140 and 190 MeV in steps of 1 MeV, so as to have a
large enough range of temperatures where to search for minima in a fitting
procedure. For any other temperature value, the spectra have been calculated
by means of a linear interpolation. Overall, for hadronic collisions, we
have generated about 1200 spectra associated to 144 unstable hadrons for
each value.
The abundances of all hadrons, which are needed to assess the
contribution of secondaries in the spectra of eq. (3), have been
preliminarly set to the model values calculated by fitting the parameters
, and or to the experimentally measured yields.
This procedure amounts to exclude the overall normalisation dependence of
on in the fit so to
keep only its shape dependence on .
Whilst the parameter has already extensively been used in
multiplicity fits [3, 4, 5], a new parameter is
introduced here for the strangeness suppression. The particle yields are
computed by constraining
the number of newly created pairs to fixed integers which fluctuate
according to a Poissonian distribution. The mean value of the Poissonian
distribution, namely the mean value of newly created pairs, is the
adjustable fit parameter . For the present, this new parametrisation
has been used only for hadronic collisions (see Table 1) because e+ecollisions present difficulties related to the production of heavy flavoured
quarks which makes calculations extremely slow. The mathematical
features of the parametrisation are described in detail in
ref. [14].
The fitted values, which update those in refs. [4, 5] for
hadronic and e+ecollisions are quoted in Table 1 222The
measurements used to perform this fit have been gathered through
the Durham reaction data database [18]; the relevant
references will be quoted in ref. [14].. The fitted temperature
in pp collision in the present analysis is somewhat lower compared with
ref. [5] owing to an updated set of hadron parameters [19],
an upgraded procedure of minimisation also taking into account
correlations in the effective variance method [20], as well
as the replacement of with . The fitted temperature values
show a very interesting trend consisting in a slight but significant increase
as centre-of-mass energy diminishes; this is in agreement with the observation
pointed out in ref. [21].
4 Data set and results for hadronic collisions
The collisions and relevant centre-of-mass energies to be analysed have been
primarily chosen on the basis of a fairly large number of measured particle
yields and spectra. Particle multiplicities are needed to establish
with some accuracy the contribution of secondary decays while many identified
hadron spectra allow performing a test of universality on the slopes governed
by and . This criterion led to singling out mainly four collision
systems for hadronic collisions: K+p at [22]
and 21.7 GeV [23], p at GeV [24]
and pp GeV [25]. For each identified particle transverse
momentum spectrum, three free parameters have been determined by fitting
eq. (3) to the data: , and an overall normalisation parameter
. The fits have been performed in the variables or according to the
available experimental spectrum; henceforth, we will denote by
both and . As we have mentioned before, overall
multiplicities of hadrons in eq. (3) have been fixed to model values
by using fit parameters in Table 1.
The fit is performed by minimising the following :
| (7) |
The errors in the denominator of eq. (7) have been taken as the sum in quadrature of experimental errors and errors arising from the uncertainty on masses, widths and branching ratios of hadrons decaying into the examined hadron, according to the effective variance method (see ref. [14] for a detailed description).
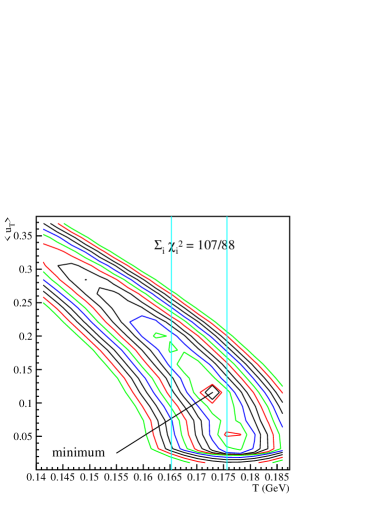
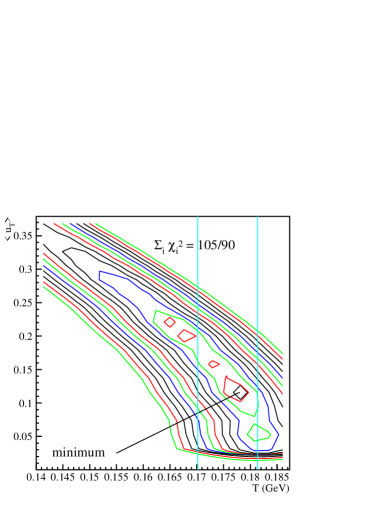
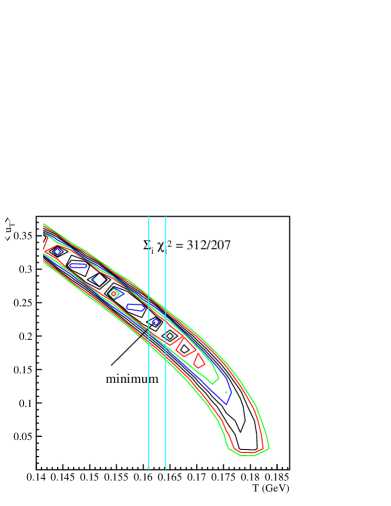
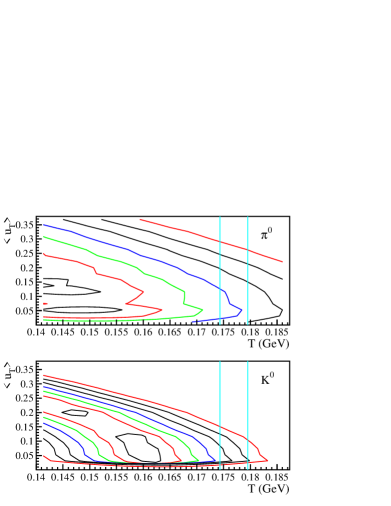
Once the normalisation parameter is fitted, a study of contour lines is performed in the plane in order to look for possible local minima. Indeed, the presence of several local minima along a band is a quite general feature of the (see fig. (2)) owing to the strong anticorrelation between and . Hence, different solutions are possible for the pair. In order to enforce universality of such parameters among different hadron species we have chosen a solution for each particle according to the following procedure:
-
1.
firstly, we have determined the contour lines of as a function of and by fixing all normalisation parameters to their fitted values, where is the number of different hadron species spectra for a given collision. The minimisation of the sum of all ’s amounts to fit a common value of and for all measured hadrons.
- 2.
-
3.
finally, all single particle spectrum fits have been repeated seeking a local minimum as close as possible to the previously determined minimum.
It must be noted that this procedure aims at achieving the best agreement between temperatures determined by using different observables, namely particle yields and transverse momentum spectra. The contour plots are shown in figs. (3,4,5) for the examined collisions. There is a good agreement between the obtained from multiplicities and the location of minima in the plane. For K+p and p at GeV the absolute minimum lies nearly about the centre of the band demonstrating an intriguing correlation between the slope of transverse momentum distributions and the slope of average multiplicities as a function of mass. Moreover, the values turn out to be small, thus justifying the series expansion described in Sect. 2. Conversely, in K+p collisions at GeV a clear disagreement emerges for K+p at GeV between differently determined temperatures (see fig. (6)) which can be explained with the inadequacy of our used parametrisation at low energy where exact conservation, neglected in the canonical framework, is expected to play a significant role.
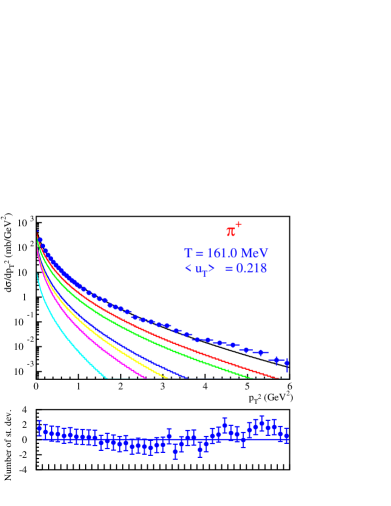
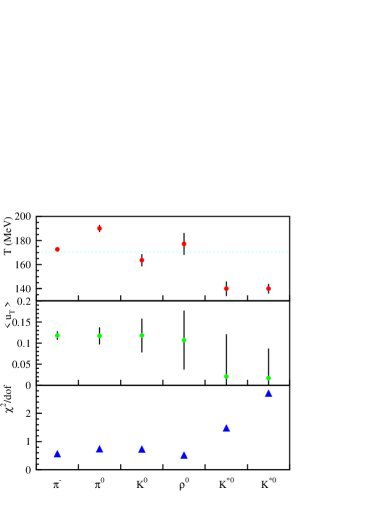
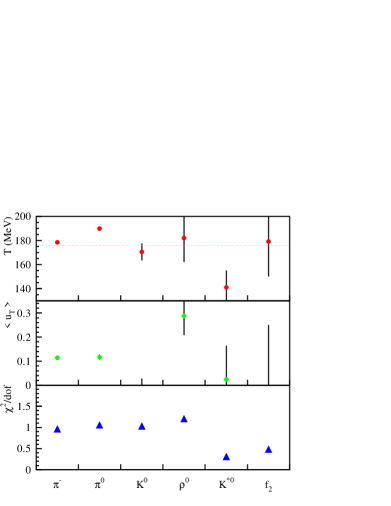
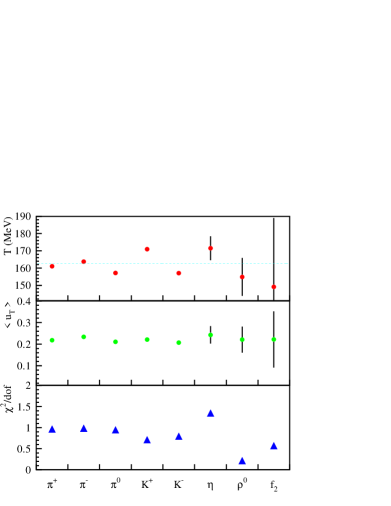
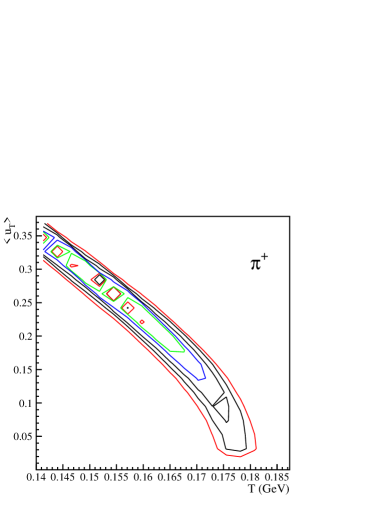
The summary plots of the single particle fits are shown in figs. (8, 9,10) while an example of fitted spectrum in pp collisions is shown in fig. (7). In general, very good fits (low ’s) are obtained with good agreement between temperatures and average transverse boost velocities fitted for different identified hadrons, especially in pp collisions. Some discrepancies show up in K+p and p collisions where K∗’s seem to have slopes steeper than expected. It must be noted that error estimates for and are still very rough.
5 Results for e+ecollisions
We have also performed a similar analysis for e+ecollisions at centre-of-mass energies between 14 and 44 GeV. Compared with hadronic collisions, the analysis of e+edata presents several additional difficulties. First of all, the production of heavy flavoured hadrons can not be neglected and the inclusion of many more decay channels is implied. A major issue is the fact that is defined with respect to the so-called thrust or event axis. This direction is not known a priori, unlike in hadronic collisions where is defined with respect to the beam line, and must be determined on an event by event basis. Hence, whatever the algorithm being used, this very fact introduces a bias on transverse momentum spectra because momenta projection are used to determine the event or thrust axis itself; often, this is done by just minimising the sum of particle ’s.
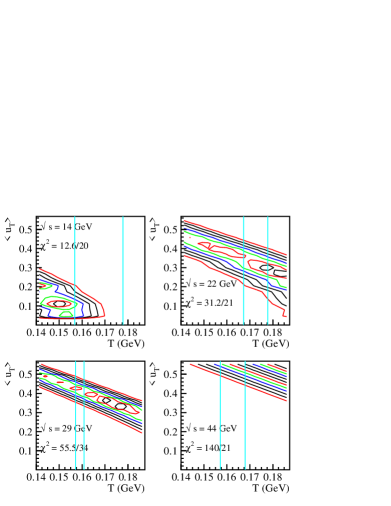
In spite of this problem, we have repeated the same analysis performed for hadronic collisions by using measured charged tracks transverse momentum spectra [26] with respect to thrust axis. The contour plots are shown in fig. (11) along with bands obtained from multiplicity fits and resulting ’s minima. It can be seen that no minimum is found within the band for e+ecollisions at GeV, a situation looking very similar that found in K+p collision at GeV. It is also found that fitted increases quite rapidly with centre-of-mass energy reflecting the rise of average of gluon radiation. Since our parametrisation of transverse momentum spectra with an average transverse four-velocity requires to be (see discussion in Sect. 2), it is quite natural that fit quality deteriorates as centre-of-mass energy increases. This is indeed found already at 44 GeV where cannot longer be considered small. As energy increases, particle spectra become sensitive to the shape of clusters distribution (related in turn to radiated gluon spectrum) and not only to its mean value. Further on, they become dominated by the shape of gluon radiation spectrum whilst hadronisation plays the role of a small superimposed noise.
6 Discussion and conclusions
The analysis of transverse momentum spectra of several identified hadrons,
accurately taking into account the effect of hadron decays, indicates
that they can be well reproduced within the statistical hadronisation
model for several high energy hadronic collisions. Furthermore, a good
agreement is found between the temperatures
estimated by fits to average particles multiplicities and those extracted
by fitting transverse momentum spectra. This can be seen especially by
comparing figs. (3,4,5); in fact, the
location of the best value for transverse momentum spectra, determined
by ’s lowest contour line, is apparently correlated to the best
value defined by particle multiplicities as spotted by the vertical
band. Indeed, those temperatures move toghether from MeV
in pp collisions at 27.4 GeV to MeV in p
and K+p collisions at 21.7 GeV. In our view, this finding
is a strong indication in favour of one of the key predictions of the
statistical hadronisation
model, namely the existence of a close relationship between the laws
governing the production of particles as a function of their mass and,
for each particle species, the production as a function of momentum
(measured in the rest frame of the cluster they belong to) at the
hadronisation.
Besides this main conclusion, there are many remarks to be made. First
of all, our calculations assumed a canonical framework and so they are
expected to have only a limited validity at low centre-of-mass energies
where the effect of exact transverse momentum conservation must show up.
Indeed, in e+ecollisions at a centre-of-mass energy of 14 GeV and K+p
collisions at 11.5 GeV, a clear disagreement is found between the
temperatures determined in the two fashions (see fig. (6)).
Secondly, whilst the results obtained in pp collisions for different
particles are in very good agreement among them,
there are some significant discrepancies between different particles in
p and K+p collisions, especially for K∗’s, which are not
understood at the present. Finally, it is evident in the analysis of
moderately high energy e+ecollisions, at 44 GeV, that our
parametrisation of transverse momentum spectra as a function of an average
transverse four-velocity alone, is not accurate enough. As the average
of radiated gluons and, as a consequence, of hadronising clusters,
rises, particle spectra are influenced more by the shape of clusters
transverse four-velocity spectrum than by primordial hadronisation spectrum
so that more accurate calculations are needed involving perturbative QCD
to perform such an analysis.
Finally, in the very high energy regime, spectra become insensitive
to hadronisation and, as a consequence, it is no longer interesting to
study its properties. In summary, the presently used
parametrisation of spectra is found to work well only in a limited
centre-of-mass energy range (roughly between 20 and 30 GeV). At lower
energies, the study of is still of great interest in probing the
statistical features of hadronisation but complex microcanonical
calculations are required. At higher energy, hadronisation is swamped
by hard QCD dynamics in spectra and all it can do is to add
a little smearing.
Acknowledgments
We would like to thank the organizers of the ”Correlations and fluctuations” conference in Torino. We are grateful to U. Heinz and U. A. Wiedemann for clarifying discussions. Many thanks to J. A. Baldry for the careful revision of the manuscript. This work would have not been possible without the great Durham reaction data database; we wish to express our gratitude to their editors and curators.
References
- [1] E. Fermi, Progr. Theor. Phys. 5 (1950) 570.
- [2] R. Hagedorn, Nuovo Cimento 15 (1960) 434.
- [3] F. Becattini, Z. Phys. C 69 (1996) 485.
- [4] F. Becattini, Proc. of XXXIII Eloisatron Workshop on ”Universality Features in Multihadron Production” (1996) 74.
- [5] F. Becattini and U. Heinz, Z. Phys. C 76 (1997) 269.
- [6] R. Hagedorn, ”Hot Hadronic Matter: Theory and Experiment” (1994) 13.
- [7] R. Hagedorn, Riv. Nuovo Cimento 6 (1984) 1983.
- [8] J. Sollfrank, P. Koch and U. Heinz, Phys. Lett. B 252 (1990) 256.
- [9] J. Sollfrank, P. Koch and U. Heinz, Z. Phys. C 52 (1991) 593.
- [10] U. A. Wiedemann and U. Heinz, Phys. Rev. C 56 (1997) 3265.
- [11] T. Peitzmann, Nucl. Phys. A 638 (1998) 415c.
- [12] for a description of the model in the canonical approximation see F. Becattini, Proc. of XI Chris Engelbrecht summer school ”Hadrons in dense matter and hadrosynthesis” (1998) 71.
- [13] G. Marchesini and B. Webber, Nucl. Phys. B 238 (1984) 1.
- [14] F. Becattini, L. Bellucci and G. Passaleva, in preparation.
- [15] F. Becattini, L. Bellucci, G. Passaleva, Proc. of XXIX International Symposium on Multiparticle Dynamics (1999) 220.
- [16] P. Chliapnikov, private communication.
- [17] M. Aguilar-Benitez et al., Z. Phys. C 50 (1991) 405.
- [18] The Durham reaction data database, http://durpdg.dur.ac.uk/HEPDATA/REAC.
- [19] Particle Data Book, C. Caso et al, Eur. Phys. J. C 3 (1998) 1.
- [20] F. Becattini, M. Gazdzicki and J. Sollfrank, Eur. Phys. J. C 5 (1998) 143.
- [21] M. I. Gorenstein, M. Gazdzicki and W. Greiner, Phys. Lett. B 483 (2000) 60.
-
[22]
M. Barth et al., Z. Phys. C 22 (1984) 23
M. Barth et al., Nucl. Phys. B 191 (1981) 39. -
[23]
M. Adamus et al., Z. Phys. C 35 (1987) 7
N.M. Agababyan et al., Z. Phys. C 41 (1989) 539
M. Adamus et al., Z. Phys. C 39 (1988) 311
I.V. Azhinenko et al., Z. Phys. C 46 (1990) 525. -
[24]
M. Adamus et al., Z. Phys. C 35 (1987) 7
N.M. Agababyan et al., Z. Phys. C 46 (1990) 387
M. Adamus et al., Z. Phys. C 39 (1988) 311
I.V. Azhinenko et al., Z. Phys. C 46 (1990) 525. -
[25]
M. Aguilar-Benitez et al., Z. Phys. C 50 (1991) 405; numerical
values of spectra can be found in Durham reaction data database
[18]
A. Suzuki, Lett. Nuovo Cimento 24 (1979) 31. -
[26]
M. Althoff et al., TASSO Coll., Z. Phys. C 22 (1984) 307
D. Bender et al., HRS Coll., Phys. Rev. D 31 (1985) 1
W. Braunschweig et al., TASSO Coll., Z. Phys. C 47 (1990) 187.