Equation of state of resonance-rich matter in the central cell in heavy-ion collisions at A GeV
Abstract
The equilibration of hot and dense nuclear matter produced in the central cell of central Au+Au collisions at RHIC (A GeV) energies is studied within a microscopic transport model. The pressure in the cell becomes isotropic at fm/ after beginning of the collision. Within the next 15 fm/ the expansion of matter in the cell proceeds almost isentropically with the entropy per baryon ratio , and the equation of state in the plane has a very simple form, . Comparison with the statistical model of an ideal hadron gas indicates that the time fm/ may be too short to reach the fully equilibrated state. Particularly, the creation of long-lived resonance-rich matter in the cell decelerates the relaxation to chemical equilibrium. This resonance-abundant state can be detected experimentally after the thermal freeze-out of particles.
pacs:
PACS numbers: 25.75.-q, 24.10.Lx, 24.10.Pa, 64.30+tI Introduction
The assumption that strongly interacting hadronic (or rather partonic) matter, produced in nucleus-nucleus collisions at high energy, can reach a state of local equilibrium (LE) [2, 3, 4] is one of the most important topics in relativistic heavy-ion program [5]. The degree of equilibration can be checked by fitting the measured particle yields and transverse momentum spectra to that of the thermal model in order to extract the conditions of the fireball at the chemical and thermal freeze-out (see, e.g., [6, 7, 8, 9, 10, 11, 12, 13] and references therein). Here the equilibrium particle abundances, which correspond to a certain temperature, , baryon chemical potential, , and strangeness chemical potential, , can be determined. However, the analysis is complicated, e.g., by the presence of collective flow of particles and the non-homogeneity of the baryon charge distribution in the reaction volume. The volume of the fireball is also taken as a free parameter in the thermal model. Various non-equilibrium microscopic transport-, string-, partonic-, etc. models have been applied to verify the appearance of at least local equilibrium in the course of heavy-ion collisions at relativistic and ultrarelativistic energies [14, 15, 16, 17, 18, 19, 20, 21, 22, 23, 24, 25]. To reduce the number of unknown parameters and simplify the analysis it has been suggested [21, 22] to examine the equilibrium conditions in the central cell of relativistic heavy-ion collisions, simulated by one of the microscopic models. For these purposes we employ the microscopic Ultra-relativistic Molecular Dynamics (UrQMD) transport model, which nicely describe the available experimental data on hadron-hadron and nucleus-nucleus collisions in a broad energy range [23].
The central cell of symmetric heavy-ion collisions is a convenient system because the velocity of its center of mass is essentially zero. The cell should be neither too small nor too large. Previous studies at energies from 10.7A GeV (AGS) to 160A GeV (SPS) [21, 22] have shown that the cubic cell with volume fm3 is well suited for the analysis. The aim of the present paper is to study the relaxation of hot nuclear matter, simulated within the microscopic model, in the central cell in Au+Au interactions at RHIC (A GeV) energy.
The paper is organized as follows. The conditions of kinetic equilibrium in the cell are discussed in Sec. II. Section III describes the statistical model (SM) of an ideal hadron gas employed for the comparison with the microscopic calculations. The relaxation of hot nuclear matter in the cell to thermal and chemical equilibrium is studied in Sec. IV. Finally, conclusions are drawn in Sec. V.
II Kinetic equilibrium
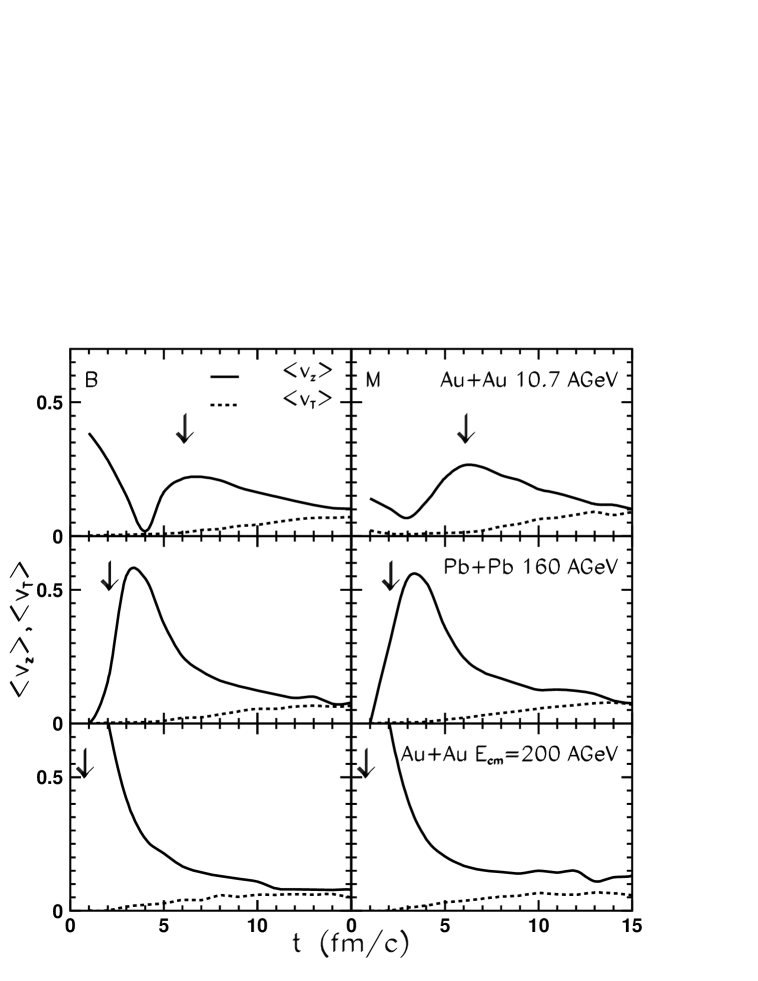
First, the kinetic equilibrium has to be verified. The collective flow in the cell should be isotropic and small, so it cannot significantly distort the momentum distributions of particles. As shown in Fig. 1, the average longitudinal velocity in the central cell at RHIC energies reaches its maximum at fm/ after the Lorentz-contracted nuclei have completely passed through each other. The longitudinal flow rapidly drops and converges to the developing transverse flow. The longitudinal collective velocity of particles becomes smaller than at fm/ at RHIC, while the similar process takes fm/ at the AGS and SPS energies. This gives a small correction, only MeV for the nucleon spectra, and less than a MeV for pions, whereas the characteristic temperatures are around 140 MeV.
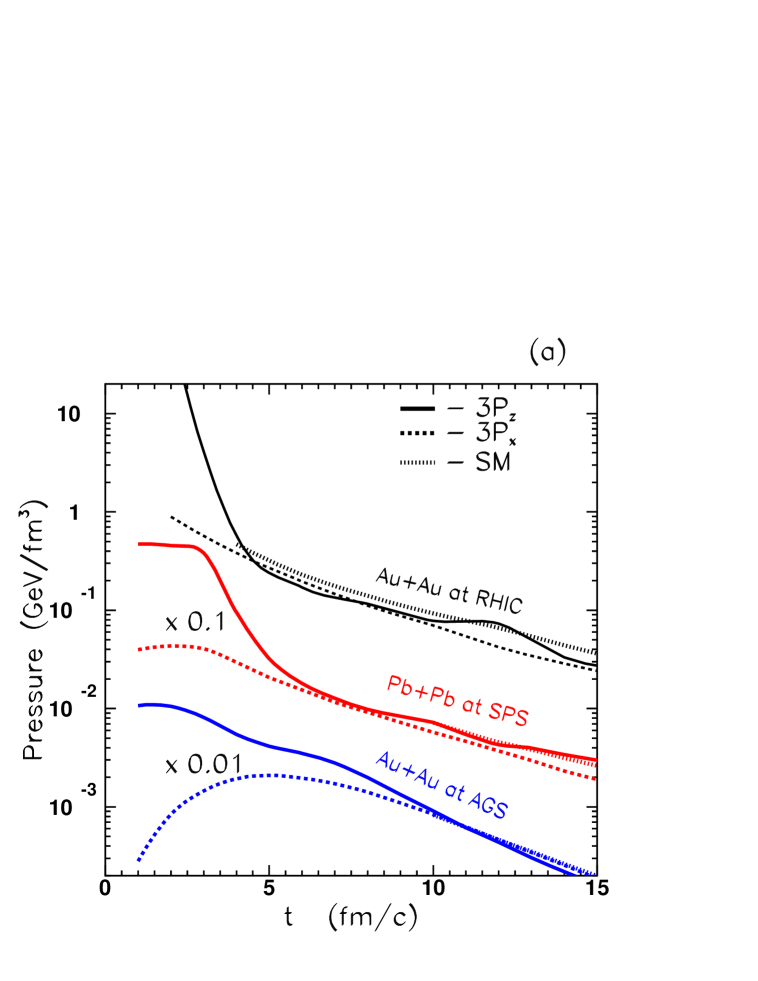
Velocity distributions of hadron species become isotropic and nearly Maxwellian quite soon [21, 22]. Isotropy of the velocity distributions results in pressure isotropy. The pressure in the longitudinal direction in the cell, calculated according to virial theorem [26], is compared in Fig. 2(a) with the transverse pressure. The time of convergence of longitudinal pressure to the transverse one decreases from 10 fm/ to 5 fm/ with rising incident energy from AGS to RHIC, respectively. Thus, the kinetic equilibrium in the central cell in Au+Au collisions at RHIC energy is reached at fm/.
III Statistical model of an ideal hadron gas
To verify that the matter in the cell is in thermal and chemical equilibrium one has to compare the snapshot of hadron yields and energy spectra in the cell with the equilibrium spectra of hadrons obtained in the statistical model (SM) of an ideal hadron gas containing essentially the same number of baryonic and mesonic degrees of freedom [24]. We recall the procedure briefly: the values of energy density, , baryon density, , and strangeness density, , extracted from the microscopic calculations in the cell, are used as an input to the system of nonlinear equations of the SM
| (1) | |||||
| (2) | |||||
| (3) |
containing the baryon charge, , and strangeness, , of the hadron species . This procedure enables one to determine temperature, , baryon chemical potential, , and strangeness chemical potential, . If the set of three parameters is fixed, all macroscopic characteristics of the equilibrated system can be determined unambiguously. For instance, the particle yields, , total energy, , and pressure, , are calculated within the SM via the Gibbs distribution function
| (4) |
where and are the momentum and the mass of the hadron species , respectively. Namely,
| (5) | |||||
| (6) | |||||
| (7) |
with being the degeneracy factor. The entropy density can be determined either via the distribution function (4)
| (8) |
or directly from Gibbs thermodynamical identity
| (9) |
The chemical potential of the th hadron is determined by its baryon and strangeness charge, . Thermal and chemical equilibrium is assumed to occur in the cell when the spectra of hadrons in the microscopic cell calculations become close to the spectra predicted by the SM.
IV Relaxation to chemical and thermal equilibrium
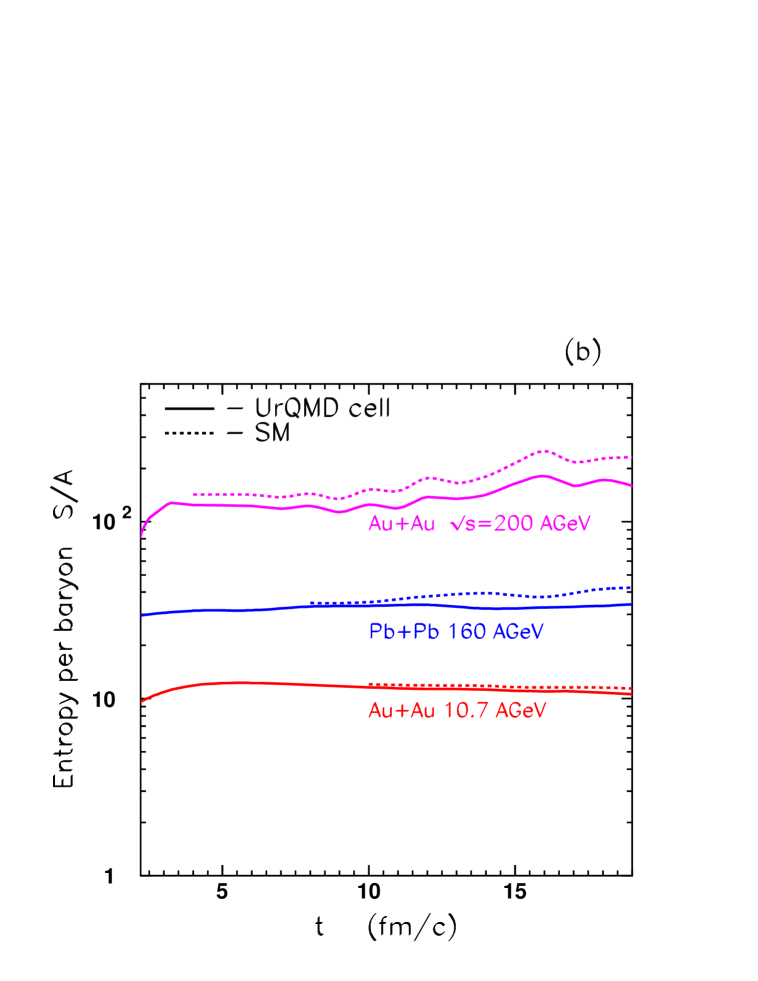
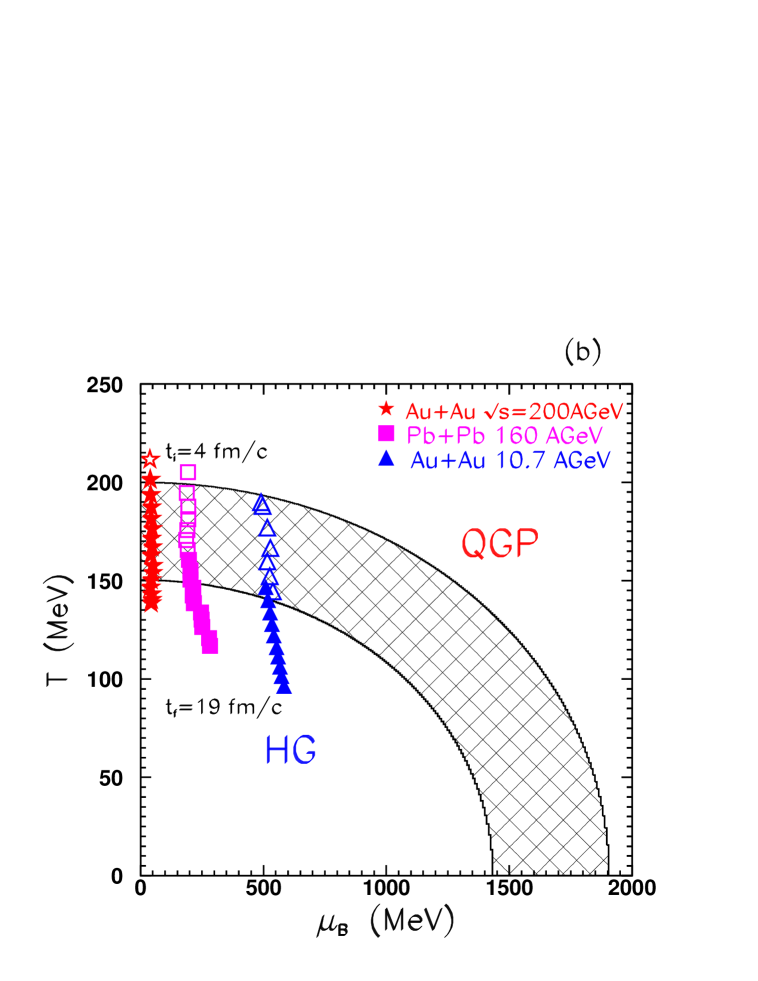
At the isotropic stage the total microscopic pressure is close to the grand canonical pressure, , as shown in Fig. 2(a). Both pressures converge at about fm/, which is chosen as a starting point for the comparison with the SM. The input, , and output, , parameters are listed in Table I together with the microscopic pressure, entropy density, and entropy per baryon in the cell. The final time of the calculation, defined from conventional freeze-out conditions GeV/fm3 or [22], corresponds to fm/. One may see that in spite of different initial conditions the freeze-out time in the central cell in heavy-ion collisions at RHIC energies is similar to corresponding freeze-out times at AGS [21] and SPS [22] energies. In accordance with general estimates [9, 27] the baryochemical potential at RHIC energies is small while the temperatures are well above the anticipated temperature for the QCD phase transition, MeV. The entropy per baryon in the cell varies slightly after the beginning of the kinetic equilibrium stage. A comparison with at lower energies is shown in Fig. 2(b). The hadron-string matter in the central cell seems to expand isentropically with (AGS), 32 (SPS), and 150 (RHIC). Note that the results of the simulations at AGS and SPS energies are intriguingly close to the entropy per baryon values extracted from the thermal model fit to experimental data, namely, and [9]. It is most interesting to compare the predicted value to the upcoming RHIC data. Together, isotropy in the pressure sector, isotropic and nearly Maxwellian velocity distributions of hadrons, and almost isentropic expansion of matter in the central cell strongly support the idea that a hydrodynamic regime is established after a certain time. In the following, we extract the equation of state (EOS) of hadron-resonance-string matter from the microscopic simulations at the quasi-equilibrium stage of nuclear collisions, which is part of this hydrodynamic picture.
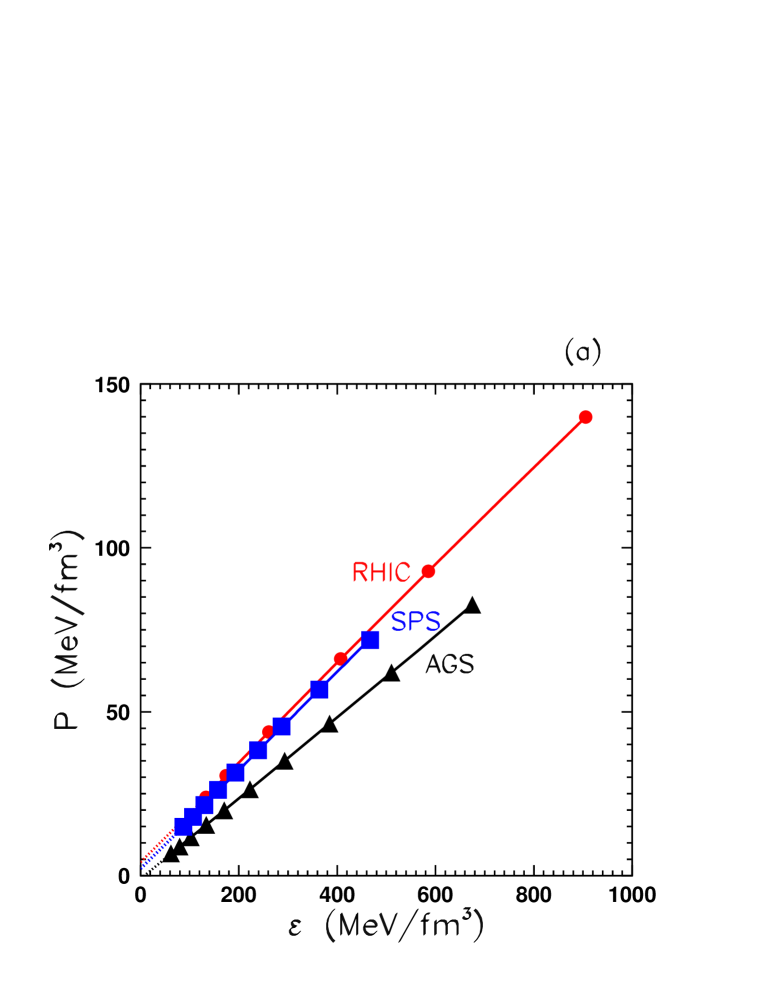
The evolution of the pressure with the energy density is depicted in Fig. 3(a) for AGS, SPS, and RHIC energies in the central cell, respectively. Several interesting facts can be gained from this figure. First, the pressure drops linearly with the decreasing energy density for all three energies. It means that the ratio remains constant for the whole time interval of the (quasi)equilibrium stage. Thus the equation of state in the plane has a very simple form: at AGS, and at SPS and RHIC. We see that despite the significant difference in the center-of-mass energy of the nuclei, colliding at A GeV vs. A GeV, the ratio in the central cell is saturated already at SPS energies.
Figure 3(b) presents the evolution of the EOS in the plane. The baryon chemical potential in the cell increases with decreasing temperature at AGS and SPS energies, but remains almost constant (and small) at RHIC. Also, all three curves can be well approximated by a simple linear dependence. This fact deserves explanation. Substituting in Eq. (9) and omitting the term , because the net strangeness density in the cell is quite small, we get
| (10) |
If the ratio is constant, then the temperature would depend linearly only on the baryon chemical potential , and vice versa. However, the energy per baryon slightly decreases within the considered time interval for all three energies. At the final stage it drops to approximately 80-90% of its initial value. Therefore, from Fig. 3(b) it follows that the evolution of temperature as a function of and is mainly determined by the change of energy per baryon, and not the baryon chemical potential.
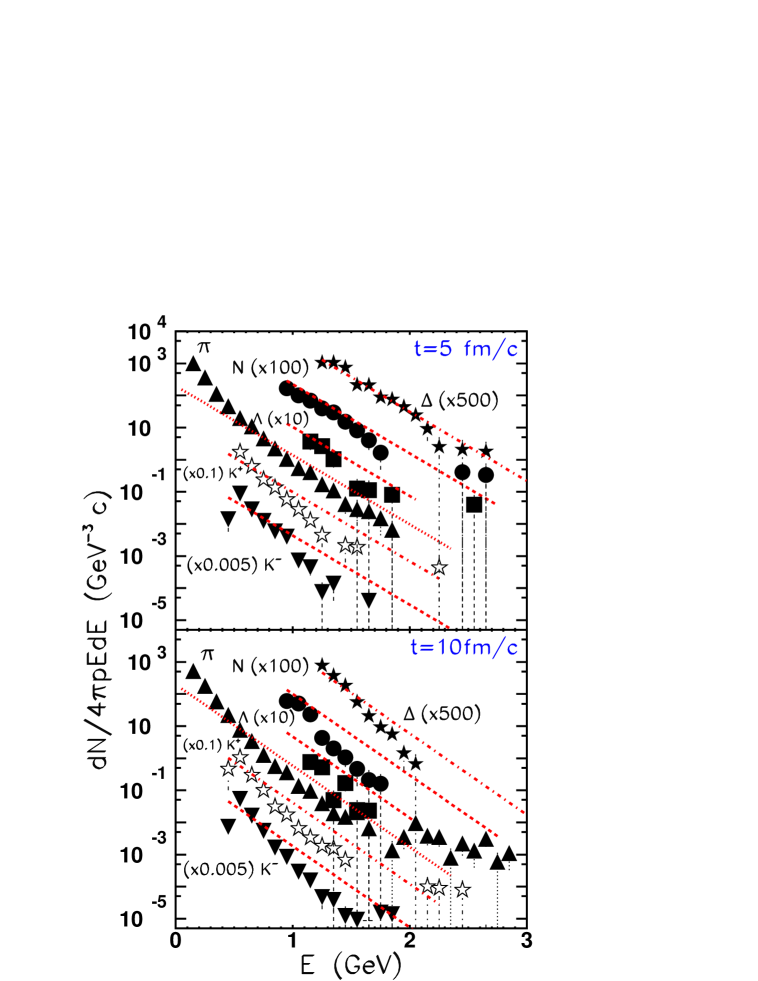
Energy spectra, , of ’s, ’s, ’s, ’s and ’s in the cell at the stage of kinetic equilibrium are shown in Fig. 4 at two different times, fm/ and fm/ at RHIC energies. At fm/ the spectra of baryons seem to be in a reasonable agreement with those of the SM, while the slopes of the meson spectra are steeper compared to the predictions of the statistical model. This means, that the apparent temperatures of mesons, especially pions, are lower than the temperature given by the SM. Moreover, the energy spectra of pions can be decomposed on two components representing low and high energy pions. At fm/ the fit by two exponents to the pion spectrum yields the temperatures MeV and MeV, while at fm/ the results of the fit are MeV and MeV, respectively. Although the apparent temperature of pions from the high energy tail of the energy spectrum is closer to the temperature given by the SM, MeV, one may conclude that the thermal equilibrium in the central cell is not reached yet. The slopes of baryon spectra in the microscopic calculations at fm/ are also steeper than the SM slope. Since the energy density is the same in both models, the lower temperatures of hadronic spectra in the microscopic case indicate that the hot matter in the cell is not in chemical equilibrium. Therefore, one might expect that the fractions of mesons and resonances in the UrQMD cell are overpopulated. These extra-particles consume significant part of the total energy and effectively ”cool” the hadron cocktail. The reheating proceeds via the absorption of mesons in the processes like , or , etc. Thus, our next step is to study the time evolution of hadron abundances in the cell. Note also that the difference between the temperatures of meson and baryon spectra can be explained by the fact that baryons experience many more elastic collisions and interactions with the resonance production per particle, which drive the system toward thermal equilibrium, than mesons. The mean number of interactions per, e.g., nucleon or delta increases from 5 interactions at fm/ to 10 interactions at fm/. In contrast, pions (kaons), which are readily absorbed and produced by the resonance-string hadron matter, suffer only 0.5 (1) elastic collision per particle at fm/ and 1.8 (2.5) ones at fm/.
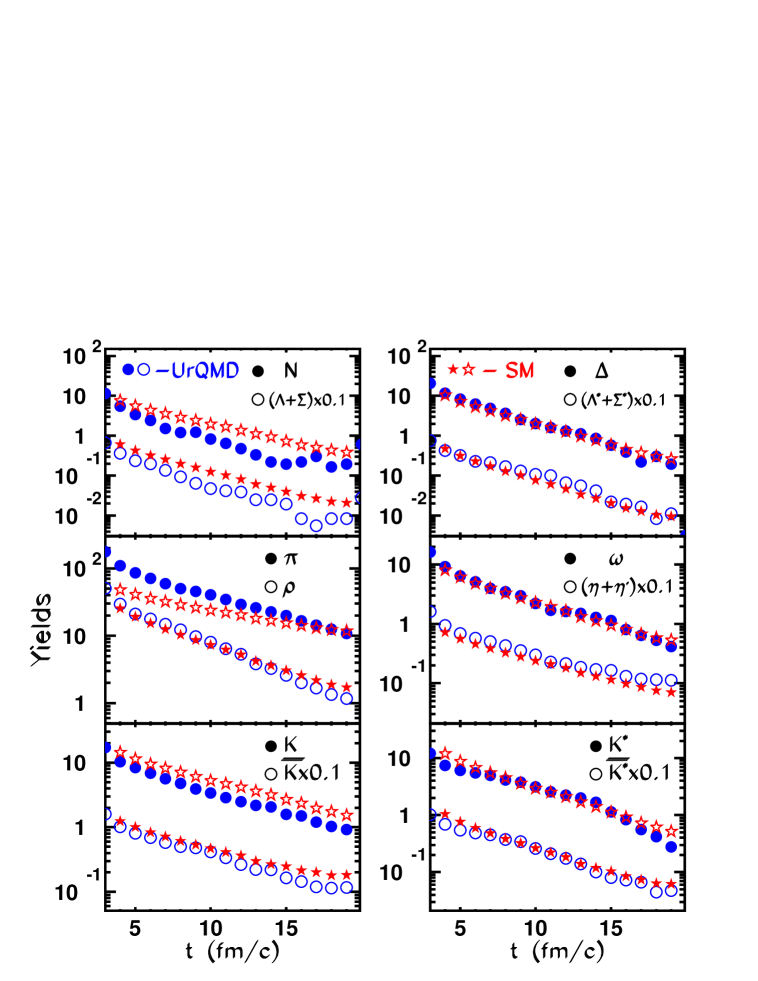
Figure 5 depicts the yields of the main hadron species in the cell within the time interval 5 fm/ 19 fm/. It is interesting that microscopic spectra of pions, which are underestimated by the SM in the central cell at lower energies [22], converge to the SM predictions at fm/. Also, the statistical model overestimates yields of nucleons, lambdas, and kaons, while the yields of both baryon and meson resonances are reproduced quite well. Since the baryon number and the strangeness are conserved in strong interactions, where is the rest of the hypercharge, , in the UrQMD calculations in the cell? As seen from Table II, where the partial densities of baryons and antibaryons in the microscopic and macroscopic model are listed (the net values are listed in Table I), the total yields of baryons and antibaryons in the SM are larger than those of the UrQMD. The hadron-resonance-string matter in the cell is not in chemical equilibrium; that is why the density of antibaryons is 2-3 times smaller than the equilibrium values. The results on strangeness densities are listed in Table III for the strange baryons, mesons, and their antiparticles, respectively. Here the net strangeness is . In line with the previous observation, the SM predicts significantly larger abundances of both strange baryons and strange antibaryons at fm/ in the cell, while the densities of strange mesons are pretty similar. It is worth noting here that strangeness is underpredicted by the UrQMD if compared to experimental data at SPS energies, see [28]. At fm/ the situation turns around: microscopic yields of strange baryons become closer to those of the SM, but the predictions for strange mesons diverge. Note also that up to fm/ the net strangeness of baryons in microscopic calculations is larger compared to the net strangeness of baryons in the SM at the expense of the net mesonic strangeness. After fm/ the fractions of the net strangeness deposited in baryonic and mesonic sectors in the microscopic calculations coincide with the SM results.
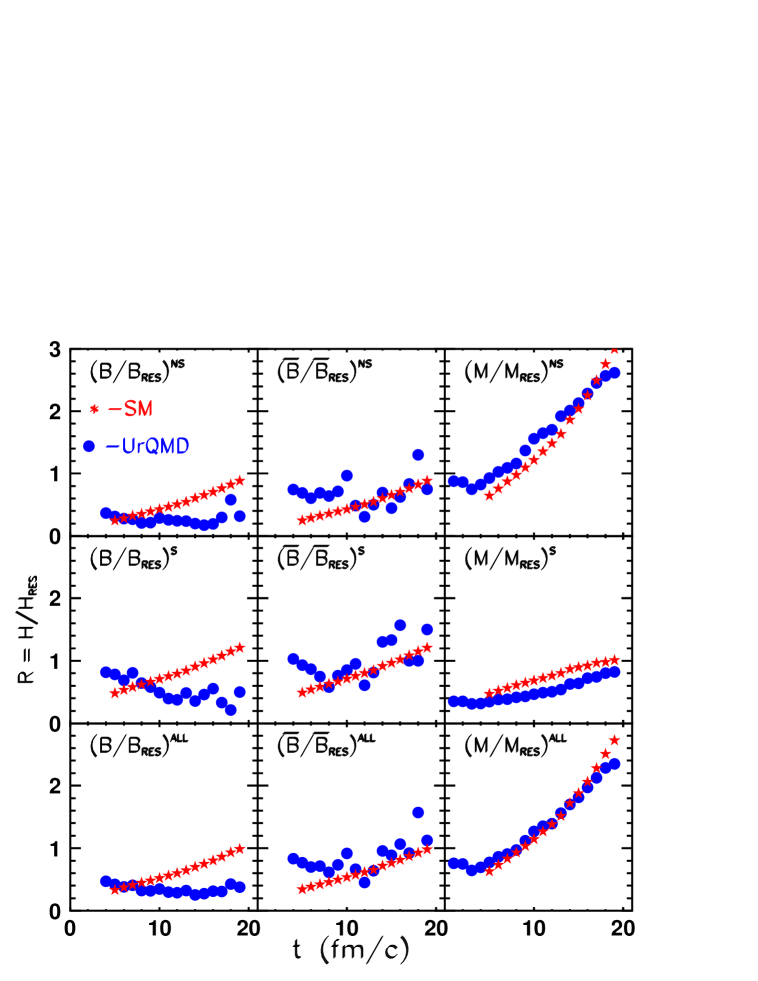
Finally, the ratios of hadronic abundances are studied (see Fig. 6). Here the results are presented separately for non-strange and strange baryons and mesons. In the baryon sector the resonances dominate over the strange and non-strange baryons until the end of the simulations. This can be taken as an indication of the creation of long-lived resonance-rich matter. Recall that the formation of resonance abundant matter plays an important role in the evolution of the system produced in nuclear collisions at lower bombarding energies [29]. It has been suggested that the significance of the resonances, mainly ’s, for the system development should be diminished with rising center-of-mass energy of the collisions. This assumption is not confirmed in our simulations. The fraction of baryon resonances is almost 70% of all baryons in the cell at RHIC at fm/, while at SPS and AGS the number of baryon resonances decreases from 70% to 35%, and from 60% to 25%, respectively. The meson fractions of resonances shrink within the time interval fm/ from 60% to 30% (RHIC), 50% to 20% (SPS), and 40% to 15% (AGS). But at RHIC energies the hot hadronic matter in the cell as well as in the whole volume of the reaction is meson dominated. The mesons, baryons, and antibaryons carry 90%, 7%, and 3% of the total number of particles in the RHIC cell at fm/ (cf. 85%, 14.5%, 0.5% at SPS and 50%, 50%, 0% at AGS). The microscopic ratios for mesons (Fig. 6, right panels) seem to be very close to the SM ratios. However, one has to keep in mind that the temperatures given by the SM fit are 40-50 MeV higher than the apparent temperatures of meson species. Since the freeze-out occurs at fm/ in the central cell at RHIC energies, the matter in the cell is frozen before reaching thermal and chemical equilibrium. This circumstance significantly complicates the extraction of the chemical and thermal freeze-out parameters by means of the standard thermal model fit.
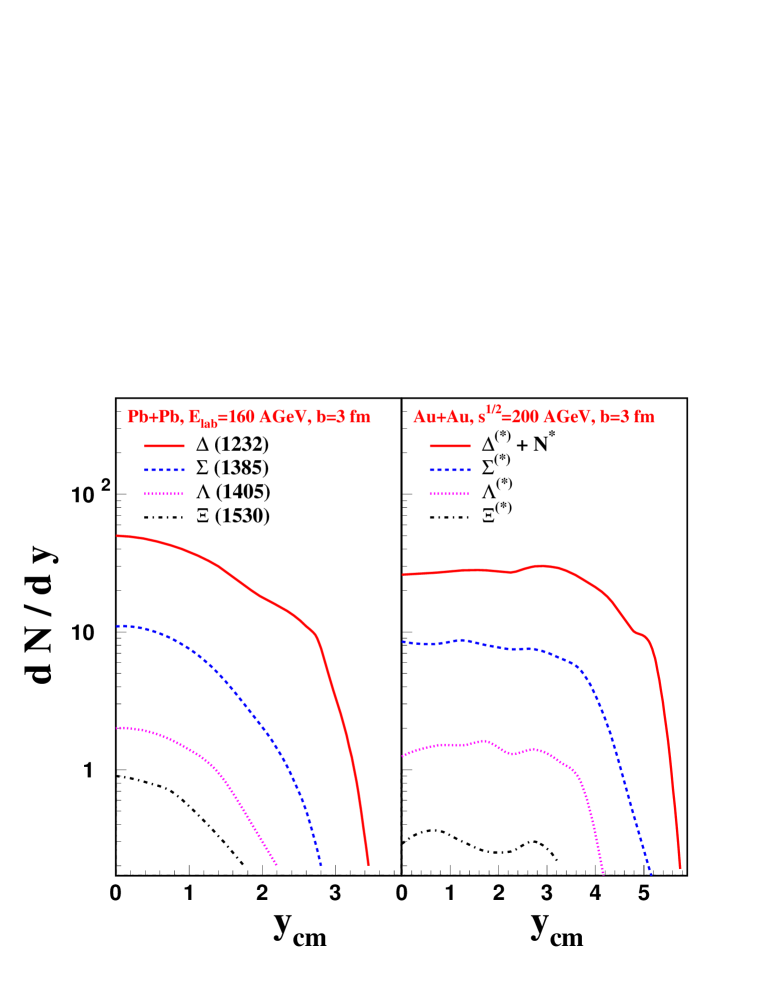
But can the formation of the resonance-abundant matter be traced experimentally? To answer this question the rapidity distributions of baryon resonances are plotted in Fig. 7 for central ( fm) Pb+Pb collisions at A GeV and Au+Au collisions at A GeV, respectively. (The UrQMD predictions for other global observables at RHIC energies can be found in [30]). Here only those resonances that decay into ground state hadrons, i.e. no final state interactions, have been accounted for. The rapidity distributions of baryon resonances at SPS energies have a characteristic Gaussian-like shape, while the distributions of those at RHIC energies are nearly flat in the rapidity interval resembling the Bjorken scaling picture of nuclear matter expansion at ultra-relativistic energies [4]. More than 80% of the baryon non-strange resonances at RHIC energies are still ’s (1232). One can see that the density of directly reconstructible baryon resonances, especially ’s and ’s + ’s, per unit rapidity at RHIC energies is quite high. Therefore, the resonance-rich hadron matter produced in central Au+Au collisions at A GeV can be detected.
V Conclusions
In summary, the microscopic transport model UrQMD is applied to study the equation of state of the hot meson-dominated hadron-string matter produced in the central cell ( fm3) of Au+Au collisions at A GeV. After the restoration of the isotropy of pressure gradients, the hadron spectra in the cell are compared with those of the statistical model of an ideal hadron gas. It is found that the expansion of matter in central collisions proceeds with constant entropy per baryon ratio in the central cell, . Since the ratios for the central cell in A+A collisions, calculated at AGS and SPS energies, are very close to the ratios extracted from the analysis of the experimental data, the expected value of the entropy per baryon ratio at RHIC lies within the range . The microscopic pressure in the cell is also close to the SM pressure. It shows a linear dependence on the energy density in the cell, , which is similar to the dependence in the central cell at SPS energies [22]. The obtained result is in accord with the EOS , derived for an ideal gas of hadrons and hadron resonances [31]. The temperature in the cell at RHIC energies is shown to be nearly independent of the baryon chemical potential .
The further comparison of the energy spectra and yields of hadrons with the SM predictions shows that the full thermal and chemical equilibrium is not reached even at the late stage of the reaction. This means that the times fm/ may be too short for the relaxation process. Particularly, the deceleration of the relaxation to equilibrium is attributed to the creation of the long-lived resonance-abundant matter. For instance, pions which are frequently absorbed and produced in various inelastic processes, including formation and decay of resonances, experience on average only two elastic collisions per particle. This appears to be insufficient to reach thermal equilibrium in the system of strongly interacting particles. In turn, inelastic collisions try to restore chemical equilibrium in the cell. Non-equilibrium densities of strange and non-strange baryons, like ’s, ’s, ’s, etc, and their antiparticles are still lower than the equilibrium values. Amazingly, the yields of resonances are in accord with the SM values from the very early times fm/. Even the abundances of pions are equalizing after fm/. However, this result should be taken with a grain of salt. The fitting temperature of the thermal model is higher than the inverse slope parameters of the energy spectra of particles in the cell, i.e., the temperature of the chemical freeze-out will be overestimated by the SM fit.
According to microscopic calculations, resonance-rich matter survives until the thermal freeze-out when the contact between the hadrons is lost. It remains a challenging task to verify the formation of long-lived resonance-abundant matter in heavy-ion collisions at A GeV experimentally.
Acknowledgements.
The authors profit from discussions with L. Csernai, M. Gorenstein, and E. Shuryak. This work was supported by the Graduiertenkolleg für Theoretische und Experimentelle Schwerionenphysik, Frankfurt–Giessen, the Bundesministerium für Bildung und Forschung, the Gesellschaft für Schwerionenforschung, Darmstadt, Deutsche Forschungsgemeinschaft, and the Alexander von Humboldt-Stiftung, Bonn. S.A.B was supported by the National Science Foundation, grant PHY-00-70818.REFERENCES
- [1]
- [2] E. Fermi, Prog. Theor. Phys. 5, 570 (1950); Phys. Rev. 81, 683 (1951).
-
[3]
L.D. Landau,
Izv. Akad. Nauk SSSR, Ser. Fiz. 17, 51 (1953) [Collected papers of L.D. Landau, edited by D. Ter Haar
(Gordon and Breach, New York, 1965)];
S.Z. Belenkij and L.D. Landau, Nuovo Cimento Suppl. 3, 15 (1956). - [4] J.D. Bjorken, Phys. Rev. D 27, 140 (1983).
- [5] Proceedings of Quark Matter’99, Nucl. Phys. A661, 1c (1999).
-
[6]
P. Braun-Munzinger, J. Stachel, J.P. Wessels,
and N. Xu, Phys. Lett. B 365, 1 (1996);
P. Braun-Munzinger, I. Heppe, and J. Stachel, Phys. Lett. B 465, 15 (1999). -
[7]
F. Becattini, M. Gazdzicki, and J. Sollfrank,
Eur. Phys. J. C 5, 143 (1998);
F. Becattini and U. Heinz, Z. Phys. C 76, 269 (1997). -
[8]
J. Letessier and J. Rafelski,
J. Phys. G 25, 451 (1999);
Phys. Rev. C 59, 947 (1999); preprint nucl-th/9903018. -
[9]
J. Cleymans and K. Redlich,
Phys. Rev. C 60, 054908 (1999);
Phys. Rev. Lett 81, 5284 (1998)
J. Cleymans, H. Oeschler, and K.Redlich, J. Phys. G 25, 281 (1999). -
[10]
J. Cleymans, D. Elliott, H. Satz, and R.L. Thews,
Z. Phys. C 74, 319 (1997);
J. Cleymans, A. Keränen, M. Marais, and E. Suhonen, Phys. Rev. C 56, 2747 (1997). - [11] U. Heinz, J. Phys. G 25, 263 (1999); Nucl. Phys. A 638, 357c (1998).
- [12] J. Sollfrank, J. Phys. G 23, 1903 (1997).
-
[13]
G.D. Yen and M.I. Gorenstein,
Phys. Rev. C 59, 2788 (1999);
G.D. Yen, M.I. Gorenstein, H. Stöcker, S.N. Yang, and W. Greiner, J. Phys. G 24, 1777 (1998). -
[14]
K. Geiger and J.I. Kapusta,
Phys. Rev. D 47, 4905 (1993);
K. Geiger, Phys. Rep. 258, 237 (1995). -
[15]
W. Cassing, V. Metag, U. Mosel, and K. Niita,
Phys. Rep. 188, 363 (1990);
B. Blättel, V. Koch, and U. Mosel, Rep. Prog. Phys. 56, 1 (1993). - [16] K. Puri, E. Lehmann, A. Faessler, S.W. Huang, J. Phys. G 20, 1817 (1994).
- [17] S.A. Bass, M. Belkacem, M. Brandstetter, M. Bleicher, L. Gerland, J. Konopka, L. Neise, C. Spieles, S. Soff, H. Weber, H. Stöcker, and W. Greiner, Phys. Rev. Lett. 81, 4092 (1998).
- [18] M. Bleicher, M. Belkacem, C. Ernst, H. Weber, L. Gerland, C. Spieles, S.A. Bass, H. Stöcker, and W. Greiner, Phys. Lett. B 435, 9 (1998).
-
[19]
J. Sollfrank, U. Heinz, H. Sorge, and N. Xu,
Phys. Rev. C 59, 1637 (1999);
J. Phys. G 25, 363 (1999). - [20] W. Cassing, E.L. Bratkovskaya, S. Juchem, Nucl. Phys. A 674, 249 (2000).
-
[21]
L.V. Bravina, M.I. Gorenstein, M. Belkacem,
S.A. Bass, M. Bleicher, M. Brandstetter, M. Hoffman, S. Soff,
C. Spieles, H. Weber, H. Stöcker, and W. Greiner,
Phys. Lett. B 434, 379 (1998);
L.V. Bravina, M. Brandstetter, M.I. Gorenstein, E.E. Zabrodin, M. Belkacem, M. Bleicher, S.A. Bass, C. Ernst, M. Hofmann, S. Soff, H. Stöcker, and W. Greiner, J. Phys. G 25, 351 (1999). -
[22]
L.V. Bravina, E.E. Zabrodin, M.I. Gorenstein, S.A. Bass,
M. Belkacem, M. Bleicher, M. Brandstetter, C. Ernst, M. Hoffman,
L. Neise, S. Soff, H. Weber, H. Stöcker, and W. Greiner,
Phys. Rev. C 60, 24904 (1999);
L.V. Bravina, M.I. Gorenstein, E.E. Zabrodin, S.A. Bass, M. Belkacem, M. Bleicher, M. Brandstetter, M. Hoffman, S. Soff, C. Spieles, H. Weber, H. Stöcker, and W. Greiner, Phys. Lett. B 459, 660 (1999);
L.V. Bravina, E.E. Zabrodin, M.I. Gorenstein, S.A. Bass, M. Belkacem, M. Bleicher, M. Brandstetter, C. Ernst, Amand Faessler, W. Greiner, S. Soff, H. Stöcker, and H. Weber, Nucl. Phys. A661, 600c (1999). -
[23]
S.A. Bass, M. Belkacem, M. Bleicher,
M. Brandstetter, L. Bravina, C. Ernst, L. Gerland, M. Hofmann,
S. Hofmann, J. Konopka, G. Mao, L. Neise, S. Soff, C. Spieles,
H. Weber, L.A. Winckelmann, H. Stöcker, W. Greiner,
Ch. Hartnack, J. Aichelin, and N. Amelin,
Prog. Part. Nucl. Phys. 41, 255 (1998);
M. Bleicher, E. Zabrodin, C. Spieles, S.A. Bass, C. Ernst, S. Soff, M. Belkacem, L. Bravina, H. Weber, H. Stöcker, and W. Greiner, J. Phys. G 25, 1859 (1999). - [24] M. Belkacem, M. Brandstetter, S.A. Bass, M. Bleicher, L. Bravina, M.I. Gorenstein, J. Konopka, L. Neise, C. Spieles, S. Soff, H. Weber, H. Stöcker, and W. Greiner, Phys. Rev. C 58, 1727 (1998).
- [25] E.L. Bratkovskaya, W. Cassing, C. Greiner, M. Effenberger, U. Mosel, and A. Sibirtsev, Nucl. Phys. A 675, 661 (2000).
- [26] M. Berenguer, C. Hartnack, G. Peilert, H. Stöcker, W. Greiner, J. Aichelin, A. Rosenhauer, J. Phys. G 18, 655 (1992).
- [27] P. Braun-Munzinger and J. Stachel, Nucl. Phys. A 638, 3c (1998).
- [28] S. Soff, S.A. Bass, M. Bleicher, L. Bravina, M. Gorenstein, E. Zabrodin, H. Stöcker, and W. Greiner, Phys. Lett. B 471, 89 (1999).
- [29] M. Hofmann, R. Mattiello, H. Sorge, H. Stöcker, and W. Greiner, Phys. Rev. C 51, 2095 (1995).
- [30] M. Bleicher, S.A. Bass, L.V. Bravina, W. Greiner, S. Soff, H. Stöcker, N. Xu, and E.E. Zabrodin, Phys. Rev. C 62, 024904 (2000).
- [31] E. Shuryak, Sov. J. Nucl. Phys. 16, 395 (1973) [Yad. Fiz. 16, 395 (1972)].
(b) Time evolution of the entropy per baryon ratio, , in the central cell with fm3 in heavy-ion collisions at AGS, SPS, and RHIC energies, respectively. Solid lines denote microscopic calculations with the UrQMD model, dashed lines show the predictions of the statistical model.
(b) The same as (a) but for the -plane. Solid symbols correspond to the stage of kinetic equilibrium, open symbols indicate the preequilibrium stage. The hatched area shows the expected region of the quark-hadron phase transition.
| time | |||||||||
|---|---|---|---|---|---|---|---|---|---|
| fm/ | MeV/fm3 | fm-3 | fm-3 | MeV | MeV | MeV | MeV/fm3 | fm-3 | |
| 5 | 2330 | 0.093 | -0.0042 | 201 | 39.7 | 13.0 | 349 | 13.3 | 143 |
| 6 | 1705 | 0.071 | -0.0047 | 193 | 41.0 | 12.1 | 257 | 10.1 | 142 |
| 7 | 1319 | 0.059 | -0.0011 | 187 | 44.2 | 13.4 | 201 | 8.1 | 138 |
| 8 | 1031 | 0.045 | 0.0011 | 181 | 44.3 | 13.6 | 159 | 6.5 | 144 |
| 9 | 820 | 0.040 | -0.0044 | 176 | 47.2 | 10.4 | 128 | 5.4 | 135 |
| 10 | 656 | 0.029 | -0.0022 | 171 | 44.1 | 9.8 | 104 | 4.4 | 152 |
| 11 | 544 | 0.025 | -0.0044 | 167 | 47.4 | 11.2 | 87 | 3.8 | 149 |
| 12 | 446 | 0.018 | 0.0089 | 163 | 42.6 | 10.6 | 72 | 3.2 | 176 |
| 13 | 346 | 0.015 | 0.0040 | 158 | 50.4 | 15.6 | 57 | 2.6 | 165 |
| 14 | 290 | 0.012 | 0.0024 | 154 | 48.0 | 12.9 | 49 | 2.2 | 180 |
| 15 | 241 | 0.009 | -0.0044 | 150 | 40.7 | 6.5 | 41 | 1.9 | 214 |
| 16 | 200 | 0.007 | 0.0022 | 147 | 37.8 | 6.6 | 35 | 1.6 | 250 |
| 17 | 168 | 0.006 | -0.0031 | 143 | 42.7 | -1.1 | 30 | 1.4 | 218 |
| 18 | 145 | 0.005 | -0.0028 | 140 | 43.4 | -1.9 | 26 | 1.2 | 227 |
| time | ||||
|---|---|---|---|---|
| fm/ | fm-3 | fm-3 | fm-3 | fm-3 |
| 5 | 0.183 | 0.090 | 0.332 | 0.239 |
| 6 | 0.135 | 0.064 | 0.236 | 0.165 |
| 7 | 0.106 | 0.047 | 0.178 | 0.119 |
| 8 | 0.082 | 0.036 | 0.134 | 0.088 |
| 9 | 0.065 | 0.025 | 0.105 | 0.065 |
| 10 | 0.049 | 0.020 | 0.079 | 0.050 |
| 11 | 0.041 | 0.016 | 0.064 | 0.039 |
| 12 | 0.031 | 0.013 | 0.049 | 0.031 |
| 13 | 0.025 | 0.010 | 0.036 | 0.021 |
| 14 | 0.020 | 0.008 | 0.029 | 0.017 |
| 15 | 0.016 | 0.007 | 0.022 | 0.013 |
| 16 | 0.012 | 0.006 | 0.017 | 0.011 |
| 17 | 0.010 | 0.004 | 0.014 | 0.008 |
| 18 | 0.009 | 0.004 | 0.011 | 0.008 |
| 19 | 0.008 | 0.003 | 0.010 | 0.005 |
| time | ||||||||
|---|---|---|---|---|---|---|---|---|
| fm/ | fm-3 | fm-3 | fm-3 | fm-3 | fm-3 | fm-3 | fm-3 | fm-3 |
| 5 | -0.064 | 0.039 | -0.160 | 0.129 | 0.216 | -0.194 | 0.216 | -0.190 |
| 6 | -0.049 | 0.029 | -0.112 | 0.088 | 0.169 | -0.154 | 0.169 | -0.149 |
| 7 | -0.038 | 0.020 | -0.083 | 0.063 | 0.141 | -0.124 | 0.139 | -0.120 |
| 8 | -0.031 | 0.017 | -0.062 | 0.047 | 0.115 | -0.099 | 0.115 | -0.098 |
| 9 | -0.024 | 0.013 | -0.048 | 0.033 | 0.094 | -0.087 | 0.094 | -0.083 |
| 10 | -0.019 | 0.010 | -0.036 | 0.025 | 0.077 | -0.071 | 0.078 | -0.070 |
| 11 | -0.017 | 0.009 | -0.028 | 0.019 | 0.063 | -0.056 | 0.068 | -0.059 |
| 12 | -0.014 | 0.007 | -0.021 | 0.015 | 0.052 | -0.045 | 0.058 | -0.050 |
| 13 | -0.011 | 0.006 | -0.015 | 0.011 | 0.045 | -0.036 | 0.048 | -0.039 |
| 14 | -0.009 | 0.005 | -0.012 | 0.008 | 0.038 | -0.031 | 0.041 | -0.035 |
| 15 | -0.008 | 0.005 | -0.009 | 0.006 | 0.027 | -0.024 | 0.034 | -0.031 |
| 16 | -0.006 | 0.004 | -0.007 | 0.005 | 0.023 | -0.020 | 0.029 | -0.026 |
| 17 | -0.005 | 0.002 | -0.006 | 0.003 | 0.017 | -0.017 | 0.023 | -0.024 |
| 18 | -0.005 | 0.002 | -0.005 | 0.003 | 0.014 | -0.015 | 0.020 | -0.021 |
| 19 | -0.005 | 0.002 | -0.005 | 0.002 | 0.012 | -0.015 | 0.017 | -0.021 |