ERROR PROPAGATION IN QCD FITS
The parton momentum density distributions of the proton were obtained from a NLO QCD analysis of HERA and fixed target structure function data. The resulting parton distribution set includes the full information on errors and correlations.
1 Introduction
Standard sets of parton densities are widely used to calculate hard scattering cross sections in hadron-hadron and lepton-hadron collisions. However, none of these sets give the errors on the parton densities which tend to dominate the uncertainties on the predicted cross sections.
To make a parton distribution set available which includes the full information on errors and correlationsaaaAvailable from http://www.nikhef.nl/user/h24/qcdnum we have performed a NLO QCD analysis of HERA and fixed target structure function data. In this contribution we describe how the experimental errors were propagated in the QCD fit.
2 Error propagation
In the fit, the correlated experimental systematic errors were incorporated in the model prediction of the structure functions:
| (1) |
where is the QCD prediction and is the relative systematic error on data point stemming from source . The fitted parameters describe the parton densities at the input scale and denotes the set of systematic parameters. Assuming that the are uncorrelated and Gaussian distributed with zero mean and unit variance, the was defined in the usual way and two Hessian matrices M and C were evaluated at the minimum :
| (2) |
The statistical and systematic covariance matrices were calculated from
| (3) |
The error on any function of the parameters is, to first order, given by
| (4) |
where V is the statistical, the systematic, or if the total error is to be calculated, the sum of both covariance matrices.
Three additional sources of error were considered in the analysis: (i) Errors due to the uncertainties on the input parameters ( etc.). The error bands are defined as the envelope of the results from the central fit and two additional fits where each input parameter was lowered or raised by the error; (ii) An ‘analysis’ error band is defined as the envelope of the central fit and 10 alternative fits where, for instance, the cuts on the data were varied; (iii) The renormalization and factorization scale uncertainties, obtained from fits where both scales were independently varied in the range .
In Fig. 1
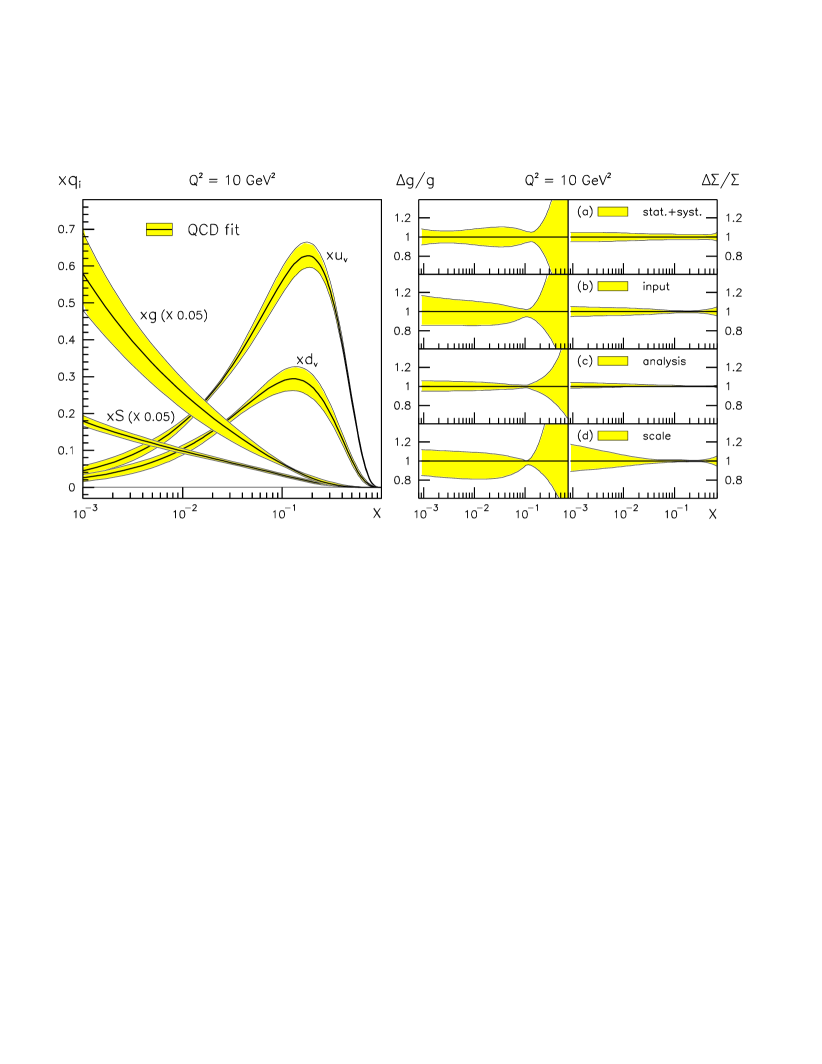
we show the parton densities obtained from this analysis (left hand plot). The error bands correspond to the quadratic sum of all errors except the scale uncertainties. The relative error contributions to the gluon density and the singlet quark density are shown in the right hand plot of Fig. 1. It is seen that the analysis error band is small. For the gluon density the remaining contributions to the error are roughly equal in size whereas for the quarks it turns out that the scale uncertainty is the largest source of error.
3 Parton distribution set
Stored on a computer readable file are the statistical and systematic covariance matrices, the parton densities , the derivatives (both from the central fit), the results from the systematic fits (where the input parameters or scales were changed) and the analysis error band. The kinematic range covered by the parton densities is and GeV2.
A computer program gives fast access to these results and provides tools, which make use of Eq. (4), to propagate the statistical and systematic errors to any function of the parton densities. As an input to the program the user should provide a calculation of the derivatives . Let us take as an example a hadron-hadron cross section which can be written as a convolution of the parton densities and a hard scattering cross section,
| (5) |
To calculate the error on it is sufficient to provide a function which computes the derivatives
| (6) |
This calculation is straight forward since the and the are available from the input file.
Finally, we remark that the errors from a QCD fit are not determined by the experimental errors alone but also depend, and maybe quite strongly, on the assumptions made in the analysis, in particular on the parameterizations chosen for the parton densities at the input scale .
References
References
- [1] M. Glück, E. Reya and A. Vogt, Eur. Phys. J. C 5, 461 (1998).
- [2] A.D. Martin et al., Eur. Phys. J. C 14, 133 (2000).
- [3] H.L. Lai et al., Eur. Phys. J. C 12, 375 (2000).
- [4] M. Botje, Eur. Phys. J. C 14, 285 (2000).
- [5] C. Pascaud and F. Zomer, LAL-95-05.
- [6] M. Botje, epdflib version 2, NIKHEF-99-034.