Regge analysis of diffractive and leading baryon structure functions from DIS
Abstract
In this paper we present a combined analysis of the H1 data on leading baryon and diffractive structure functions from DIS, which are handled as two components of the same semi-inclusive process. The available structure function data are analyzed in a series of fits in which three main exchanges are taking into account: pomeron, reggeon and pion. For each of these contributions, Regge factorization of the correspondent structure function is assumed. By this procedure, we extract information about the interface between the diffractive, pomeron-dominated, region and the leading proton spectrum, which is mostly ruled by secondary exchanges. One of the main results is that the relative reggeon contribution to the semi-inclusive structure function is much smaller than the one obtained from a analysis of the diffractive structure function alone.
pacs:
11.55.Jy, 12.40.Nh, 13.60.Hb, 13.85.NiI Introduction
One of the most striking results obtained at the DESY HERA collider was the discovery by the H1 and ZEUS collaborations H1-old ; ZEUS-old that deep inelastic scattering (DIS) events tagged with rapidity gaps exhibit mass distributions whose shape resemble very much those observed in hadron-hadron diffraction experiments. More recently, both the H1 and ZEUS collaborations reported H1-Lead ; ZEUS-Lead analyses of another class of DIS events whose pretty flat distribution turned out to be quite similar to the leading particle spectrum, also observed in hadron reactions. These similarities suggest that the Regge pole phenomenology Collins , successfully used to describe diffractive events and the leading particle effect in hadron processes Collins ; Mirian , might also be employed to analyze the corresponding events obtained in DIS.
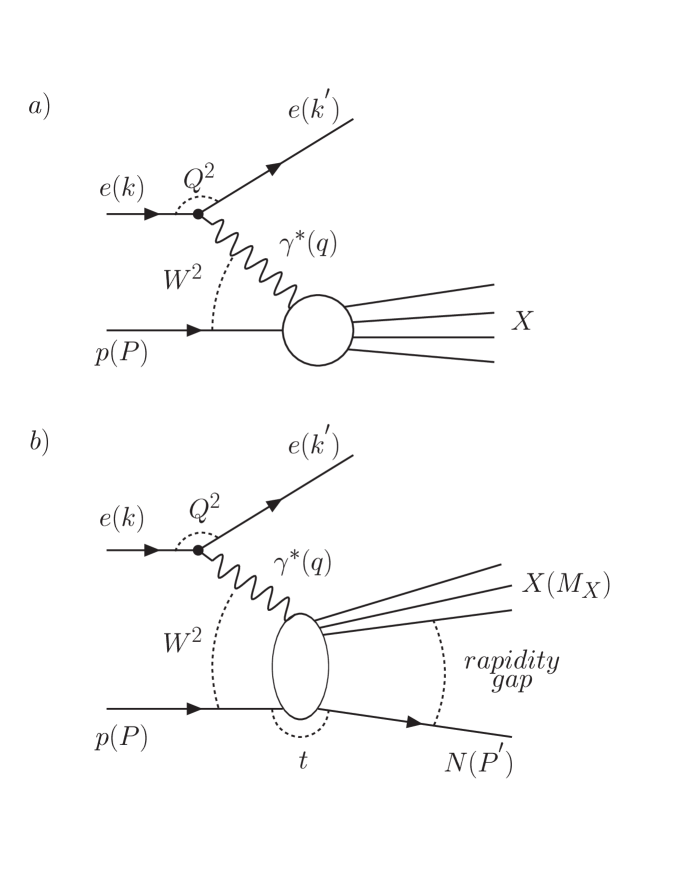
In a conventional DIS process, , a high energy electron of four-momentum interacts with a proton of four-momentum through the emission of a photon of virtuality . As long as the photon has high enough momentum, it can resolve the internal partonic structure of the proton, interacting with its partons through a hard scattering which breaks up the hadron. In this inclusive reaction only the outgoing electron is detected in the final state (Fig. 1a).
If, besides the electron, one specific kind of hadron is detected in the final state, we have a semi-inclusive DIS process, . Among processes of this kind there are events for which it is possible to recognize, in the final hadronic state, particles that bear some identity with the original proton, i.e., they are close in rapidity to the original proton and carry a significant fraction of its momentum. In a particular case, events such as these may be characterized by a large rapidity gap between the products of the hard scattering and the outgoing proton debris (Fig. 1b). If those debris are identified with a proton, neutron or any other baryon close related to the original proton, we have the above mentioned leading baryon effect, , which, in analogy with the hadron case Mirian , could, in principle, be described by Regge phenomenology in terms of reggeon and pion exchanges Szczurek .
Furthermore, if the detected baryon is carrying more than 90% of the incoming proton momentum and is identified with a proton itself (or, equivalently, if a rapidity gap is detected nearby the proton fragmentation region), then the dominant interaction mechanism is a single diffractive scattering, , in which the virtual photon interacts with the proton through a color singlet exchange with the vacuum quantum numbers, which in Regge phenomenology is known as pomeron exchange Collins .
With the above statements we just intend to make the point that, speaking in terms of theory, diffractive DIS events are part of a wider class of interactions, the semi-inclusive DIS processes, within which the leading particle effect is found. Thus, if one wants to capture the Regge behavior presumably observed by a certain kind of DIS data, one should take into account all available data at once, which, in this case, means to consider simultaneously diffractive and leading particle data in the same analysis. This is the scope of the present paper.
Semi-inclusive processes have been measured by the H1 and ZEUS collaborations in the HERA colliding machine at DESY, where positrons of collide with protons of . The H1 Collaboration has made high-statistic measurements of the diffractive structure function in the process , where represents a hadronic system with mass lower than and rapidity closest to that of the incident proton H1-Diff . H1 also measured the leading proton and neutron structure functions, and respectively, in the reaction , where is the identified nucleon H1-Lead . The ZEUS Collaboration has measurements of the diffractive structure function in the reaction Zeus , and preliminary leading baryon measurements have also been reported ZEUS-Lead .
Now, let us examine these experimental findings through a phenomenological gaze. The first attempts to describe them by the Regge formalism were based on the Ingelman and Schlein model Ingelman by which diffraction in DIS is understood as a two-step process: first the proton emits a pomeron, then the pomeron is hard scattered by the virtual photon. In such a view, the pomeron is a quasi-particle that carries a fraction of the proton’s momentum and has its own structure function that could be expressed in terms of and (here plays the role of the Bjorken variable for the pomeron; see its definition in the next section). Accordingly, the measured structure function would be factorized as
| (1) |
where is the flux of the pomeron out of the proton, which is a function of and , the squared four-momentum transferred at the proton vertex. represents here the pomeron structure function.
Several analyses were made based on Eq. (1) and on this factorization hypothesis, including those performed by the H1 and ZEUS collaborations H1-old ; ZEUS-old (see also Varios and references quoted therein). In fact, this kind of analyses has been used to establish the pomeron intercept from the diffractive DIS data.
Although the preliminary experimental results seemed to confirm the factorization hypothesis H1-old ; ZEUS-old , subsequent high-statistic data measured in an extended kinematical region by the H1 Collaboration proved that such a simple factorized expression is clearly violated H1-Diff . Since then it has been conjectured H1-Diff ; Golec-Biernat that secondary reggeonic exchanges could play an important role in diffractive events, in such a way that the structure function could be written as
| (2) |
where is the reggeon flux factor, and is the reggeon structure function. Within this approach, the change in the diffractive pattern displayed by the H1 data could be explained without giving up the idea of Regge factorization for each contribution. The H1 Collaboration itself was very successful in describing the bulk of the diffractive structure function data with a fitting expression akin to Eq. (2) (see H1-Diff ).
In fact, not only the diffractive data, but also the H1 leading proton structure function data can be fairly described within the same framework as well by just adding up to Eq. (2) an extra pion contribution as required in such a case (see H1-Lead ). The leading neutron structure function is described by the same scheme, but in that case only pion exchange is necessary H1-Lead .
Since the leading baryon data were obtained some time after the diffractive structure function measurements, these H1 analyses were performed independent of each other. However, as stated previously, it is our belief that both diffractive and leading proton processes should be analyzed together, as two parts of the same semi-inclusive process, in the same fashion as in the hadronic case Mirian . In this way it would be possible to establish more precisely the role of the pomeron and the secondary reggeon exchanges, since the diffractive data are dominated by the former and has the latter only as a background, while the reverse is true for the leading proton data. Therefore, in this work we consider these data sets as complementary ones, i.e., our basic assumption is that the diffractive and leading proton structure functions are parts of one and the same semi-inclusive proton structure function , which can be expressed in a way similar to Eq. (2). Throughout this work we will use the notation for the semi-inclusive proton structure function, when referring to the diffractive and leading proton structure function data together.
The purpose of this paper is to reach a better understanding about the role of the pomeron and reggeon contributions in the interface between the diffractive and non-diffractive regimes through a global fit of the proton structure function obtained from H1 semi-inclusive DIS data (the ZEUS data were not employed in the fitting procedure, but their diffractive structure function measurements were used for checking our final results). In Sec.II, we define the kinematical variables and cross sections while our fitting procedure is presented in Sec.III. In Sec.IV, we present our fit results and a preliminary discussion, while a procedure to compare diffractive and leading proton data is described in Sec.V. Our main conclusions are summarized in Sec.VI.
II Kinematics and Cross Sections
The usual variables employed to describe DIS are depicted in Fig. 1a. One can define the squared energy in the center of mass system (CMS) in terms of the four-momenta and , referring respectively to the incoming proton and electron (or positron), as
| (3) |
and the squared energy in the CMS as
| (4) |
The photon virtuality , the Bjorken and the variable are given by
If we ignore the proton mass, we have the following relations among these variables:
| (5) |
and
| (6) |
being that has been assumed in the latter expression.
For the case presented in Fig. 1b, where a baryon with four-momentum is detected in the final state, we can also define the variables
| (7) | |||||
| (8) | |||||
| (9) |
where the variable represents the fraction of momentum carried by a struck parton in the pomeron (if a pomeron exchange model is assumed).
Also, for leading baryons, it is usual to describe the data in terms of the fraction of momentum carried by the outgoing proton, , where is connected with by
| (10) |
The differential cross section for a semi-inclusive DIS process giving rise to leading baryon behavior is written as
| (11) |
In the case of diffractive events, such a cross section is often expressed in terms of the and variables,
| (12) |
Here is the ratio between the cross sections for longitudinally and transversely polarized virtual photons. Under certain conditions, it is possible to assume and thus the experimental behavior of the cross sections (11) and (12) is expressed in terms of the structure functions and . Specifically for the H1 diffractive data, such assumption was applied for those data with H1-Diff .
Thus, our analysis is directed to study the behavior of both and data. We notice that these data are already integrated over the -range corresponding to their respective experiments. In order to compare these data among themselves it is necessary to explicitly introduce the -dependence on the structure functions. We discuss that issue in details in Sec. V.
III Model, Parameters and Fitting Procedure
In the present study we have used the diffractive structure function data obtained by the H1 Collaboration H1-Diff , together with their measurements of the leading baryon structure functions for protons and for neutrons H1-Lead , in the same analysis. The data cover the kinematical ranges:
while, for the leading baryon measurements, the covered kinematical region are:
We notice that, although these data sets are overlapping in terms of and ranges, they are complementary in terms of the , the Bjorken variable for the presumable pomeron constituents.
As stated before, the H1 diffractive structure function, , can be written as a combination of two Regge exchanges with the quantum numbers of the vacuum, the pomeron and the reggeon ones H1-Diff . The most general expression for such a diffractive structure function reads
| (13) |
Here, functions and represent, respectively, the pomeron and reggeon flux factors integrated over , while and are the pomeron and reggeon structure functions. The last term on the right-hand-side of Eq. (13), , accounts for a possible interference effect between the pomeron and reggeon exchanges.
The fluxes are taken from the Regge phenomenology of hadronic soft diffraction, and are written as
| (14) |
and
| (15) |
where and are the minimum and maximum absolute values of the data for each experiment. In these expressions, the parameters , and , are, respectively, the intercept and slope of the pomeron and reggeon linear trajectories, that is
| (16) |
and in Eq. (14) is the Dirac form factor given by
| (17) |
The interference term is related to the pomeron and reggeon fluxes and structure functions by
| (18) |
and
| (19) |
The expression above is quite similar to the one used by the H1 Collaboration to account for interference contribution in their diffractive structure function analysis H1-Diff . Following their procedure, we introduced a free parameter to account for the degree of interference between the pomeron and reggeon exchanges. Such a parameter is allowed to vary from 0 to 1.
Here we mostly intend to explore the connection between the diffractive and leading proton regimes, although the available data are quite separated in terms . Therefore, we need a general functional form for the pomeron structure function that could be able to consider both the low (leading proton) and high (diffractive) regimes. In order to do that, we choose for the pomeron a functional form based on the same phenomenological parameterization as used in the H1 QCD analysis of the diffractive structure function H1-Diff , where a quark flavor singlet distribution and a gluon distribution are parameterized in terms of the coefficients and , according to:
| (20) |
where is the member in a set of Chebyshev polynomials, with , and . We have summed these terms up to and set , in order to contemplate the range of both diffractive and leading proton data. Following H1, we also set . Therefore, Eq. (20) has 6 parameters to be fixed by the fit.
Since it is not possible to totally separate the pomeron structure function from its flux factor, the parameters above also set the overall normalization of the pomeron contribution. The gluon and quark distributions above are evolved in leading order (LO) and next-to-leading order (NLO) by using the QCDNUM16 package QCDNUM , and the final pomeron structure function is written in terms of the singlet quark distribution as
| (21) |
where is the average charge of the distribution, and for three flavors .
For the reggeon, we assume the hypothesis of a direct relation between the reggeon structure function and the pion structure function by using
| (22) |
where is a free normalization parameter, and for the pion structure function we choose the LO GRV parameterization GRV . Such a choice is supported by the good description it provided for the H1 leading baryon data H1-Lead .
In fact, the identification of the reggeon structure function with the pion one is not new, and some authors already have applied it to the analysis of the H1 diffractive structure function data Royon .
Specifically for our case, we also choose to identify the reggeon exchange explicitly with the family of resonances, which has the right quantum numbers for the processes analyzed here and is characterized by its high intercept, Dino1 .
For the leading proton structure function, , besides the pomeron and reggeon contributions, the pion exchange also plays a major role. In fact, the pion contribution is known to have an important role in hadronic leading proton Mirian and seems to work as an effective background for diffractive reactions at small Dino2 , besides its role in DIS H1-Lead . Indeed, pion exchange has a well known phenomenological behavior, so we took the pion flux factor straight out of the literature as being
| (23) |
where is the coupling constant for . Note that for the inclusive neutron production, , there is an extra factor in the coupling constant due to the Clebsh-Gordan coefficient for such a process.
For the pion structure function, , we took the LO GRV GRV parameterization. With the flux above and the GRV structure function, we were successful in describing the DIS leading neutron data without any free parameter.
The expression for the leading proton structure function then reads
| (24) |
As we said at the beginning, our main assumption is that the diffractive and leading proton structure function are components of one and the same semi-inclusive (SI) structure function, which combines the contribution from both Eq. (13) and Eq. (24) in a single expression that reads
| (25) | |||||
It should be noted that in the equation above, the pion contribution is significant only for , therefore for the diffractive regime, , Eq. (25) reduces to Eq. (13), where no pion exchange is considered.
In overall, we dealing with a maximum of 8 free parameters to be fixed by the fitting procedure. These parameters come from the pomeron structure function, Eq. (20) (6 parameters), reggeon normalization, Eq. (22) (1 parameter), and the interference contribution, Eq. (18) (1 parameter). As mentioned before, the pion contribution (flux factor, Eq. (23), and structure function, given by the GRV parameterization GRV ) is totally fixed by the standard phenomenology having no free parameter left.
The other parameters, such as the pomeron and reggeon trajectories (intercept and slopes), the slope of the reggeon -dependence and the parameter from Eq. (20 were kept fixed by their values from the literature, since they are quite well established. In Table 1 we present the values used for these parameters throughout this paper.
It should be mentioned that we excluded from the fit all data lying the the resonance region () and/or with . That leave us with a total of 170 diffractive structure function data and 48 leading proton structure function data, with adds to a total of 218 data.
| Parameters: | ||||||
|---|---|---|---|---|---|---|
| Values: |
IV Results and Discussion
In Table 2, we present the results of our first three fits. Fit 1 represents the results of our global LO analysis of diffractive and leading proton structure function data, using Eq. (25) with no interference term included (). Since we are dealing with two different sets of data, we added the statistic and systematic errors in quadrature. A of was obtained.
Fit 2 corresponds to the results of a global NLO analysis of the diffractive and leading proton structure function data, using Eq. (25) as the fitting equation, again with no interference term included (). Although some of the parameters have significantly changed in comparison to Fit 1, the final result provided a which is basically the same as the one from the global LO fit.
Fit 3 corresponds to a fit of Eq. (13) to the diffractive structure function data only. The final obtained, with only statistical errors included, was . Although, in this case, the interference component was left free, it was ruled out by the fit. An observation to be made at this point is that one must be careful when comparing this result with the one from the H1 QCD analysis of the same set of data H1-Diff , since our sample includes two sets of data that where not taken into account in the H1 analysis (those for and at ). That gives us a total of data, whereas H1 has only . Our choice for the reggeon intercept has also some effect in improving the final result.
| Parameters | Fit 1 - Global LO | Fit 2 - Global NLO | Fit 3 -Diffractive NLO |
|---|---|---|---|
| (Diff.) | |||
| (LP) | - | ||
| Parameters | Fit 4 - Global LO | Fit 5 - Global NLO |
|---|---|---|
| (Diff.) | ||
| (LP) | ||
Table 3 presents the results of global fits when the interference parameter set free. It was bounded to vary in the interval , but, as can be seen, in both fits it assumed the maximum upper value. Comparing these results respectively to Fits 1 and 2, the improved a little in both the LO fit () and the NLO fit ().
Table 2 and 3 also present the individual contributions to the coming from the diffractive and leading proton data. For three of our global fits, we have a diffractive contribution around , with the leading proton one around . The only departure from these values comes from the global NLO fit with the interference parameter set free (Fit 5). For that we have the diffractive data contributing with and the leading proton data with . It is worth to remember that, for the global fits, our data sample is composed of 218 data, 170 coming from diffractive and 48 from leading proton structure function. Therefore, the diffractive data corresponds to of our global data set, and the leading proton data to .
In order to test the parameterization of the pomeron structure function, we compare some of our results for , Eq. (20), with the independent measurement of by the ZEUS Collaboration ZEUS-old , where no sign of secondary exchanges was found. As shown in Fig. 2, all of the three fits exhibited are in good agreement with the data (which were not used in the fitting procedure), indicating that the pomeron contribution has been fairly accounted.

In Fig. 3, we plotted the diffractive structure function data from H1 Collaboration in comparison with the results of the same three fits shown in Fig 1. As can be seen, the agreement among the three fits is quite good at small , but as increases Fit 3 grows faster than the other two. The difference between Fit 1 and Fit 2 (not shown in the figure) is quite small over the entire diffractive range of , which is expected since both fits give close values for the .


Fig. 4 shows the data from H1 Collaboration together with the results from Fit 2 to illustrate the description of the leading particle behavior. The leading neutron data, from the same experiment, are also included (these data can be described assuming pion exchange as the only contribution for the reaction and so were not employed in the fitting procedure).
After showing all of these results, some comments are in order. Firstly, from Fits 1 and 2, we see that applying LO or NLO evolution equations produce basically the same result in terms of , although, as expected, some parameters suffer a little change (the same can be said about Fits 4 and 5). We remind that these parameters reflect the quark and gluon content of the pomeron as obtained from different scenarios.
The comparison between Fit 2 (global) and Fit 3 (only diffractive data) present much more remarkable effects. Not only the parameters change, but in the latter case there is a strong enhancement of the secondary contribution. However, this is a suspicious effect since the diffractive data are quite limited in terms of the variable and secondary reggeon contribution are supposed to play an important role only for (see more comments about this aspect in the next section).
When we perform the global fit, but leaving the interference term completely free to be established by the minimization, it assumes its maximum value (Fits 4 and 5). Again it is the case of asking whether this outcome reflects a reliable physical effect or is just a fitting artifact. Answering this question is beyond the scope of this paper, but we have strong evidences indicating that the introduction of the interference term makes the corresponding structure functions inadequate to describe the results of diffractive photo- and eletroproduction of dijets by both H1 and ZEUS collaborations. On the other hand, diffractive structure function obtained without interference effects allow a very good description of both dijet production processes Altem .
V Bringing diffractive and leading proton structure functions together
Now, some words are needed to explain how we handled together both the sets of data displayed in Fig. 5, since it is the central piece of our study. In that figure, we bring together the diffractive and leading proton data and compare the results of our three NLO fits to this combined set of semi-inclusive data.
Here, we are mostly interested in analyzing the behavior of these data in terms of . Since the range for the diffractive and leading proton data are very distinct, the usual procedure of plotting together data with the same values of and would not be the best choice. There is, however, a large overlap of these two sets in terms of the variables and . Thus, we choose to combine the data in groups with the same (or as close as possible) values of and . That is a more proper way to show that the difference between the diffractive and the leading proton regime is due to the region where the semi-inclusive process is measured, according to our assumption that both sets of data can be embraced by the same semi-inclusive structure function.

Still a problem remains. Besides the different range, both the diffractive and leading proton structure functions were measured at different intervals. The diffractive data were measured for the interval , whereas the leading proton ones where measured for the interval , where
| (26) | |||||
| (27) |
with . Since this last interval corresponds to a range smaller than the diffractive one and since the phenomenological dependence coming from the diffractive region seems to be well established for both hadronic and DIS events, in Fig. 5 we scaled down the diffractive structure function data in order to make them comparable to the leading proton data.
It should be noticed that such a correction is intended only as a visualization device. In our whole fitting analysis, we took the data at their correct measured intervals.
In order to make such a correction as independent of our own analysis as possible, we choose to proceed by the following way. A fit of Eq. (13) to the diffractive structure function data was performed, with the interference parameter set to zero (no interference). The fluxes were those given by Eq. (14) and Eq. (15), with the pomeron and reggeon intercept kept fixed with those values obtained from the H1 analysis H1-Diff ( and respectively). For any fixed values of and , the pomeron and reggeon structure functions were treated as free parameters to be fixed. Once those parameters were determined for each set, it was possible to calculate the ratio
| (28) |
which should be used to correct each measured diffractive structure function data point at a given , and .
Such procedure provided a correction factor that is a function of , going from 0.25 to 0.4. This is reflected in the curves shown in Fig. 5. From that figure it is clear that the reggeon contribution coming from Fit 3 overestimates the leading proton data by a factor 2 at least. The only parameter related to this exchange is the normalization , and from Table 2 it is clear that the fit to the diffractive data alone drives such parameter to a very high value, compared with the one from the global Fits 2 and 5, that are both quite compatible with the combined sets of data.
VI Conclusions
The analysis in this paper shows that we have to be very careful before drawing conclusions about the role of Regge exchanges in diffractive DIS. If only the H1 high statistic diffractive data were used, as we have done in our Fit 3, an extrapolation of such a result to the leading proton region will overestimate those data by, at least, a factor 2 (Fig. 5). It could be argued that such an extrapolation goes to low values beyond the range of the fitted data, and our pomeron structure function would not be valid anymore. That is true, but the point is that the pomeron contribution alone is not important in such extrapolation. It is the secondary reggeon plus the pion contribution that play the major role in the leading proton region. The pion contribution itself is fixed and provides a quite reasonable description of the leading neutron data. The same pion structure function is used by the reggeon exchange, and it has been shown that a such combination provides a good description of the leading baryon data H1-Lead . Therefore our choice of structure functions for the secondary exchanges works well in both regimes, and it is fair to expect that, extrapolating the information about the ratio between pomeron and reggeon from the diffractive SF to the leading proton regime, we should be able to have a decent qualitative description of the leading proton data, but instead we were left with a result that not only does not describe the data, but also lives no room for corrections with extra reggeon exchanges.
The main problem in connecting the diffractive and leading baryon regimes seems to come from the relative weight that the fit put over the reggeon contribution in each case. For instance, the normalization parameter changes from , when only diffractive data are used, to , when both diffractive and leading proton data are put together.
Although the interference term has some impact over the reggeon contribution, it plays a minor role that does not improve at all the discrepancies discussed above.
The fact that ZEUS Collab. has found no secondary exchange in their diffractive measurements ZEUS-old ; Zeus is also an evidence that the diffractive structure function data alone cannot conclusively provide information concerning the contribution of the secondary reggeon exchange in semi-inclusive reactions. Therefore, the leading baryon data represent an important constraint that must be taken into account in any analysis based on the Regge picture of diffraction.
The next step following this analysis is to show how these different parameterizations affect the theoretical predictions for the cross sections of diffractive photo- and electro-production of dijets, also measured by ZEUS and H1 Collaborations Zeus-phot ; H1-phot . This is going to be reported in a forthcoming paper Altem .
Acknowledgments
We would like to thank the Brazilian governmental agencies CNPq and FAPESP for financial support.
References
- (1) H1 Collaboration, T. Ahmed et al., Phys. Lett. B 348, 681 (1995).
- (2) ZEUS Collaboration, M. Derrick et al., Zeit. Phys. C 68, 569 (1995).
- (3) H1 Collaboration, C. Adloff et al., Eur. Phys. J. C 6, 587 (1999).
- (4) Nicolò Cartiglia, eprint hep-ph/9706416. See also the information on physical results in section diffraction of the ZEUS web page, http://www-zeus.desy.de/publications.php3.
- (5) P. D. B. Collins, An Introduction to Regge Theory and High Energy Physics, (Cambridge University Press, Cambridge, England, 1977).
- (6) M. Batista and R. J. M. Covolan, Phys. Rev. D 59, 054006 (1999).
- (7) A. Szczurek, N. N. Nikolaev and J. Speth, Phys. Lett. B 428, 383 (1998).
- (8) H1 Collaboration, C. Adloff et al., Z. Phys. C 76, 613 (1997).
- (9) ZEUS Collaboration, J. Breitweg et al., Eur. Phys. J. C 1, 81 (1998).
- (10) G. Ingelman and P. Schlein, Phys. Lett. B 152, 256 (1985).
- (11) R. J. M. Covolan and M. S. Soares, Phys. Rev. D 57, 180 (1998); L. Alvero et al., Phys. Rev. D 59, 074022 (1999); M. F. McDermott and G. Briskin, Proceedings of the Workshop “Future Physics at HERA”, eds. G. Ingelman, A. De Roeck and R. Klanner, DESY, Hamburg, 1996, hep-ph/9610245; R. J. M. Covolan and M. S. Soares, Phys. Rev. D 60, 054005 (1999); R. J. M. Covolan and M. S. Soares, Phys. Rev. D 61, 019901(E) (2000).
- (12) K. Golec-Biernat, J. Kwieciński and A. Szczurek, Phys. Rev. D 56, 3955 (1997).
- (13) H1 Collaboration, T. Ahmed et al., Nucl. Phys. B439, 471 (1995); H1 Collab, S. Aid et al., Nucl. Phys. B470, 3 (1996).
- (14) QCDNUM16: A fast QCD evolution program, M. A. J. Botje; Zeus Note 97-066. We are using QCDNUM version 16.10-12 in this work.
- (15) C. Royon, L. Schoeffel, J. Bartels, H. Jung, R. Peschanski, Phys. Rev. D 63, 074004 (2001)
- (16) R. J. M. Covolan, J. Montanha and K. Goulianos, Phys. Lett. B 389, 176 (1996).
- (17) K. Goulianos and J. Montanha, Phys. Rev. D 59, 114017 (1999).
- (18) M. Glück, E. Reya, A. Vogt, Z. Phys. C 53, 651 (1992).
- (19) R. J. M. Covolan, J. Montanha, A. N. Pontes and M. S. Soares, in preparation.
- (20) ZEUS Collaboration, J. Breitweg at al., Eur. Phys J. C 5 41 (1998).
- (21) H1 Collaboration, C. Adloff et al., Eur. Phys. J. C 6 421 (1999); Eur. Phys. J. C 20 29 (2001).