Quenched Light Hadron Spectrum
Abstract
We present results of a large-scale simulation for the flavor non-singlet light hadron spectrum in quenched lattice QCD with the Wilson quark action. Hadron masses are calculated at four values of lattice spacing in the range 0.1 – 0.05 fm on lattices with a physical extent of 3 fm at five quark masses corresponding to – 0.4. The calculated spectrum in the continuum limit shows a systematic deviation from experiment, though the magnitude of deviation is contained within 11%. Results for decay constants and light quark masses are also reported.
pacs:
11.15.Ha, 11.30.Rd, 12.15.Ff, 12.38.Gc, 14.20.-c, 14.40.-nDeriving the light hadron spectrum is a key step of lattice QCD in order to gain a convincing demonstration on the validity of QCD for strong interactions in the low-energy non-perturbative domain. Under the present limitation of computer power, the first possible step toward this goal is to establish the spectrum in quenched QCD, in which the reaction of dynamical sea quarks is switched off. The most extensive effort in this step, amongst numerous studies to date[1], has been made by Butler et al.[2] using the Wilson quark action. Their results, extrapolated to the continuum limit and corrected for finite lattice size effects, show an agreement with the experimental spectrum within 6% for 7 hadron masses calculated as compared to the estimated error of 1 to 9% depending on particles. A similar attempt with the Kogut-Susskind quark action[3] has reported a nucleon mass higher than experiment by 3% with an error of 4%.
In this article we report on our attempt at a quenched calculation with a precision significantly improved over those of previous studies, thereby establishing the quenched spectrum and simultaneously exploring the limitation of the quenched approximation. This effort has been made possible by the CP-PACS computer, a massively parallel system with a peak speed of 614Gflops developed at the University of Tsukuba[4]. For preliminary reports of this work, see Ref. [5].
We carry out our study with the plaquette action for gluons and the Wilson action for quarks. Parameters employed in our simulations are summarized in Table I. Four values of the coupling constant covering the range of lattice spacing – 0.05 fm are chosen, closer toward the continuum limit than – 0.07 fm explored in Ref. [2]. We employ lattices with a physical extent of 3 fm with which we expect negligible finite-size effects: no significant effect is observed for 2 fm within statistical error of about 2%[6]. We select five values of the hopping parameter at which quark mass takes values corresponding to 0.75, 0.7, 0.6, 0.5 and 0.4, the last point being closer to the chiral limit than previous attempts with the Wilson action. We abbreviate the two heavy quarks and the three light quarks as and , respectively.
Gauge configurations are generated by the 5-hit pseudo-heat bath algorithm with subsequent four over-relaxation updates. Quark propagators are solved on configurations fixed to the Coulomb gauge, using both the point source and an exponentially smeared source of a radius fm. For extraction of hadron masses, we use hadron propagators constructed from only smeared sources, since they exhibit the earliest onset of effective mass plateaus and the smallest statistical errors among various source combinations. Masses are determined by correlated fits for degenerate hadrons as well as non-degenerate ones of the type for mesons and and for baryons.
Chiral extrapolation is the most delicate issue in controlling the systematic errors. For this extrapolation, most studies have employed low-order polynomials in quark masses. Quenched chiral perturbation theory (QPT) [7, 8, 9, 10, 11], on the other hand, predicts characteristic singularities in the chiral limit.
For pseudoscalar (PS) mesons made of quarks of masses and , QPT mass formula reads[7, 8]
| (1) | |||||
| (2) | |||||
| (3) |
where the term proportional to represents the quenching effect. The following two quantities
| (4) | |||||
| (5) |
are then related by .
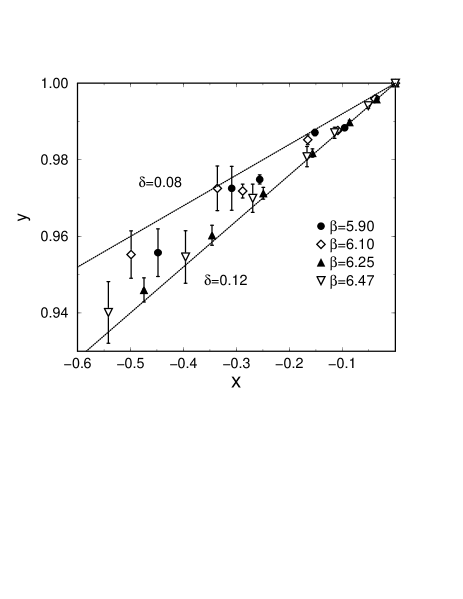
Our PS meson mass data converted to and are shown in Fig. 1. The quark mass determined from the axial Ward identity[12, 13] () is used since it has neither quenched chiral logarithms[14] nor ambiguity due to chiral extrapolations. We observe a clear non-zero slope in the range – 0.12. The ratio used in Ref. [8] receives a correction from the term in (3), and the plot does not fall on a common line.
Similarly, an examination of the relation expected for the decay constant ratio [9] gives a non-zero value of 0.08 – 0.16.
Finally, we make a correlated fit of the PS mass results to the QPT mass formula. For this fit the vector Ward identity quark mass is used, taking as one of the fit parameters. The fitting, made independently for degenerate and non-degenerate cases, yields mutually consistent results for in the range – 0.12 when is varied over – 1.4 GeV.
A noticeable result from this fit is that the value of agrees well with at which linearly extrapolated vanishes with at most 2.8 discrepancy, whereas quadratic (cubic) extrapolation of in results in differing as much as 17 (12). This observation suggests that the QPT fit is legitimate as and should vanish at the same value from their definitions.
We take these results as strong support that our PS meson results are consistent with the presence of quenched chiral logarithms with a magnitude . We should mention that there is in (3) another quenched singularity term of the form [8]. Our mass data do not show clear indications for the presence of this term.
QPT mass formulae for vector mesons[10] and baryons[11] can be schematically written as
| (6) |
where are polynomials of the couplings of the quenched chiral Lagrangian. The coefficient , which is proportional to , represents the quenched singular term. Encouraged by the results for the PS mesons, we attempt to fit our mass data to (6). Fully constraining the large number of coupling parameters (6 for vector mesons and 11 for baryons in addition to and ) is difficult under the limitation of the accuracy of our mass data. We therefore employ and , and drop the couplings of the flavor-singlet PS meson to vector mesons and baryons. Fits are made to degenerate and non-degenerate data together ignoring correlations, as we find correlated fits to be quite unstable. Errors are calculated with the single elimination jackknife method.
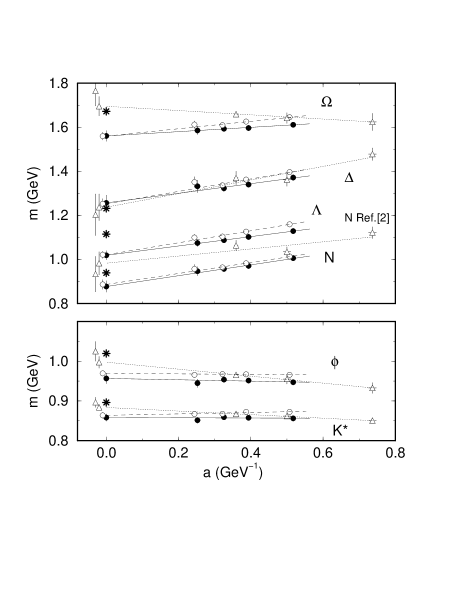
With this procedure we obtain a good fit with small keeping all and terms for vector mesons and decuplet baryons. For octet baryons, we also include terms since the nucleon mass shows a clear negative curvature, which is opposite to the predicted negative sign of (see Fig. 2). We drop the octet-decuplet coupling because the decuplet baryon fits lead to a value of this coupling consistent with zero. These fits yield = for , for nucleon and for when averaged over the four values of the simulation. These values are much smaller than phenomenological estimates: for [10] and for nucleon[11].
We have also attempted to include the terms in the fit for vector mesons and decuplet baryons, and the octet-decuplet coupling for octet baryons, since it is theoretically more consistent to include them. Making this more general fit, we find the values of couplings to change significantly. In particular the coefficient of the term becomes for , for nucleon and for . The stability of fit worsens considerably, however, compared to the fit above: the covariance matrix of the fit is close to singular, and some of the couplings exhibit significant variation with the lattice spacing. Nonetheless, as we illustrate in Fig. 2 for representative hadron masses, the curves from the two fits (dashed lines for the general fit and solid lines for the simplified fit as described in the previous paragraph) are indistinguishable in the range of measured points. The deviation remains small even at the physical point (second points from left in Fig. 2).
We conclude that the accuracy of the mass results and the covered range of quark mass are not sufficient to establish the presence of the quenched singular term for vector mesons and baryons. We adopt the former fit with simplified QPT formulae in the subsequent analyses as it is overall more stable.
We emphasize that adopting the latter general fit does not affect our conclusions below, as changes in hadron masses at the physical point are 5% () or less at finite lattice spacings and at most 1.2% () after the continuum extrapolation. We have also checked that varying over 0.08 – 0.12 ( over – ) changes the mass results by no more than 0.4% (1.3) (2.9%(4.7)) at finite lattice spacings and 0.3% (0.3) (2.2%(1.4)) in the continuum limit.
The physical point for up and down quarks and the lattice scale are fixed from the experimental values of = 0.1350 GeV and = 0.7684 GeV, and the strange quark mass by that of = 0.4977 GeV or = 1.0194 GeV. We then extrapolate the results linearly in the lattice spacing to the continuum limit. We find that of the fit with only the leading scaling violation term is reasonably small () for each hadron. The statistical error in the continuum limit is 1–3%. In Fig. 3 are shown typical continuum extrapolations. The magnitude of scaling violation at fm, the mid-value of the range of our lattice spacing, is at most 10%. We then expect that terms have an effect of 1% or less, which is smaller than the statistical error.
In order to examine how much our results in the continuum limit depend on the QPT fit, we repeat the analysis with the conventional polynomial fit of hadron masses in terms of . This fit (cubic for nucleon, quadratic for others including PS mesons) yields masses at the physical point differing by at most 3% at finite lattice spacings relative to the QPT fit, and less than 1.6% (1.6) in the continuum limit. The continuum extrapolations for the QPT and polynomial chiral fits are compared in Fig. 3, with filled circles and solid lines for the former and open circles and dashed lines for the latter.
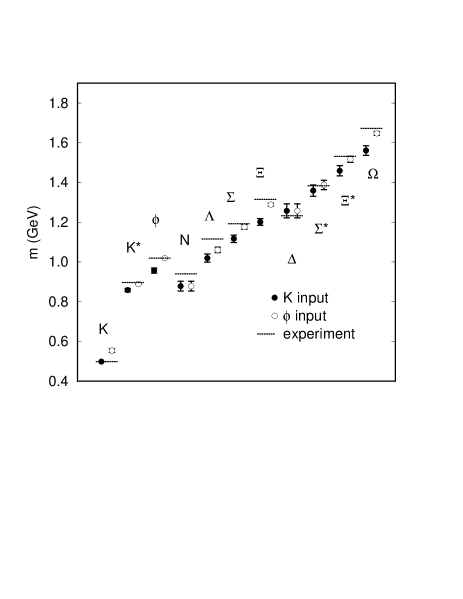
We present our final result for the quenched light hadron spectrum in Fig. 4. The numerical values are given in Table II. Systematic errors, being comparable or less than the statistical ones, are not included.
Our chief finding, quite clear from Fig. 4, is that the quenched spectrum systematically deviates from the experimental spectrum. Quantitatively stated, if one uses the meson mass to fix the strange quark mass, the vector meson masses and are smaller by 4% (4) and 6% (5), respectively, the octet baryon masses are smaller by 6–9% (4–7), and so are the decuplet mass splittings (30% on average). Alternatively, if is employed to fix the strange quark mass, agrees with experiment within 0.8% (2) and the discrepancies for baryon masses are much reduced. However, is larger by 11% (6). As one sees in Table II this 11% represents the largest deviation between our results and the experiment.
Our finding of a small mass splitting between and differs from that of Butler et al.[2] who found an agreement with experiment. Another difference is the masses of and baryon determined with as input, for which they reported values higher than experiment by 3–5%, while our results are smaller by a similar magnitude. How these differences arise are shown in Fig. 3 where the results of Ref. [2] are plotted by open triangles. For the nucleon both the results from Butler et al.[2] and the MILC collaboration[3] are consistent with experiment; our value is smaller by 7% (2.5).
We also calculate PS decay constants and quark masses using tadpole-improved one-loop values for renormalization constants. For the PS decay constant we find MeV and MeV with as input, which are smaller than experiment by 9%(2) and 13%(5), respectively. Quark masses are determined by a combined linear continuum extrapolation of and , since the large difference of values from the two definitions at finite lattice spacings[13, 15] vanishes toward the continuum limit[5]. We obtain =4.55(18) MeV, and =115.1(2.3) MeV ( input) or 142.9(5.8) MeV ( input) in the scheme at GeV. A 20% disagreement between the two values for originates from the small meson hyperfine splitting, and hence represents a quenching effect.
In conclusion we have found that the light hadron spectrum in quenched QCD systematically deviates from the experimental spectrum when examined with accuracy better than a 10% level. In the course of analyses we have observed a strong support for the presence of quenched chiral singularities for pseudoscalar mesons. Whether vector mesons and baryons also have such singularities, however, remains as a problem for future investigations.
We thank all the members of the CP-PACS Project with whom the CP-PACS computer has been developed. Valuable discussions with M. Golterman and S. Sharpe are gratefully acknowledged. This work is supported in part by the Grants-in-Aid of Ministry of Education (Nos. 08NP0101 and 09304029). GB, SE, and KN are JSPS Research Fellows. HPS is supported by JSPS Research for Future Program.
REFERENCES
- [1] For recent reviews see, R. Kenway, hep-lat/9810054; T. Yoshié, Nucl. Phys. B (Proc. Suppl.) 63, 3 (1998).
- [2] F. Butler et al., Nucl. Phys. B430, 179 (1994).
- [3] MILC Collaboration, C. Bernard et al., Phys. Rev. Lett. 81, 3087 (1998).
- [4] Y. Iwasaki, Nucl. Phys. B (Proc. Suppl.) 53, 1007(1997); T. Boku, K. Itakura, H. Nakamura, K. Nakazawa, in Proceedings of ACM International Conference on Supercomputing’97, 108 (1997).
- [5] CP-PACS Collaboration, S. Aoki et al., Nucl. Phys. B (Proc. Suppl.) 60A, 14 (1998); ibid. 63, 161 (1998); hep-lat/9809146; R. Burkhalter, hep-lat/9810043.
- [6] MILC Collaboration, C. Bernard et al., Nucl. Phys. B (Proc. Suppl.) 60A, 3 (1998).
- [7] S. R. Sharpe, Phys. Rev. D 46, 3146 (1992).
- [8] C. W. Bernard and M. F. L. Golterman, Phys. Rev. D 46, 853 (1992).
- [9] C. W. Bernard and M. F. L. Golterman, Nucl. Phys. B (Proc. Suppl.) 30, 217 (1993).
- [10] M. Booth et al., Phys. Rev. D 55, 3092 (1997).
- [11] J. N. Labrenz and S. R. Sharpe, Phys. Rev. D 54, 4595 (1996).
- [12] M. Bochicchio et al., Nucl. Phys. B262, 331 (1985).
- [13] S. Itoh et al., Nucl. Phys. B274, 33 (1986).
- [14] M. Golterman and S. Sharpe, private communications.
- [15] T. Bhattacharya, R. Gupta, G. Kilcup and S. Sharpe, Phys. Rev. D 53, 6486 (1996).

| (GeV) | (fm) | #conf. | sweep/conf | ||
|---|---|---|---|---|---|
| 5.90 | 1.934(16) | 3.26(3) | 800 | 200 | |
| 6.10 | 2.540(22) | 3.10(3) | 600 | 400 | |
| 6.25 | 3.071(34) | 3.08(3) | 420 | 1000 | |
| 6.47 | 3.961(79) | 3.18(6) | 150 | 2000 |
| input | input | ||||
|---|---|---|---|---|---|
| exp. | mass(GeV) | deviation | mass(GeV) | deviation | |
| 0.4977 | 0.553(10) | 11.2% 5.6 | |||
| 0.8961 | 0.858(09) | 4.2% 4.3 | 0.889(03) | 0.8% 2.3 | |
| 1.0194 | 0.957(13) | 6.1% 4.8 | |||
| 0.9396 | 0.878(25) | 6.6% 2.5 | 0.878(25) | 6.6% 2.5 | |
| 1.1157 | 1.019(20) | 8.6% 4.7 | 1.060(13) | 5.0% 4.1 | |
| 1.1926 | 1.117(19) | 6.4% 4.1 | 1.176(11) | 1.4% 1.5 | |
| 1.3149 | 1.201(17) | 8.7% 6.8 | 1.288(08) | 2.0% 3.5 | |
| 1.2320 | 1.257(35) | 2.0% 0.7 | 1.257(35) | 2.0% 0.7 | |
| 1.3837 | 1.359(29) | 1.8% 0.9 | 1.388(24) | 0.3% 0.2 | |
| 1.5318 | 1.459(26) | 4.7% 2.8 | 1.517(16) | 1.0% 0.9 | |
| 1.6725 | 1.561(24) | 6.7% 4.7 | 1.647(10) | 1.5% 2.6 | |