UTCCP-P-63, UTHEP-401 March 1999 Hadron spectroscopy from lattice QCD
Abstract
I present recent developments in the lattice QCD calculations of the light hadron spectrum. Emphasis is placed on the limitation of the quenched approximation in reproducing the observed spectrum and indications that the discrepancy is reduced by introducing two flavors of light dynamical quarks.
1 INTRODUCTION
QCD is believed to be the fundamental theory of strong interactions. This recognition first came from perturbation theory, which enables us to describe hadronic processes with large momentum transfer. However, the conventional perturbative approach fails at low energies 1 GeV, where the strong coupling constant is of order unity.
In this region, lattice QCD provides us with a non-perturbative tool to calculate physical quantities of hadrons from first principles. A lot of works have been devoted over two decades to numerical simulations of lattice QCD, and gradually revealed that numerical method is a powerful and practical tool.
Lattice QCD has been applied to calculations of the hadronic spectra including glueballs and hybrids, the hadronic matrix elements of operators of importance to weak decays and other hadronic quantities such as the pion nucleon sigma term and the proton spin carried by the quarks. High temperature QCD has been an important research area of lattice QCD. The topological structure of the QCD vacuum has also been investigated, because it may provide a qualitative understanding of the mechanism responsible for confinement and spontaneous breakdown of chiral symmetry.
Among various subjects pursued by lattice QCD, deriving the light hadron spectrum is a key step, because it will be a fundamental confirmation of QCD at low energies and give us confidence when we apply lattice QCD to calculations of other physical quantities. Considerable progress has been achieved in this field over the past two years [1].
2 SYSTEMATIC ERROR IN LATTICE CALCULATIONS
The first attempt to calculate the light hadron spectrum was made in 1981 [2, 3]. Numerous studies devoted to this issue have revealed afterwards that we have to overcome several difficulties to obtain numerically precise results.
Because of the limitation of computer power, most of works to calculate physical quantities of hadrons employ quenched approximation, in which we ignore sea quark effects. One may expect that the quenching error is not so large, because the valence quark model describes qualitatively the observed spectrum. However it it difficult to evaluate the magnitude of the error theoretically. In order to justify the approximation, we first have to estimate its magnitude by comparing the quenched spectrum with experiment.
In lattice QCD, the prediction for the real world can be obtained only after we take the infinite volume and continuum limit. Therefore we have to control systematic errors due to finite lattice size and finite lattice spacing. In addition, because computational cost rapidly becomes very large as the quark mass decreases, one has to extrapolate results obtained at heavy quark masses to the physical up and down quark masses. Present typical calculations are still limited to the range of the quark mass 30 MeV.
The first step toward the goal of the spectrum calculation is therefore to obtain the definitive result for the quenched QCD spectrum, by controlling all systematic errors arising from extrapolations mentioned above.
3 QUENCHED QCD SPECTRUM
3.1 A history
| year | 1982 | 1985 | 1988 | 1993 | 1998 |
|---|---|---|---|---|---|
| 16 | 24 | 50 | 50 | 56–112 | |
| 8 | 12 | 16–24 | 24–36 | 32–64 | |
| (fm) | 0.8 | 1.2 | 1.4–1.7 | 2.0–2.5 | 3.0 |
| (fm) | 0.14–0.1 | 0.14–0.1 | 0.14–0.1 | 0.1–0.07 | 0.1–0.05 |
| (MeV) | 160–30 | ||||
| 0.75–0.4 | |||||
| statistics | 20 | 20 | 50 | 200 | 150–800 |
Instead of reviewing a long history of quenched spectrum calculations, we reproduce in Table 1 typical simulation parameters versus year. () in the table is the number of points in the temporal (spatial) direction and is the lattice spacing. Before 1993, physical lattice sizes were limited to the range 2 fm, which was smaller than a typical size of hadrons, and therefore works made before 1993 were in an exploratory stage. In the table, we reproduce, in addition to the quark mass, corresponding value of the pseudo-scalar vector mass ratio (), which is often quoted to show how close we are to the physical up and down quark masses, 5 MeV. The ratios were limited to the range , ( 40 MeV), which was far from at the physical point.
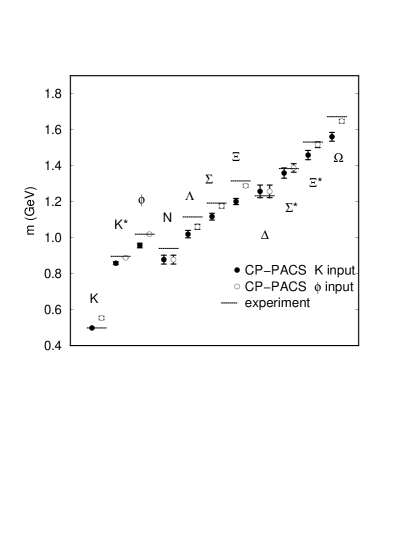
A turning point of the calculation of the quenched spectrum was marked by the GF11 collaboration around 1993 [4]. They made simulations at three lattice spacings ranging over 0.1–0.07 fm on lattices with 2.3 fm. After making continuum extrapolations and a finite size correction, they obtained results shown in Fig.2. In their calculation, masses of , and were taken as input to fix the lattice spacing, the physical (and degenerate) up and down quark masses and the strange quark mass. Although the entire spectrum was not covered, their results turned out to be consistent with experiment, within one standard deviation, or 1–9 %.
In spite of this encouraging result, there was no further work to give results for the entire spectrum with errors convincingly better than 5 %. In particular, the question of how the quenched QCD spectrum deviates from experiment was not answered.

3.2 State-of-the-art calculation
A report from the CP-PACS collaboration in 1998 [5, 6] changed the situation. They made an extensive simulation to obtain the quenched spectrum with errors of 1–2 % for mesons and 2–3 % for baryons. Their results have sufficient accuracy to discuss how the quenched spectrum deviates from the experimental spectrum. In Fig.2 are summarized their spectrum result.
First, we notice that the discrepancy between the CP-PACS result and experiment is less than 11 percent. This means that the quenching error is of order 10 %, which is not so large as we have expected. This observation is important because we may expect that the quenching error is generally of a similar order also for other physical quantities.
In Fig.2, one can see statistically significant and systematic deviation of the quenched spectrum from experiment, amounting to 7 for some particles. How the quenched spectrum deviates is summarized as follows. If one uses meson mass as input to fix the strange quark mass, 1) masses of vector mesons and are smaller than experiment, 2) octet baryon masses are systematically smaller than experiment and 3) decuplet baryon mass splitting is smaller than experiment. If one uses instead of as input, appears consistent with experiment and the discrepancies for baryon masses are much reduced. However, turns out to be much higher. In other words, the meson hyperfine splitting remains smaller than experiment.
In summary, the CP-PACS results show that the strange quark mass cannot be tuned in quenched QCD so that all strange hadron masses are in agreement with experiment.
3.3 Possible systematic error
Controlling systematic errors is a basic element in spectrum calculations. We discuss in some detail the CP-PACS attempt to reduce them so that the reader can understand what was improved and how large the remaining errors are.
They performed simulations on four lattices with 3 fm. For these lattices, finite size effect is estimated to be smaller than 0.4 % for the worst case.
The CP-PACS collaboration employed the Wilson’s formulation of quarks on a lattice. For continuum extrapolations with the Wilson action, the leading correction to the continuum value is proportional to the lattice spacing:
| (1) |
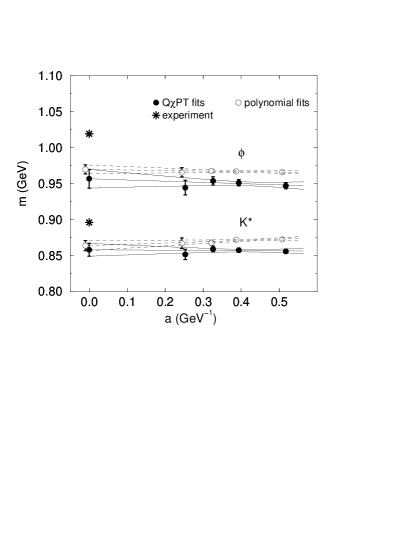
CP-PACS data are fitted well by a linear function of the lattice spacing, as shown in Figs. 4 and 4. The coefficient of the linear term ranges from 0 to 0.28 GeV. One can evaluate the magnitude of higher order terms, assuming that . We find that the quadratic term has an effect of at most 1 % at fm, the central value of the range of their lattice spacings. Therefore finite lattice spacing effect which may not be removed by linear extrapolations is estimated to be 1% or less.
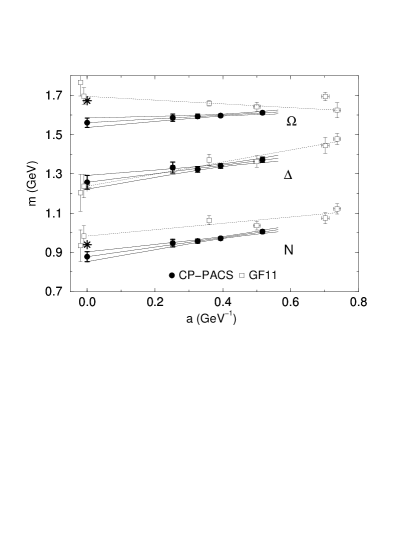
Chiral extrapolation is the most delicate issue in controlling systematic errors. The CP-PACS collaboration performed simulations at five quark masses corresponding to = 0.75, 0.7, 0.6, 0.5 and 0.4. Previous studies with the Wilson quark action were limited to the range 0.5, or 40 MeV. Data at the smallest quark mass, 30 MeV, are indeed important for reliable chiral extrapolations. For example, the nucleon mass as a function of the quark mass shows a clear negative curvature, as shown in Fig.6, which may not be uncovered if the data at the smallest quark mass were lacking: Indeed, the GF11 collaboration made a linear chiral extrapolation. Consequently, hadron masses at finite lattice spacing and hence continuum extrapolations are quite different from those of GF11. See Fig.4 for examples.


Theoretically, chiral extrapolations in quenched QCD are more complicated than in full QCD. The quenched chiral perturbation theory (QPT) [7] predicts characteristic singularities in hadron masses in the chiral limit. Therefore we first have to check numerically the validity of the prediction. The CP-PACS collaboration extensively investigated this issue and found several evidences for the existence of the quenched chiral singularities. We reproduce one example. In full QCD, the relation holds. In quenched QCD, however, has a logarithmic singular term and the ratio diverges toward the chiral limit. As Fig.6 shows, the CP-PACS data exhibits a clear increase of the ratio.
The CP-PACS collaboration employed QPT mass formulae[7, 8] for chiral extrapolations. They also repeated the whole analysis employing conventional polynomials in quark masses to investigate the effect of choosing totally different chiral ansatz. They found that the difference in the continuum limit was 1.5 % for the worst case, which was only a 1.5 effect. We reproduce their comparison of meson masses in Fig.4.
From these considerations, we conclude that the CP-PACS collaboration successfully reduced systematic errors to the magnitude of their statistical ones. Because the deviation from experiment amounts to 4–7 , taking account of systematic errors does not change their conclusions in any significant ways.
Although the CP-PACS results are very convincing, a crosscheck is of course necessary. Two years ago, the MILC collaboration calculated [9] the nucleon mass in the continuum limit using the Kogut-Susskind quark action, another popular formulation of quarks on a lattice. Their result MeV is slightly larger than experiment, while MeV from the CP-PACS is smaller. Understanding the difference, albeit only a 2.5 effect, is important. Also, the MILC collaboration calculated only the nucleon mass. It is desired to establish the entire spectrum for the Kogut-Susskind action.
4 IMPROVEMENT PROGRAM
The CP-PACS result above was obtained by a full use of one of the fastest computers in the world, CP-PACS, for about one year. Such a huge computational cost may make us pessimistic in doing realistic calculations in full QCD. Roughly speaking, computational cost for full QCD simulations is 100–1000 times larger than that for quenched QCD. Even in quenched QCD, there are many problems which need much more computer time than the simple spectrum calculation.
A breakthrough to this situation may be given by improving lattice actions. The basic idea is as follows. Let us recall how we estimate the magnitude of the systematic error due to finite lattice spacing. Because the leading correction is for the Wilson action, and we fit data with a linear function, the remaining error is of , which turned out to be about 1% at 0.075 fm. Now suppose that we can invent an improved lattice action which has in principle no correction. If one uses the action and performs a fit using a quadratic function of the lattice spacing, the remaining error is reduced to . In this case, we can obtain values in the continuum limit with the same accuracy from simulations at 0.15 fm. This value is larger by a factor two than for the Wilson action. We perform simulations with the physical lattice size being kept fixed, while computational cost depends on , but not on . Because computational cost becomes large faster than the number of lattice points , computational cost is reduced by at least a factor 16 for the improved action.
Years ago, Symanzik argued a general method to improve lattice action, order by order in lattice spacing, by adding higher dimensional terms to the original one [10]. Sheikholeslami and Wohlert then derived the improved action[11] for the Wilson quark action. The form of the improved action is given by
| (2) |
where is the gauge coupling and is the field strength. Because the lattice representation of looks like a clover with four leaves, the action is often called “clover action”. The coefficient can be calculated perturbatively or non-perturbatively.
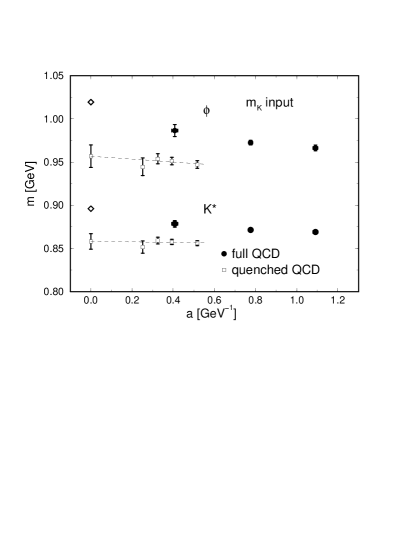
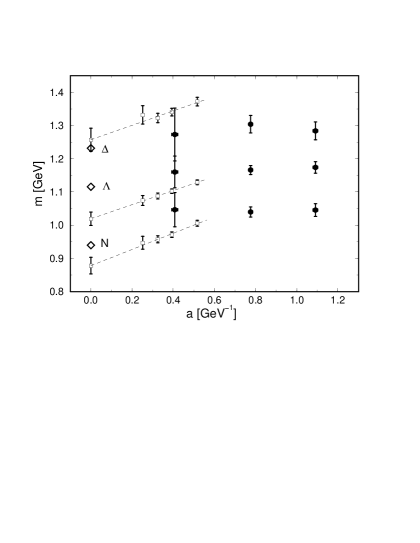
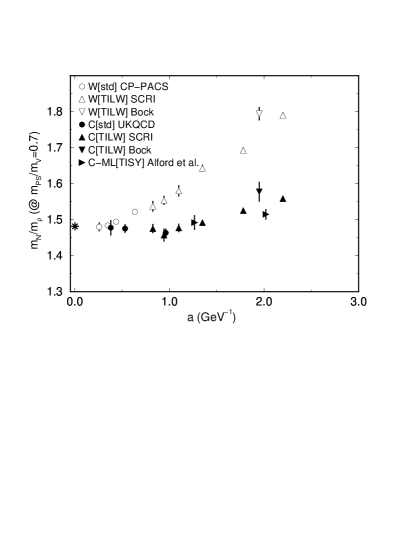
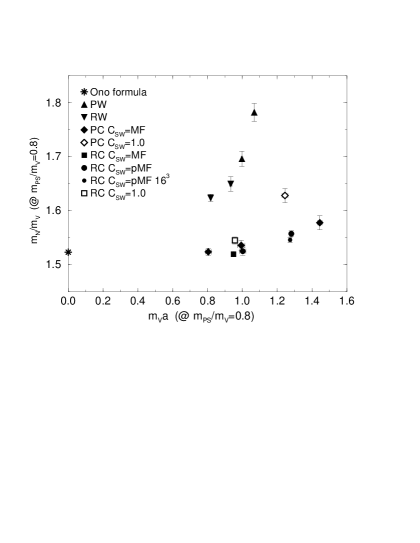
Fig.8 shows a compilation of the results for the nucleon to mass ratio () at 0.7 as a function of the lattice spacing. We clearly observe that improving actions significantly reduces scaling violation so that the ratio agrees with a phenomenological value (the star in the figure) within 5% already at fm, whereas the scaling violation for the Wilson action amounts to 20% at the same lattice spacing.
5 FULL QCD SPECTRUM
The observation of improvement in full QCD encourages us to do a systematic study of the full QCD spectrum using improved actions. The CP-PACS collaboration is now working on this subject [6, 13], employing a renormalization group improved action for gluons and the clover action for quarks. They simulate two degenerate sea quarks, identified with the up and down quarks, while the strange quark is treated in the quenched approximation. Calculations are made at three lattice spacings in the range 0.2 – 0.1 fm, keeping the physical lattice size at 2.4 fm. For chiral extrapolations and interpolations to the physical strange quark mass, they use data at four sea quark masses in the range = 0.8–0.6 and five valence quark masses with = 0.8–0.5.
Our interest at this stage is how the discrepancy observed in quenched QCD is reduced, when one introduces two light dynamical quarks. We reproduce in Figs.10 and 10 the CP-PACS results as a function of the lattice spacing and compare them with the quenched spectrum. We clearly observe that vector meson masses extrapolate to values noticeably clover to experiment than those for quenched QCD. The remaining discrepancy might be due to the quenching effect of the strange quark. Sea quark effects in baryon sector are less clear. We observe small scaling violation for baryons, which is an encouraging result. However, the mass results lie 5–10% larger than experiment. The discrepancy might be due to possible finite size effects ( 2.4 fm for the full QCD data, while 3.0 fm for the quenched QCD data), or chiral extrapolation uncertainties (the smallest quark mass for full QCD corresponds to , while for quenched QCD). Further study is necessary to clarify sea quark effects in baryon masses.
6 CONCLUSIONS
In summary, we now have precise results for the quenched QCD spectrum which reproduces the observed spectrum with discrepancies of order 10 %. Simulations with two dynamical quarks show indications that the discrepancies in quenched QCD for the strange hadron spectrum are reduced, although we still have to treat the strange quark in the quenched approximation.
In my opinion, successful application of improved actions and fast development of computer power have combined to open a new era of lattice QCD simulations. A realistic calculation of full QCD will be achieved in the near future, which would shed new light on hadron physics at low energies.
I thank members of CP-PACS group for their collaboration. I am grateful to Y.Iwasaki and A.Ukawa for valuable suggestions on the manuscript. This work is supported in part by the Grant-in-Aid No.09304029 of Ministry of Education and University of Tsukuba Project Research.
References
- [1] For recent reviews see R.Kenway, plenary talk at Lattice’98, hep-lat/9810054 ; T.Yoshié, Nucl.Phys.B (Proc. Suppl.) 63 (1998) 3.
- [2] H.Hamber and G.Parisi, Phys. Rev. Lett. 47 (1981) 1792.
- [3] D. Weingarten, Phys. Lett. 109B (1982) 57.
- [4] F.Butler et al., Nucl.Phys. B430 (1994) 179.
- [5] CP-PACS Collaboration, S. Aoki et al., presented at Lattice’98, hep-lat/9809146.
- [6] R.Burkhalter, plenary talk at Lattice’98, hep-lat/9810043.
- [7] S.R.Sharpe, Phys.Rev. D46 (1992) 3146; C.W.Bernard and M.F.L.Golterman, Phys.Rev. D46 (1992) 853.
- [8] J.N.Labrenz and S.R.Sharpe, Phys.Rev. D54 (1996) 4595 ; M.Booth et al., Phys.Rev. D55 (1997) 3092.
- [9] MILC Collaboration, C. Bernard et al., Phys.Rev.Lett. 81 (1998) 3087.
- [10] K.Symanzik, Nucl.Phys. B226 (1983) 187,205.
- [11] B.Sheikholeslami and R.Wohlert, Nucl.Phys. B259 (1985) 572.
- [12] CP-PACS Collaboration, S. Aoki et al., hep-lat/9902018.
- [13] CP-PACS Collaboration, S. Aoki et al., presented at Lattice’98, hep-lat/9809120.