Monte-carlo renormalization group study of gauged spin models in two dimensions ††thanks: Presented by R.R. Horgan. This work is supported by NATO collaborative research grant no. CRG950234 and in part by the Leverhulme Trust.
Abstract
The 2D gauge model is studied using the Monte-Carlo Renormalization Group (MCRG). We confirm the first-order transition reported in [1] ending in a critical point associated with vorticity. We find evidence for a new renormalized trajectory (RT) which is responsible for a cross-over from the vortex dominated regime to the regime as the coupling is reduced. Near to the cross-over region a good signal for scaling will be observed in but this is illusory and is due to the proximity of the RT. We suggest that this is the origin of the ‘pseudo’-scaling observed in [2]. We find that the continuum limit of is controlled by the fixed point.
1 Introduction
In [2] the mass gap measurement in the matrix model was compared with the Bethe-Ansatz prediction and found to disagree by a factor of four although for the covering group model there was good agreement. It was concluded that the signal for scaling in the simulation was only apparent and that a true continuum limit had not been achieved. It was conjectured that the deception was due to vortices, present in but absent in the covering group. Here we investigate whether vortices can cause a bogus signal for scaling in the 2D gauge model which allows an interpolation between the pure and the spin models and which also contains vortices.
We find evidence for the fixed point and for a scaling flow which indicates the presence of a new renormalized trajectory (RT). We suggest that this RT will cause an apparent scaling signal of the kind reported in [2] and that it is responsible for an observed cross-over effect.
It has also been conjectured [3] that in 2D the continuum limit in pure is distinct from that in pure . Niedermayer et al. [4] and Hasenbusch [5] have suggested that this conjecture is incorrect and that the continuum limit in the model is controlled by the fixed point. The work we report here supports this conclusion.
The action used is
| (1) |
where is a unit length three-component vector at site and is a gauge field on the link taking values in . The plaquette of gauge fields is denoted by and vortices reside on plaquettes where . The pure and spin models correspond to and respectively.
A local update was used comprising a combination of heat-bath, microcanonical and demon schemes. Lattice sizes ranged from to with typically configurations per run. The simulations were carried out on the HITACHI SR2201 computers in the Cambridge High Performance Computing Facility and in the Tokyo Computing Centre.
2 The MCRG scheme
To establish the topology of RG flows we study how the mean values of the spin-spin interaction, , and of the plaquette, , flow under blocking. For a given configuration these operators are given by
| (2) |
and the vorticity is .
For each configuration on a lattice of side we derive a blocked configuration on a lattice of side . The blocking transformation for the spins is
where runs over nearest neighbour displacements from , and was chosen to be 0.0625 . To block the links the gauge field products were computed for the three shortest Wilson paths joining the end points of the blocked link. The blocked gauge field was assigned the majority sign of the .
For given coupling constants and given lattice size each configuration was blocked by successive transformations until the blocked lattice was . The operators and were then measured and averaged over all configurations. This was done for giving a flow segment in the plane with each point labelled by initial lattice size. The flow can be extended by tuning new couplings so that
| (3) |
for some and . The segment for fixed can then be computed. These flows result from a projection onto the plane of true trajectories in a higher-dimensional coupling constant space. The assumption is that only and correspond to relevant operators and that by blocking the effect of irrelevant variables is minimized.
3 Results and Conclusions
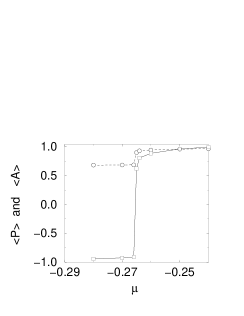
There is a line of first-order transitions, first reported in [1], for and . We find that this line of transitions ends at the “vorticity” critical point. In figure 1 we plot and versus for . The order parameter is the vorticity. The linear combination with shows no discontinuity in this region. is closely related to the action, (eqn. 1), and it is reasonable to interpret as the free energy. Also, is the correct operator to interpolate the vector state associated with the critical surface where the corresponding correlation length will diverge but which remains finite at the vorticity critical point.
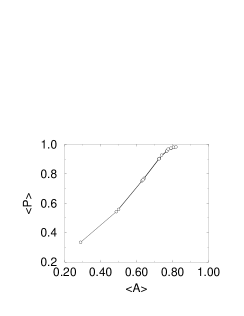
There is a set of neighbouring flows on which the observables scale. The example shown in figure 2 shows that there is a RT in the vicinity which must be associated with a new fixed point. To see that observables scale each flow segment of four points was successively overlaid using eqn. (3) with . For the scaling flows the points of the overlaid flow segments coincide very well within errors. The flow is consistent with an exponent with critical couplings . Of course, the new fixed point will not lie in the plane and its relationship with the vorticity critical point is unclear. Open questions are: can the continuum limit of the new RT be taken at the vorticity critical point and does there exist a continuum limit with a non-zero vorticity density? It is intriguing that the position of the vorticity critical point and the critical couplings deduced from the fit for are very similar. The nature of the new fixed points needs more investigation.
Scaling on the RT () was verified and agreement with the 3-loop perturbative function was found after effects due to finite were accounted for using perturbation theory.
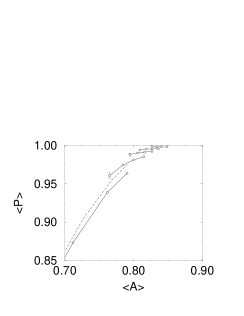
The pure model () does not intersect any critical surface except the one controlled by the fixed point at (). This confirms the conjectures of [4, 5] that and have the same continuum limit. In figure 3 flow segments for the are shown for various in the range to . There is a clear cross-over in the blocked vorticity, , as increases through this range. Moreover, the flows to larger renormalize close to the scaling flow, shown in figure 3 as a dotted line. Hence, for we should expect to see a good signal for scaling induced by the associated new RT. However, this scaling is not a signal for a continuum limit in but is due to the proximity of the cross-over region to the new fixed point to which it is due. As is increased through the cross-over region scaling will be violated and eventually reappear in association with the true continuum limit controlled by the fixed point. We believe that this is the origin of the bogus scaling observed in [2].
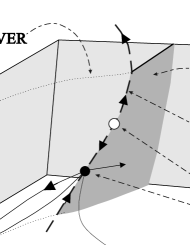
In figure 4 we shown an artist’s impression of a possible topology for the RG flows.
References
- [1] S. Solomon et al., Phys. Lett. 112B, 373–378, 1982.
- [2] M. Hasenbusch and R.R. Horgan, Phys. Rev. D53, 5075–5089, 1996.
- [3] S. Caracciolo et al., Phys. Rev. Lett. 71, 3906–3909, 1993.
- [4] F. Niedermayer et al. Phys. Rev. D53, 5918–5923, 1996.
- [5] M. Hasenbusch, Phys. Rev. D53, 3445–3450, 1996.