Fate of the Critical Line and Chiral Transition in Finite-Temperature Lattice QCD with the Wilson Quark Action
Abstract
Finite-temperature phase structure of lattice QCD with the Wilson quark action is analyzed. We show that the critical line at finite temperatures, defined to be the line of vanishing pion screening mass, turns back toward strong coupling, forming a cusp on the plane, and that the line of thermal transition runs past the tip of the cusp without touching the critical line. Previous results are discussed in the light of our findings.
1 Introduction
Despite extensive effort over the years[1, 2, 3] the finite-temperature phase structure of lattice QCD with dynamical Wilson quarks has not been fully clarified to date. The difficulty, originating from an explicit breaking of chiral symmetry with the Wilson action, arises from the question in what sense the concept of the critical line of vanishing pion mass at zero temperature extends to the finite-temperature system and how the line behaves in the space of the inverse gauge coupling constant and the hopping parameter . This is an issue of fundamental importance, not answered by previous studies, which only examined the relation between the line of thermal transition and the zero-temperature critical line. In this article we report our resolution of the issue[4] based on the idea of spontaneous breakdown of parity and flavor symmetry[5].
2 Phase diagram for two flavors
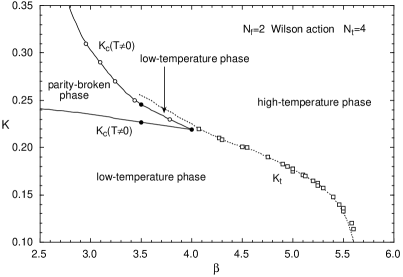
We define the critical line for the finite-temperature system on a lattice of a temporal lattice size by the vanishing of pion screening mass extracted from the pion propagator for a large spatial separation. The line thus defined represents a natural extension of the zero-temperature critical line in that (i) it smoothly converges to the latter as , and that (ii) it corresponds to a singularity of the finite-temperature lattice QCD partition function. Let us also define to be the line of thermal transition, the thermal line. With these definitions the phase diagram we find for the case of flavors on an lattice is presented in Fig. 1. The solid line is our estimate of the critical line obtained by an interpolation of points where the pion screening mass vanishes (solid circles) or the number of conjugate gradient iterations in hybrid Monte Carlo runs is estimated to diverge (open circles). The dotted line is the thermal line with open squares representing its location reported in previous simulations[1, 2, 3].
Let us emphasize the novel features of our phase diagram. Contrary to the zero-temperature case, the critical line does not extend toward arbitrarily weak coupling, but rather turns back toward strong coupling at a finite value of , forming a cusp. The location of the critical line before the turning point is generally shifted from that at zero temperature. For an lattice the shift is small, however. We expect the tip of the cusp to be rounded if examined at a fine scale, and that there will be four more of such cusps in the entire plane. The region bounded by the critical line represents a phase in which parity and flavor symmetry is spontaneously broken[5].
We point out that the absence of the critical line toward weak coupling provides a natural explanation of the fact, observed in previous simulations[2, 3], that physical quantities in the high-temperature phase vary smoothly across the zero-temperature critical line.
Another important feature of our phase diagram is that the thermal line runs past the tip of the cusp of the critical line and continues toward larger values of . In other words the low-temperature phase goes around the cusp and extends into the region bordered by the upper part of the critical line. This contrasts with the conclusion of the QCDPAX Collaboration that the two lines meet at [2]. This point is discussed later.
3 Evidence for the phase diagram
3.1 Gross-Neveu model in two dimensions

An instructive hint on the nature of the critical line is provided by the two-dimensional Gross-Neveu model formulated with the Wilson quark action[6]. In the large limit the critical line of this model can be calculated from the saddle point equations for the pion mass. The result is shown in Fig. 2 on the plane of the bare coupling constant and bare quark mass , where the temporal lattice size is taken to be and from inside to outside.
At zero temperature there are multiple critical lines forming three cusps at . Outside of the critical line is the normal phase, while inside is the parity-broken phase characterized by . Pion is interpreted as the zero mode of the second-order transition separating the two phases[5]. The conventional continuum limit is taken near along the upper critical line. The existence of two additional cusps arises from an exchange of doublers and physical fermion as is varied.
At finite temperatures the cusps move away from the weak-coupling limit . As a result the critical line forms a single continuous line.

3.2 Zero-temperature simulations
The chiral properties of the Gross-Neveu model are similar to those expected for lattice QCD. This leads us to anticipate that the structure and characterization of the critical line are also similar except that there will be five cusps for QCD due to an increase of dimensions from two to four.
The existence of a parity broken phase in QCD was originally suggested by an analytical calculation in the strong coupling limit in the expansion[5]. In Fig. 3 we show a comparison of the analytical prediction and our hybrid Monte Carlo results for the parity-flavor order parameter for the case in the presence of a symmetry-breaking external field . A good agreement between the two results supports the conclusion of the large analysis that parity and flavor symmetry become spontaneously broken for at .

In Fig. 4 we plot the zero-temperature and masses at in quenched QCD as a function of . The right-most set of data points are taken from the APE Collaboration[7], while the rest of data are obtained with configurations on a lattice. In addition to the conventional critical line at , we observe clear indictions for three more values of . While the fourth value expected toward is yet to be confirmed, this provides evidence that there are multiple critical lines toward weak coupling in QCD.
3.3 Finite-temperature simulations
In order to determine the shape of the finite-temperature critical line, we have carried out hybrid Monte Carlo simulations for the system on an lattice in the region and .
At results for the pion screening mass demonstrate that there exists a second critical value at beyond the conventional value at (see Fig. 2(a) in Ref. [4]). The behavior of the pion mass is similar to that around in Fig. 4. A parallel analysis at shows that the gap between the two critical values is either extremely narrow or disappears just below (Fig. 2(b) in Ref. [4]). Since previous simulations[1, 2, 3] found no singular behavior beyond the thermal line down to [2], we conclude that the critical line turns back toward strong coupling in the vicinity of .
We expect the number of conjugate gradient iterations for evaluating quark propagators in hybrid Monte Carlo runs to diverge toward the critical line. Extrapolating linearly in at a fixed , we estimate the location of the critical line for several values of . The results, together with those from the pion mass, are smoothly connected, forming a cusp as is shown in Fig. 1.
A characteristic feature of the high temperature phase is that the pion screening mass takes a finite value. Such a phase can not include the critical line where the screening mass vanishes. Thus the region close to the entire critical line has to be in the low temperature phase. The validity of this argument is confirmed through measurements of the quark and gluon entropy and the Polyakov line. Results at show that these quantities decrease toward the second critical value when it is approached from larger values of , and become comparable in magnitude to those below the conventional critical value which is in the low temperature phase (see Fig. 3(a) in Ref. [4]).
This means that the thermal line can not cross the critical line. Since the two lines are known to come close around [2], we conclude that the thermal line runs past the tip of the cusp and continues toward larger values of . Our results for thermodynamic quantities taken around the tip of the cusp at (Fig. 3(b) in Ref. [4]) and those in the literature[2, 3] are consistent with this conclusion.
4 Discussions
4.1 Comparison with previous results
A naive expectation for the chiral transition with dynamical Wilson quarks is that the thermal line would intersect the zero-temperature critical line, which would naturally define the point of chiral transition in that it would be the point of vanishing pion mass separating the low- and high-temperature phases. Early work[1] guided by this idea failed to find the crossing point. More recently the QCDPAX Collaboration concluded that the crossing point with the expected properties is located at for the system on an lattice[2].
However, the actual structure differs from their conclusion in one crucial aspect: while the thermal line does cross the zero-temperature critical line since the latter continues toward the weak coupling limit, the pion screening mass does not vanish at this crossing point. In fact a unique point marking chiral transition as naively expected does not exist in our phase diagram. The whole region around the tip of the cusp and the thermal line is relevant for understanding the chiral properties of the thermal transition.
4.2 Dependence on quark action
The key ingredients of our analyses are the properties of the Wilson quark action that massless free quarks appear at multiple values of the hopping parameter and that the action has parity-flavor symmetry. We therefore expect the qualitative structure of our phase digram to remain valid for a more general form of Wilson-type actions including the clover action.
4.3 Dependence on
We expect our phase diagram to apply also for a larger number of flavors, at least up to , except for one difference. While simulation results strongly indicate that the thermal transition for the case is a continuous crossover and not a true phase transition, first-order signals are found for for the case of and 6 close to the zero-temperature critical line[2]. This implies that the thermal line turns into a line of a first-order phase transition while running close to the tip of the cusp of the finite-temperature critical line for these cases.
For the QCDPAX Collaboration reported that the critical line disappears even in the limit of strong coupling. Understanding this phenomenon by an extension of our line of analysis is an interesting problem left for future studies.
4.4 Continuum limit
When we increase the temporal lattice size , we expect both the thermal line and the cusp of the critical line to move toward larger . The distance between the thermal line and the tip of the cusp will diminish, probably as . To elucidate the properties of chiral transition in the continuum limit, one should measure thermodynamic observables across the thermal line in the region around the tip of the cusp and examine how they vary as a function of .
An important point to note is that the transition is a continuous crossover for finite values of . A second-order chiral phase transition, as suggested by continuum sigma model analyses for this case, would emerge only in the continuum limit .
We thank Y. Iwasaki, K. Kanaya and T. Yoshié for useful discussions. This work is supported in part by the Grants-in-Aid of the Ministry of Education (Nos. 04NP0701, 06640372).
References
- [1] M. Fukugita, S. Ohta and A. Ukawa, Phys. Rev. Lett. 57 (1986) 1974; A. Ukawa, Nucl. Phys. B(Proc. Suppl.)9 (1990) 463; R. Gupta et al., Phys. Rev. D40 (1989) 2072; K. M. Bitar et al., Phys. Rev. D43 (1991) 2396.
- [2] Y. Iwasaki et al., Phys. Rev. Lett. 67 (1991) 1491, 69 (1992) 21; Nucl. Phys. B(Proc. Suppl.)30 (1993) 327, 34 (1994) 314; hep-lat/9504019, 9505017.
- [3] C. Bernard et al., Phys. Rev. D46 (1992) 4741, 49 (1994) 3574, 50 (1994) 3377.
- [4] S. Aoki, A. Ukawa and T. Umemura, hep-lat/9508008.
- [5] S. Aoki, Phys. Rev. D30 (1984) 2653; Phys. Rev. Lett. 57 (1986) 3136; Nucl. Phys. B314 (1989) 79; hep-lat/9509008.
- [6] T. Eguchi and R. Nakayama, Phys. Lett. 126B (1983) 89.
- [7] S. Cabasino et al., Phys. Lett. B258 (1991) 195.
- [8] Y. Iwasaki et al., Nucl. Phys. B(Proc. Suppl.) 42 (1995) 502; in these proceedings.