Twisted mass QCD thermodynamics:
first results on apeNEXT
Abstract:
The motivations for simulating QCD thermodynamics with Wilson fermions and a twisted mass term are introduced. The twisted mass approach provides a natural infrared cutoff and improvement at maximal twist, and can be extended to finite temperature. Our strategy for exploring the QCD phase diagram at finite temperature in this setup, while taking advantage of the results at , is explained. The first results for the order parameters and susceptibilities on a lattice are presented. All dynamical simulations are carried out on the apeNEXT facility in Rome.
DESY 06-192
HU-EP-06/37
MS-TP-06-12
1 Motivations
Ultimately, we would like to study the finite temperature phase transition in QCD and the properties of the plasma phase (QGP), with physical values of the quark masses and in the continuum limit. The present project attempts to set the stage for such a complete study.
In this study we consider QCD with two degenerate flavors. A cross check of the lattice results obtained with staggered and Wilson fermion action will help controlling discretization artifacts, while a twisted mass term is expected to facilitate the continuum and chiral limits.
Consider the phase diagram of two-flavor QCD in the temperature-mass plane: the first order deconfinement transition stemming from the infinite mass (or quenched) theory weakens with lower quark masses, until it turns into a smooth crossover for intermediate quark masses. In the chiral limit there has to be a true phase transition again, but its nature is still under investigation [1].
As a first step of our program, we wish to find the location of the phase boundary between hadronic and plasma phase, i.e. the pseudo-critical temperature and mass combinations, while taking advantage of the properties of twisted mass QCD. This means that we will have to explore a three-dimensional space of temperature T, bare quark mass m, and twisted mass parameter .
2 Why Twisted Mass QCD Thermodynamics ?
Wilson fermions have several advantages over staggered fermions, but they also have a more subtle chiral behavior, and a complicated phase structure, both at [2, 3] and at finite temperature [4, 5, 6, 7]. The twisted mass approach improves over the standard Wilson behavior in two ways: first, it prevents the occurrence of exceptional configurations and should make it relatively easy to reach mass values of the light pseudoscalar mesons close to the physical pion mass; second, once the Wilson hopping parameter is set to its critical value, the twisted mass term behaves as a conventional quark mass, and, at the same time, an improvement is automatically guaranteed. For recent results see Refs. [8, 9] and for a review Ref. [10].
In this first report we search for the transitions between the hadronic and plasma regimes by varying the Wilson hopping parameter related to the bare quark mass by at fixed and fixed twisted mass parameter .
3 Strategy and simulations
The simulations were performed on a lattice with an improved version of the HMC algorithm as detailed in Ref. [11] and with a Symanzik tree-level improved gauge action. They used approximatively three monthscrate of apeNEXT [12]. We choose to work at and in order to take advantage of the results [8, 9]. In principle, we can then cross the (pseudo-)critical line at a fixed temperature by tuning the quark mass, either by varying and/or .
For this strategy to be successful, the simulation parameters and need to satisfy:
| (1) |
For the hadronic phase cannot exist, while for the QGP cannot exist, irrespective of the mass value.
We fixed by taking into account the lattice spacing from the studies, namely fm, fm, as well as the known critical temperatures, MeV and MeV.
In the first set of runs reported here we fixed and varied the hopping parameter .
4 Results at
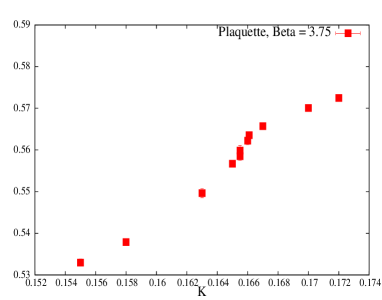
At , the results show that the minimum pion mass which can be reached with our twisted mass parameter is extrapolating existing results at [8]. Our first goal here is merely to check whether a thermal phase transition or a crossover can be found in the required range .
5 Results at = 3.9
After the exploratory study at , the choice brings us closer to the continuum limit. Results for at this are available at a number of values for the twisted mass parameter , see Ref. [9]. The minimum pion mass at for our , inferred from these results, is about 350 MeV.
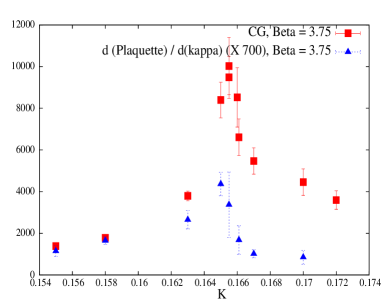
As a direct comparison between the results at the two values we show in Figure 2 the number of Conjugate Gradient iterations required for the inversion – which is an indicator of criticality – as a function of .
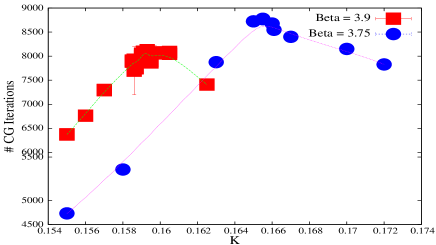
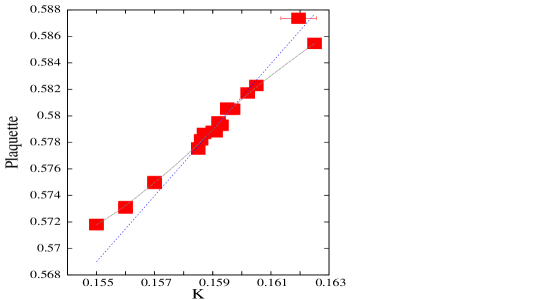
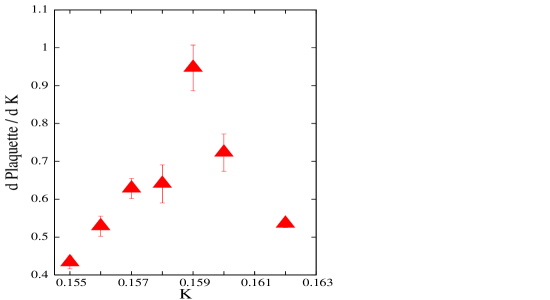
Figure 3 (left) shows a collection of results for the expectation value of the plaquette . The errors are smaller than the symbol, the solid line is a Bezier interpolation to guide the eye. We performed local fits to a straight line within subsequent intervals of width , and we show in the same diagram the tangent in the inflection point. The parameters are used as estimators of the derivative of the Plaquette w.r.t. to and are shown in Figure 3 (right). These results indicate a phase transition or crossover around located according to the maximal slope .
To make this prediction more quantitative, our statistics was enhanced to HMC trajectories on a selected sample of points: in the candidate critical region at . The results (Figure 4) suggest a long autocorrelation time in the critical region. Given these autocorrelations, our results are very preliminary. Most probably the errors are underestimated, but still the plots may serve as indicators for the location of a crossover or transition.
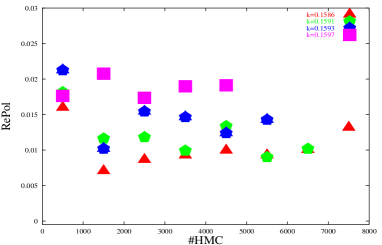
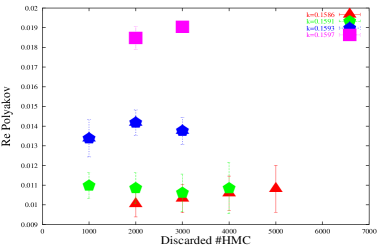
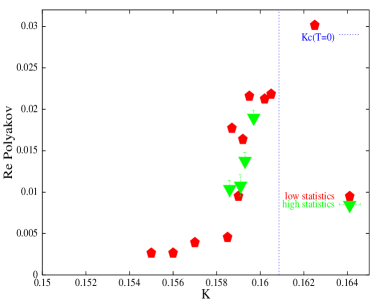
Figure 5 shows the results for the Polyakov loop: the steepening is clearly seen, mostly thanks to the latest, high statistics results. The Polyakov loop increases in the same interval as the one observed for the plaquette. The Polyakov loop histograms of the HMC results after thermalization are narrow in the two pure phases, and broaden around at , indicating an increase of the fluctuations and a critical behavior. We see no two-state signal (two peaks in the histograms), which seems to exclude a first order transition, but only a finite size analysis can assess with confidence the nature of the critical behavior.
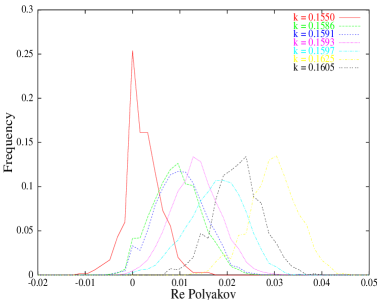
The steepest slope of the plaquette and of the Polyakov loop, as well as the broadening of the probability distributions suggest a crossover or phase transition at :
| (3) |
and, as it was also observed at ,
| (4) |
Although we postpone a detailed analysis of the spectrum and related observables to our ongoing high statistics study [13], we have collected a few results for the pion propagator.
The (zero momentum) pion propagator is measured at a selected sample of couplings, and is fitted to a standard hyperbolic cosine form
| (5) |
in the time interval [2:6].
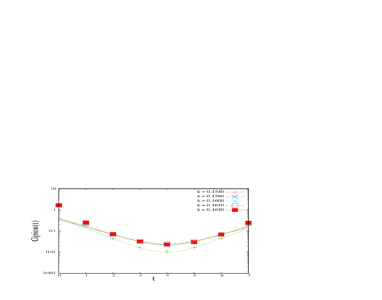
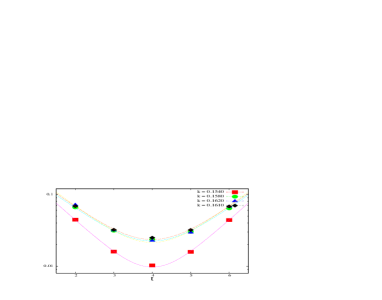
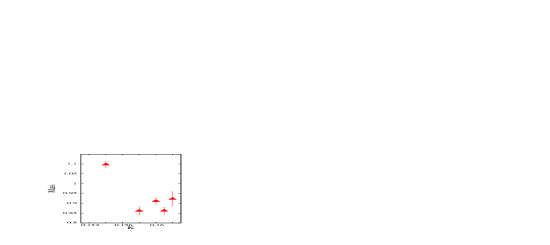
We show the quality of the results, with the fits themselves superimposed, in Fig. 6 (left and right, note a different scale between the two). The resulting fit parameters, A(mplitude) and M(ass), are collected in Fig. 7 . They indicate that the effective pion mass decreases while approaching the thermal transition from below, while the amplitude of the propagator increases, following the trend of the average plaquette.
6 Summary and Outlook
We have studied QCD with two flavors of dynamical Wilson fermions including a twisted mass term on a lattice at two values of the temperature: corresponding to MeV and corresponding to MeV.
In either cases we have simulated values of bare quark masses, by varying the hopping parameter at constant . We have observed a behavior consistent with a crossover (and not excluding a real transition) at a critical value of , which we denoted as , which is less than the critical at . This behavior is similar to that observed with ordinary Wilson fermions [4, 5].
In our current study [13] on the apeNEXT machines at DESY and INFN we have to study next the dependence of our results. To this end, we are repeating a scan at a larger value. At the same time we want to take full advantage of the twisted mass approach by working at full twist with . In this case the phase transition will be crossed by tuning the twisted mass . Model studies along the lines of Ref. [6] will be most useful to guide our simulations.
Acknowledgments: It is a pleasure to thank Mike Creutz, Roberto Frezzotti, Agnes Mocsy, GianCarlo Rossi and Carsten Urbach for interesting and helpful discussions. We wish also to thank the apeNEXT Collaboration, and in particular Alessandro Lonardo, Davide Rossetti, Hubert Simma, Raffaele Tripiccione and Piero Vicini, for their crucial help and support, as well as Giampietro Tecchiolli for granting access to the Amaro apeNEXT prototype.
References
- [1] O. Philipsen, “The QCD phase diagram at zero and small baryon density,” PoS LAT2005, 016 (2006) [PoS JHW2005, 012 (2006)] [arXiv:hep-lat/0510077]; U. Heller, these Proceedings.
- [2] E.-M. Ilgenfritz, W. Kerler, M. Müller-Preussker, A. Sternbeck, and H. Stüben, “A numerical reinvestigation of the Aoki phase with N(f) = 2 Wilson fermions at zero temperature”, Phys. Rev. D 69, 074511 (2004) arXiv:hep-lat/0309057.
- [3] F. Farchioni et al., “Twisted mass quarks and the phase structure of lattice QCD”, Eur. Phys. J. C 39, 421 (2005) arXiv:hep-lat/0406039.
- [4] A. Ali Khan et al. [CP-PACS Collaboration], Phys. Rev. D 63, 034502 (2001) [arXiv:hep-lat/0008011].
- [5] A. Ali Khan et al. [CP-PACS collaboration], Phys. Rev. D 64, 074510 (2001) [arXiv:hep-lat/0103028].
- [6] M. Creutz, “Wilson fermions at finite temperature”, arXiv:hep-lat/9608024.:
- [7] E.-M. Ilgenfritz, W. Kerler, M. Müller-Preussker, A. Sternbeck and H. Stüben, “Probing the Aoki phase with N(f) = 2 Wilson fermions at finite temperature”, arXiv:hep-lat/0511059.
- [8] F. Farchioni et al., PoS LAT2005, 072 (2006) [arXiv:hep-lat/0509131].
- [9] K. Jansen and C. Urbach [ETM Collaboration], “First results with two light flavours of quarks with maximally twisted mass”, arXiv:hep-lat/0610015.
- [10] A. Shindler, “Twisted mass lattice QCD: Recent developments and results”, PoS LAT2005, 014 (2006) arXiv:hep-lat/0511002.
- [11] C. Urbach, K. Jansen, A. Shindler and U. Wenger, “HMC algorithm with multiple time scale integration and mass preconditioning”, Comput. Phys. Commun. 174, 87 (2006) arXiv:hep-lat/0506011.
- [12] F. Belletti et al. [apeNEXT Collaboration], Nucl. Instrum. Meth. A 559, 90 (2006).
-
[13]
E.-M. Ilgenfritz, K. Jansen, M.-P. Lombardo, M. Müller-Preussker,
M. Petschlies, O. Philipsen,
A. Sternbeck, and L. Zeidlewicz, in progress.