Calculation of Neutron EDM in quenched and full QCD
Abstract:
We report on a direct lattice calculation of the neutron EDM(NEDM)
using the external electric field method in both quenched and full QCD.
In quenched QCD, we use a lattice at with
the Iwasaki gauge action and the clover fermion action to examine the
viability of this method. In particular we investigate
possible effects of violation of the periodic boundary condition
of the external electric field on the NEDM signal.
We also study the quark mass dependence of NEDM in quenched QCD, and
observe that NEDM seems to remain non-zero toward the chiral limit
because of the quenched artifact.
In 2-flavor full QCD we employ configurations generated by the CP-PACS
collaboration on a lattice at with the same
gluon and quark actions as in the quenched case.
Since the number of configurations is limited, we employ 8 different
source points per one configuration and take an average over them.
Our preliminary result at three quark masses
() indicates that
non-zero value for NEDM can be obtained in full QCD.
Statistical errors, however, are still too large to show the theoretically
expected behaviour for NEDM in full QCD that it vanishes in the chiral limit.
UTCCS-P-26
1 Introduction
Calculating the neutron electric dipole moment (NEDM) in the presence of the term of QCD has been known to be a difficult task. Various effective models in fact give order of magnitude different results for NEDM. Nonetheless, combining these rough estimates with the experimental upper bound on NEDM given by [1] yields a bound on , , which confirms the existence of the strong CP problem. Our aim here is to give a more accurate and reliable estimate of NEDM in the presence of the term based on lattice QCD calculations. Such a result will be indispensable in order to extract the value of from a non-zero value of NEDM should it be observed in future experiments.
The first lattice calculation of NEDM failed to obtain a signal[2]. Fifteen years later we proposed a formulation to extract NEDM form factors and numerically verified that the method works in quenched QCD with the domain-wall fermion[3]. In the same year, this formulation was employed in a full QCD calculation with the domain-wall fermion[4]. They, however, could obtain only an upper bound on the NEDM value. At lattice 2005, we returned to the original external electric field method proposed in Ref. [2], and reported our preliminary results for NEDM from this method with both domain-wall and clover fermions in quenched QCD[5].
In this report we carry out further numerical studies in the external electric field method with the clover fermion. We first investigate the problem with this method that a large discontinuity (gap) appears in the uniform electric field at the boundary in the time direction violating the periodic boundary condition. From this investigation we learn how we can minimize the unwanted effect of the gap to NEDM signals. Using this knowledge, we apply the method to both quenched and full QCD calculations at several quark mass parameters in order to investigate the quark mass dependence of NEDM.
2 Formulation
In our calculation, NEDM is extracted from the interaction term between the electric field and the neutron spin in the Hamiltonian:
| (1) |
where represents the magnitude of NEDM, and is the CP violating phase of the strong interaction. For small we can expand , and hereafter we ignore higher order terms in .
A uniform and static electric field in Minkovski space is introduced by replacing the link variable as
| (2) |
where represents the quark charge: for up quark and for down quark. This replacement, however, destroys the periodicity of at the boundary :
| (3) |
As a consequence, uniformity of the electric field is violated between and . In section 3.1 we will numerically investigate the effect of this non-uniformity to the EDM signal.
To include the effect of the term, we reweight the nucleon propagator with :
| (4) |
where denotes spinor indicies of the nucleon. We may reduce the sign problem due to the complex reweighting factor by taking small. On the other hand, we have to accumulate a large number of configurations to ensure correct distribution of topological charge , since results of NEDM strongly depend it.
For the electric field in direction, , the ratio of nucleon propagator between spin up and down components has the following dependence:
| (5) |
where is constant in but depends on and , and the dots represent contributions from excited states. We further take the following triple ratio in order to subtract fake contributions from and caused by finite statistics.
| (6) |
We finally take the ratio between and , in order to remove contributions as
| (7) |
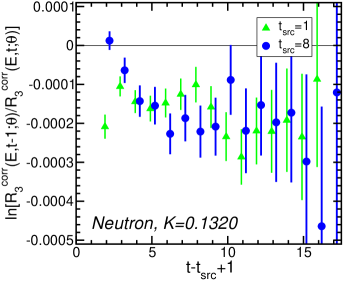
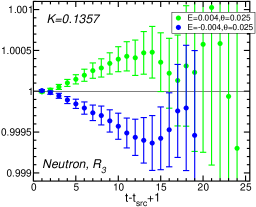
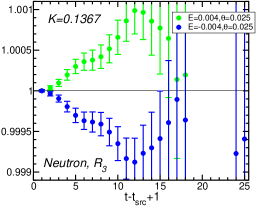
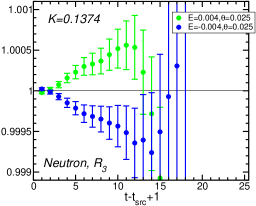
In section 3 we will show the time dependence of for both and , and we will also plot the effective mass of .
3 Numerical results
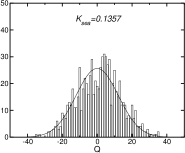
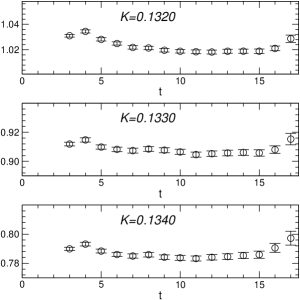
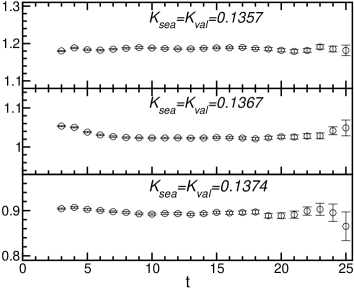
In our calculation we employ the RG improved (Iwasaki) gauge action and the clover fermion action with the tadpole improved tree value of . The improved field theoretical definition of the topological charge is employed, after 20 cooling steps in quenched QCD and 50 cooling steps in full QCD. In Fig. 1 the histogram of the topological charge distribution is plotted in quenched QCD at (leftmost) and in full QCD at and (second from left), (third), (fourth). Smeared sources with the form of is employed in our calculation. In Fig. 2, the effective mass of nucleon at and is plotted in quenched QCD (left) and full QCD (right) at several values of the quark mass.


3.1 Effects of non-uniform electric field in quenched QCD
We first investigate the effect of a non-uniform electric field at the boundary to EDM signals, using quenched QCD on a lattice at , which corresponds to GeV. We use and in this study. We always put the gap (discontinuity) of the electric field between and , denoting this as . For comparison, we place the nucleon source at two different time slices: and . To reduce the computational cost we take a heavy fermion mass corresponding to . On the left of Fig. 3 we compare the time dependence of between and . We observe that the dependences are much different between the two cases near source points (). On the other hand, at large (), the two cases show similar behaviors. This indicates that the gap affects the EDM signal near while its influence almost disappears at large which satisfies . Therefore the result with is expected to be free from the influence of the gap.
This tendency is also seen from the comparison of the effective mass plot between two sources, given on the right of Fig. 3. We observe a plateau at for the case of . For the case of , there is a candidate for a plateau at . However, the value in this range of disagrees with that from the plateau of data. Therefore, we should conclude that this is not a real plateau, but a fake effect due to the gap. In fact, looking further away from the source, we observe a plateau at the range for whose value is in agreement with that for .
Our study concludes that we should place the source point as far from the gap as possible in order to avoid the influence of the gap to EDM signals. The condition that seems necessary in this method for the EDM calculation.
3.2 Preliminary results in full QCD
We apply our method of EDM calculations to flavor full QCD configurations on a lattice at corresponding to GeV, generated by CP-PACS collaboration[6] using RG improved gauge and tadpole improved clover fermion actions. In this calculation we take and and employ four values for valence quark masses, which are equal to sea quark masses of full QCD ( , , , ) in order to perform the chiral extrapolation.
As shown in section 3.1, the influence of the non-uniform electric field at the boundary to the EDM signal is largely suppressed if . In this full QCD calculation, we take the maximal separation, namely on a lattice. Since the distance between the gap and the source for the positive time direction () is same as the one for the negative time direction () in this setup due to the periodic boundary condition in time, we can utilize both forward and backward propagations of nucleon for EDM calculations.
Our study in quenched QCD indicates that the number of full QCD configurations available (about 770) is not sufficient for our method of EDM calculations. In order to effectively increase statistics, we employ 8 different source points per one configuration, choosing (6,30), (12,36), (18,42), (24,48), (30,6), (36,12), (42,18) , (48,24). The decrease of statistical errors we observe in our results indicates that data from these source points are almost independent. Therefore the total number of statistics is more than 12,000, including forward and backward propagations.
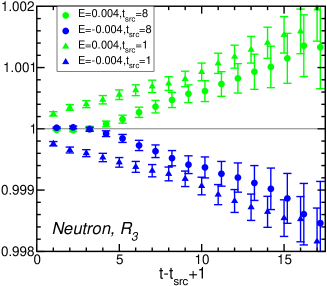
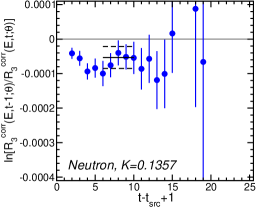
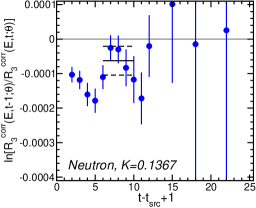
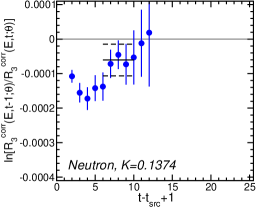
The top panels of Fig. 4 plot as a function of for and for each . We clearly observe non-zero signals, which shows the expected dependence on the sign of . Furthermore the sign of the slope (positive for positive ) agrees with that in the quenched case. By fitting with the exponential form (7) over we obtain
| (8) |
at . Similarly we have
| (9) |
at and . The statistical error is still large.
3.3 Quark mass dependence in quenched and full QCD
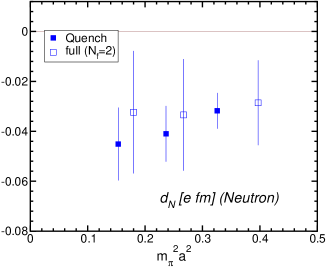
As is well known, NEDM vanishes in the zero quark mass limit since term can be transformed to by a chiral rotation. In quenched QCD, however, this property does not hold since the quark determinant is set to unity. There exist no QCD-based theoretical prediction for the quark mass dependence of NEDM in quenched QCD. The instanton liquid model [7] predicts a divergence, while partially quenched chiral perturbation theory[8] leads to the behavior toward the chiral limit.
In Fig. 5 we plot values of NEDM as a function of pion mass squared. In quenched QCD these values are obtained after averaging over three direction of the electric field. We take as the fitting range since is employed in this quenched calculation. We clearly observe a non-vanishing behavior toward the chiral limit in quenched QCD. We are not able to determine, however, the precise quark mass dependence to distinguish from due to large statistical errors and lack of sufficient quark mass points. In full QCD statistical errors are too large to confirm that NEDM vanishes in the chiral limit. We are currently increasing the number of source points to reduce statistical errors.
4 Conclusions
In this report we presented our lattice calculation of NEDM using the external electric field method. In quenched QCD we investigate the effect from the gap (discontinuity) of the electric field, by comparing different two source points at the fixed gap point. From this investigation we learn that the effect of the gap to NEDM signals can be reduced by placing the source point away from the gap. We also obtained results which show that NDEM does not vanish toward the chiral limit, as indicated by some models. This, however, is a quenching artifact.
In two-flavor full QCD, we obtained, for the first time in full QCD simulations, a non-zero value for NEDM. This is made possible by carefully avoiding the effect of the gap in the electric field by placing the source as far away as possible from the gap, and by accumulating a large number of statistics (over 12,000) by averaging over 8 source points and over both forward and backward propagation of the nucleon. The statistical error is still large (60-80%). Clearly we have to increase statistics in our full QCD calculations, by employing more source points and/or different directions of the electric field, in order to perform a reliable chiral extrapolation of NEDM to the physical quark mass. After this attempt, we will proceed to our final project, a calculation of NEDM in full QCD.
This work is supported in part by Grant-in-Aid of ministry of Education (Nos. 13135204, 13135216, 15540251, 16540228, 17340066, 17540259, 18104005, 18540250 ) Numerical simulations are performed on Hitachi SR11000 at High Energy Accelerator Research Organization (KEK), Hiroshima University and Tokyo University. At KEK this simulation is under support of Large Scale Simulation Program (No. 06-04).
References
- [1] P. G. Harris et al., Phys. Rev. Lett. 82, 904 (1999).
- [2] S. Aoki, A. Gocksch, Phys. Rev. Lett. 63, 1125 (1989); erratum, ibid. 65, 1172 (1990).
- [3] E. Shintani, et al., Phys. Rev. D72, 014504 (2005).
- [4] F. Berruto, T. Blum, K. Orginos, A. Soni, Nucl. Phys. Proc. Suppl. 140, 411 (2005); T. Blum, Proc. Sci. LAT2005, 010 (2005); F. Berruto, T. Blum, K. Orginos, A. Soni, Phys. Rev. D73, 054509 (2006).
- [5] E. Shintani et al., talk given at LATTICE’05, hep-lat/0509123
- [6] S. Aoki, et al., (CP-PACS Collaboration), Phys. Rev. D65, 054505 (2002); erratum ibid. D67, 059901 (2003).
- [7] P. Faccioli, D. Guadagnoli, S. Simula, Phys. Rev. D70, 074017 (2004).
- [8] D. O’Connell and M. J. Savage, Phys. Lett. B633, 319 (2006).